Draw Boxplot with Precomputed Values in R (3 Examples)
In this post, I’ll demonstrate how to create a boxplot with previously calculated statistics in R programming.
The article will contain these content blocks:
Let’s just jump right in…
Creation of Example Data
Consider the example data below:
whisker_lower <- 1                                  # Predefined boxplot values
quartile_1st <- 2
median <- 3
quartile_3rd <- 4
whisker_upper <- 5
As you can see, we have defined different data objects containing summary statistics such as the lower whisker, the first quartile, the median, the third quartile, and the upper whisker.
In the following examples, I’ll draw different box-and-whisker plots based on these values.
Example 1: Draw Boxplot from Previously Calculated Statistics Using Base R
The following R syntax shows how to create a boxplot with predefined statistics using the basic installation of the R programming language.
For this task, we first have to create a list object that contains our summary statistics:
data_base <- list(stats = matrix(c(whisker_lower,   # Create list of values
                                   quartile_1st,
                                   median,
                                   quartile_3rd,
                                   whisker_upper),
                                 nrow = 5),
                  n = 100)
data_base                                           # Print list of values
# $stats
#      [,1]
# [1,]    1
# [2,]    2
# [3,]    3
# [4,]    4
# [5,]    5
#
# $n
# [1] 100
Next, we can use the bxp function to draw a Base R boxplot using this list:
bxp(data_base) # Draw Base R boxplot

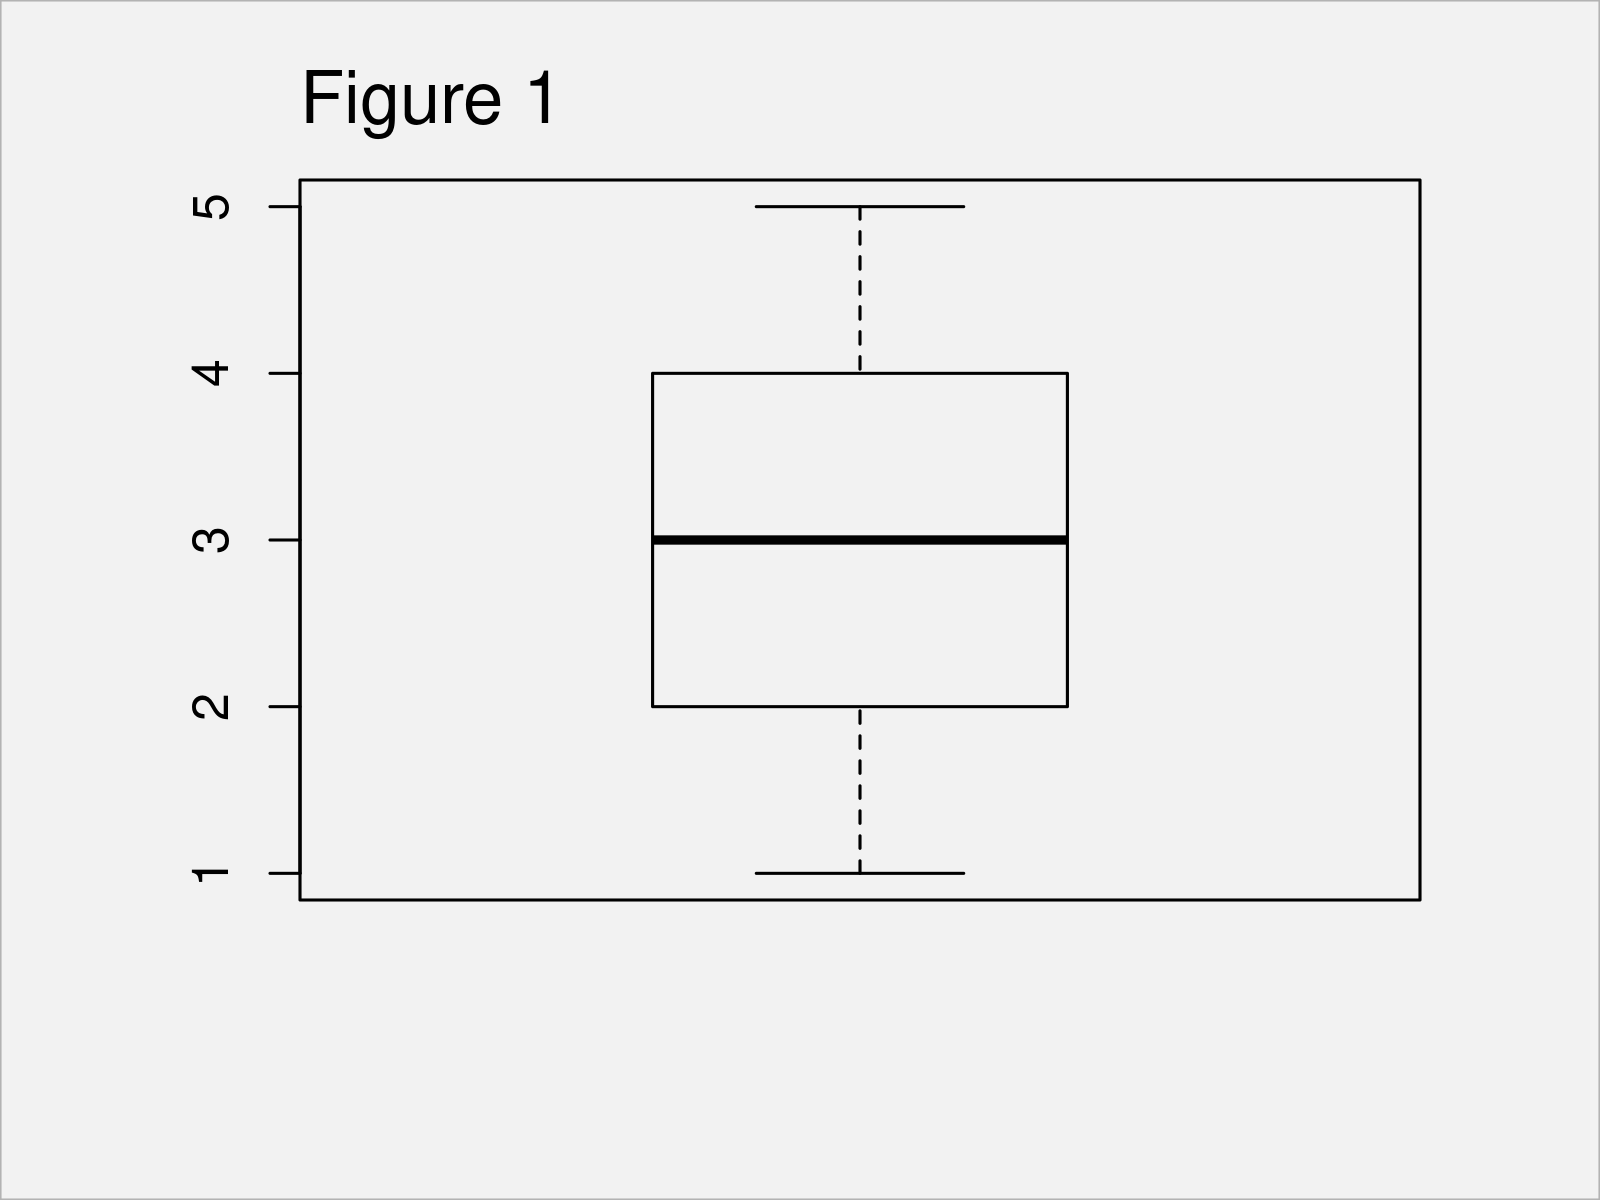
After running the previous code the boxplot shown in Figure 1 has been created.
Example 2: Draw Boxplot from Previously Calculated Statistics Using ggplot2 Package
In Example 2, I’ll demonstrate how to use the ggplot2 package to visualize preliminary computed statistics in a boxplot.
In order to use the functions of the ggplot2 package, we first need to install and load ggplot2 to R:
install.packages("ggplot2")                         # Install ggplot2 package
library("ggplot2")                                  # Load ggplot2 package
In the next step, we have to create a data frame that contains each of these values in a separate column. Note that we also have to define a group column (more on that later):
data_ggplot2_a <- data.frame(group = "A",           # Create data frame of values
                             whisker_lower,
                             quartile_1st,
                             median,
                             quartile_3rd,
                             whisker_upper)
data_ggplot2_a                                      # Print data frame of values
#   group whisker_lower quartile_1st median quartile_3rd whisker_upper
# 1     A             1            2      3            4             5
Next, we can draw a ggplot2 boxplot of our precomputed values using the following R programming syntax:
ggplot(data_ggplot2_a,                              # Draw ggplot2 boxplot
       aes(x = group,
           ymin = whisker_lower,
           lower = quartile_1st,
           middle = median,
           upper = quartile_3rd,
           ymax = whisker_upper)) +
  geom_boxplot(stat = "identity")

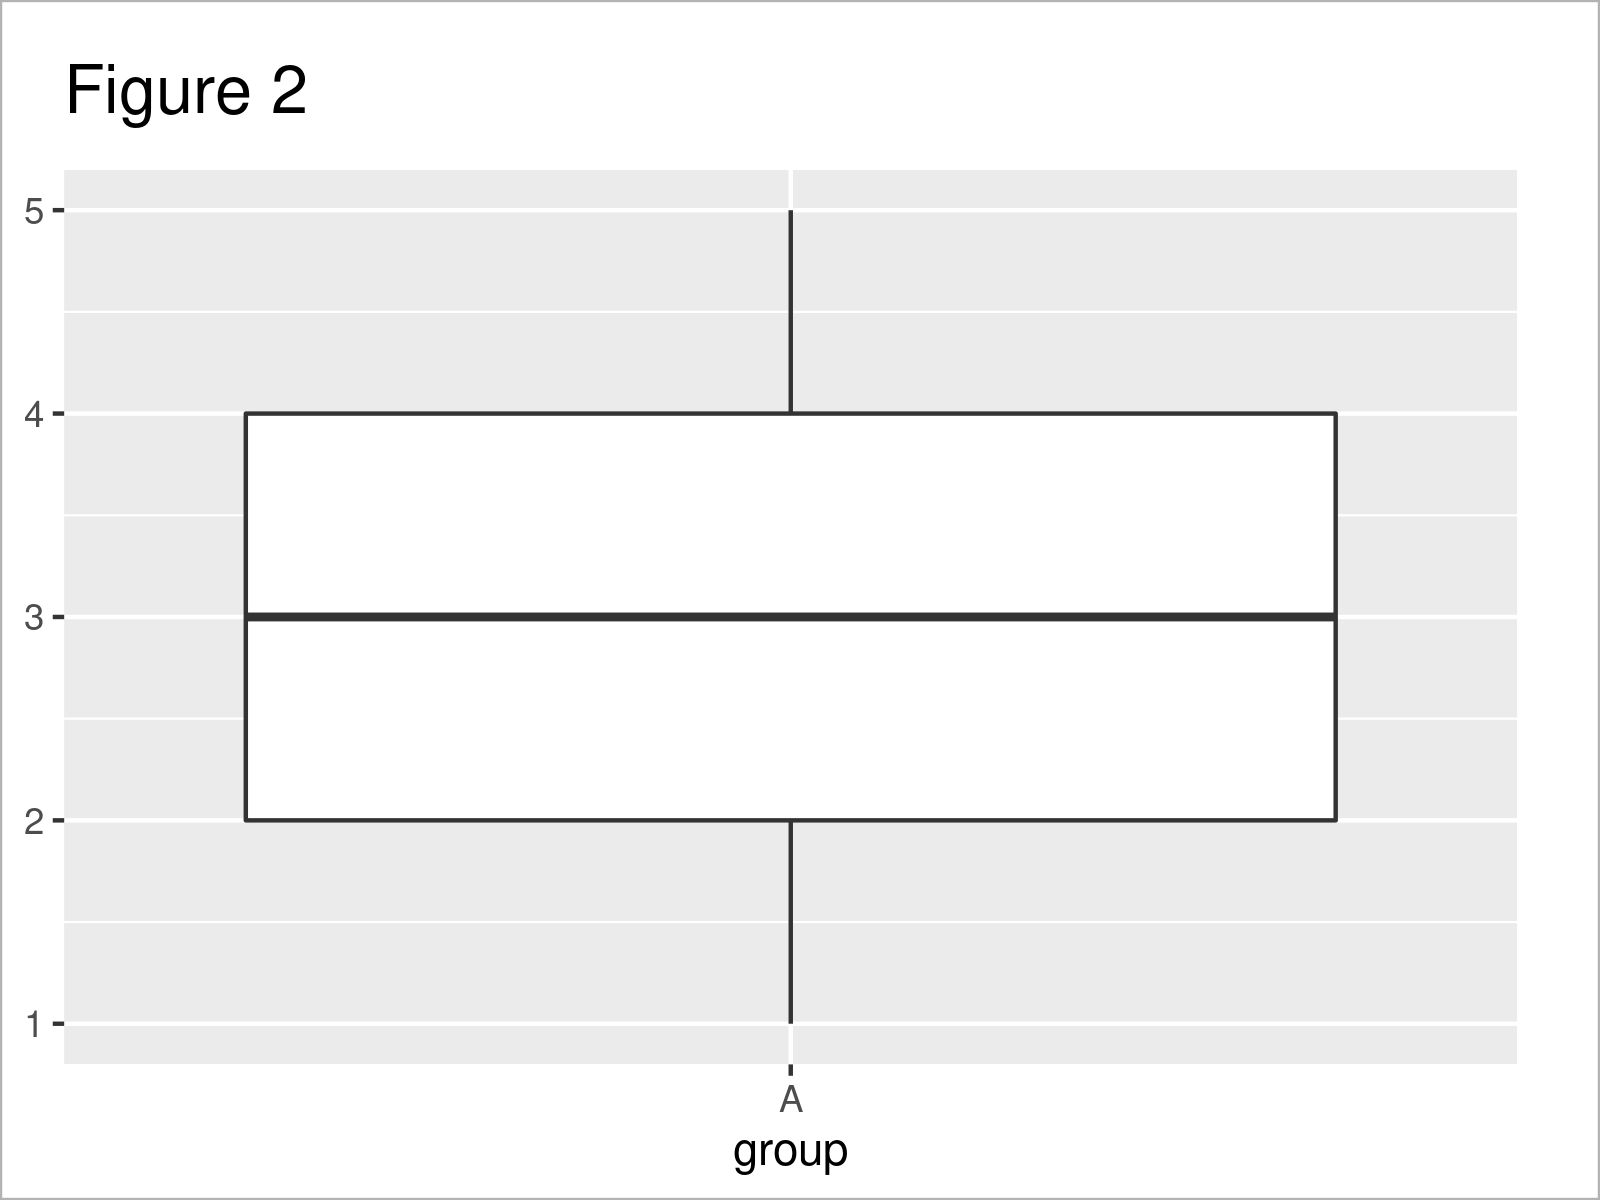
Figure 2 shows the output of the previous R syntax: A ggplot2 box-and-whisker graphic.
Example 3: Draw Multiple Boxplots from Previously Calculated Statistics Using ggplot2 Package
It is also possible to visualize multiple boxplots in the same graph using precomputed statistics.
The following R code demonstrates how to use the ggplot2 package for this task.
First, we have to create another data frame that contains the summary statistics for each of our boxplots.
Note that this data frame contains more than only one row (in contrast to the previous example), and each row corresponds to the values of one box. Hence, we also have to specify a different name in our group column:
set.seed(35933467)                                  # Set seed for reproducibility
data_ggplot2_b <- data.frame(group = LETTERS[1:5],  # Create data frame of values
                             whisker_lower = runif(5, 0, 1),
                             quartile_1st = runif(5, 2, 3),
                             median = runif(5, 4, 5),
                             quartile_3rd = runif(5, 6, 7),
                             whisker_upper = runif(5, 8, 9))
data_ggplot2_b                                      # Print data frame of values
#   group whisker_lower quartile_1st   median quartile_3rd whisker_upper
# 1     A     0.9262437     2.889869 4.735447     6.558203      8.469959
# 2     B     0.6467560     2.377049 4.687105     6.433691      8.514927
# 3     C     0.3377117     2.416039 4.596075     6.248669      8.752890
# 4     D     0.4995906     2.031376 4.321016     6.349309      8.917748
# 5     E     0.8854471     2.133109 4.458979     6.933599      8.105374
Now, we can use this data set to draw a graphic containing multiple boxplots:
ggplot(data_ggplot2_b,                              # Draw multiple ggplot2 boxplots
       aes(x = group,
           ymin = whisker_lower,
           lower = quartile_1st,
           middle = median,
           upper = quartile_3rd,
           ymax = whisker_upper,
           fill = group)) +
  geom_boxplot(stat = "identity")

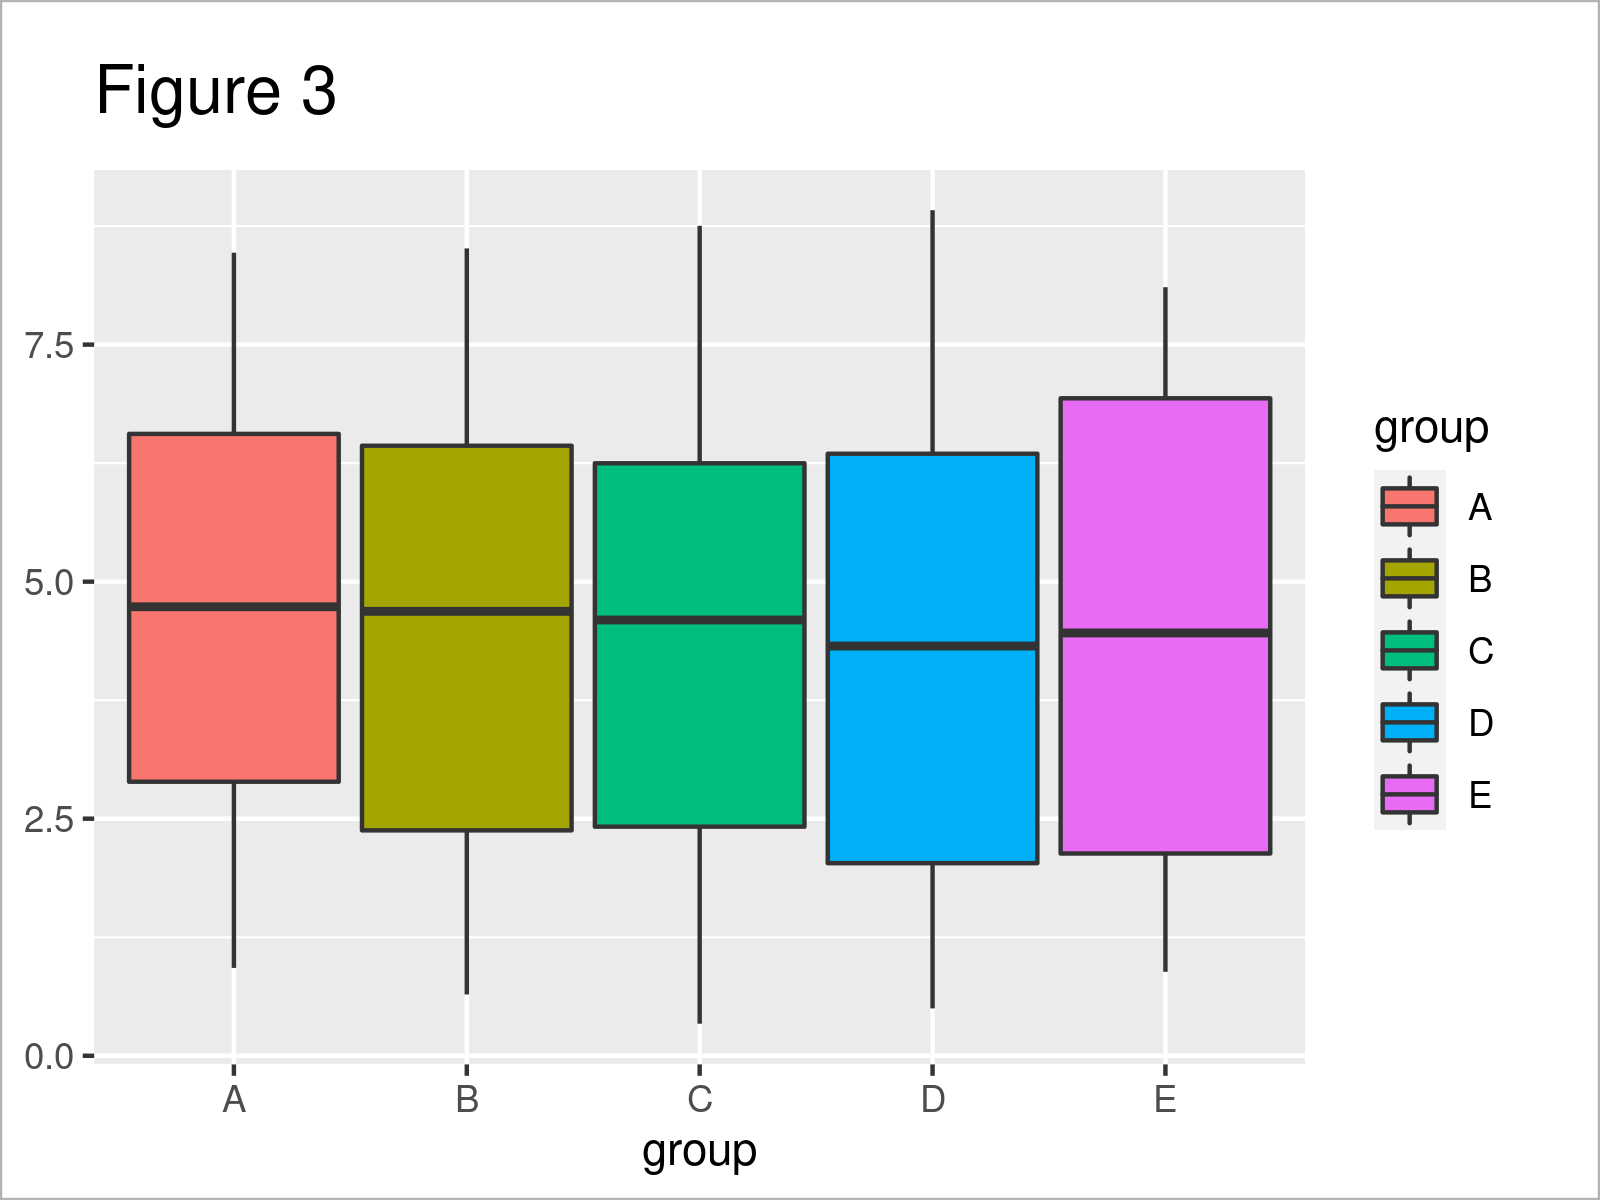
After executing the previous R programming syntax the ggpot2 graphic with multiple boxplots shown in Figure 3 has been created.
Video & Further Resources
Would you like to know more about the creation of a box-and-whisker plot with previously computed values? Then you could watch the following video on my YouTube channel. In the video, I demonstrate the R syntax of this tutorial:
In addition, you might have a look at the other articles on statisticsglobe.com. I have published numerous articles that are related to the creation of a box-and-whisker plot with previously computed values already.
- How to Draw a plotly Boxplot in R
- Draw Boxplot with Means in R
- Draw Plot with Actual Values as Axis Ticks & Labels
- Graphics in R
- The R Programming Language
You have learned in this tutorial how to draw a boxplot with previously calculated statistics in R programming. Let me know in the comments section below, if you have additional questions.


2 Comments. Leave new
Nice solution! Thanks!
Thanks Xavier, glad it was helpful! 🙂