Calculate Group Mean & Add as New Column to Data Frame in R (3 Examples)
In this tutorial, I’ll show how to calculate the mean by group and assign the result as a new variable to a data frame in R.
Table of contents:
Let’s jump right to the R code!
Creation of Example Data
We’ll use the following data as a basis for this R programming language tutorial:
data <- data.frame(value = c(1, 4, 5, 2, 5, 4),          # Create example data frame
                   group = rep(LETTERS[1:3], each = 2))
data                                                     # Print example data frame

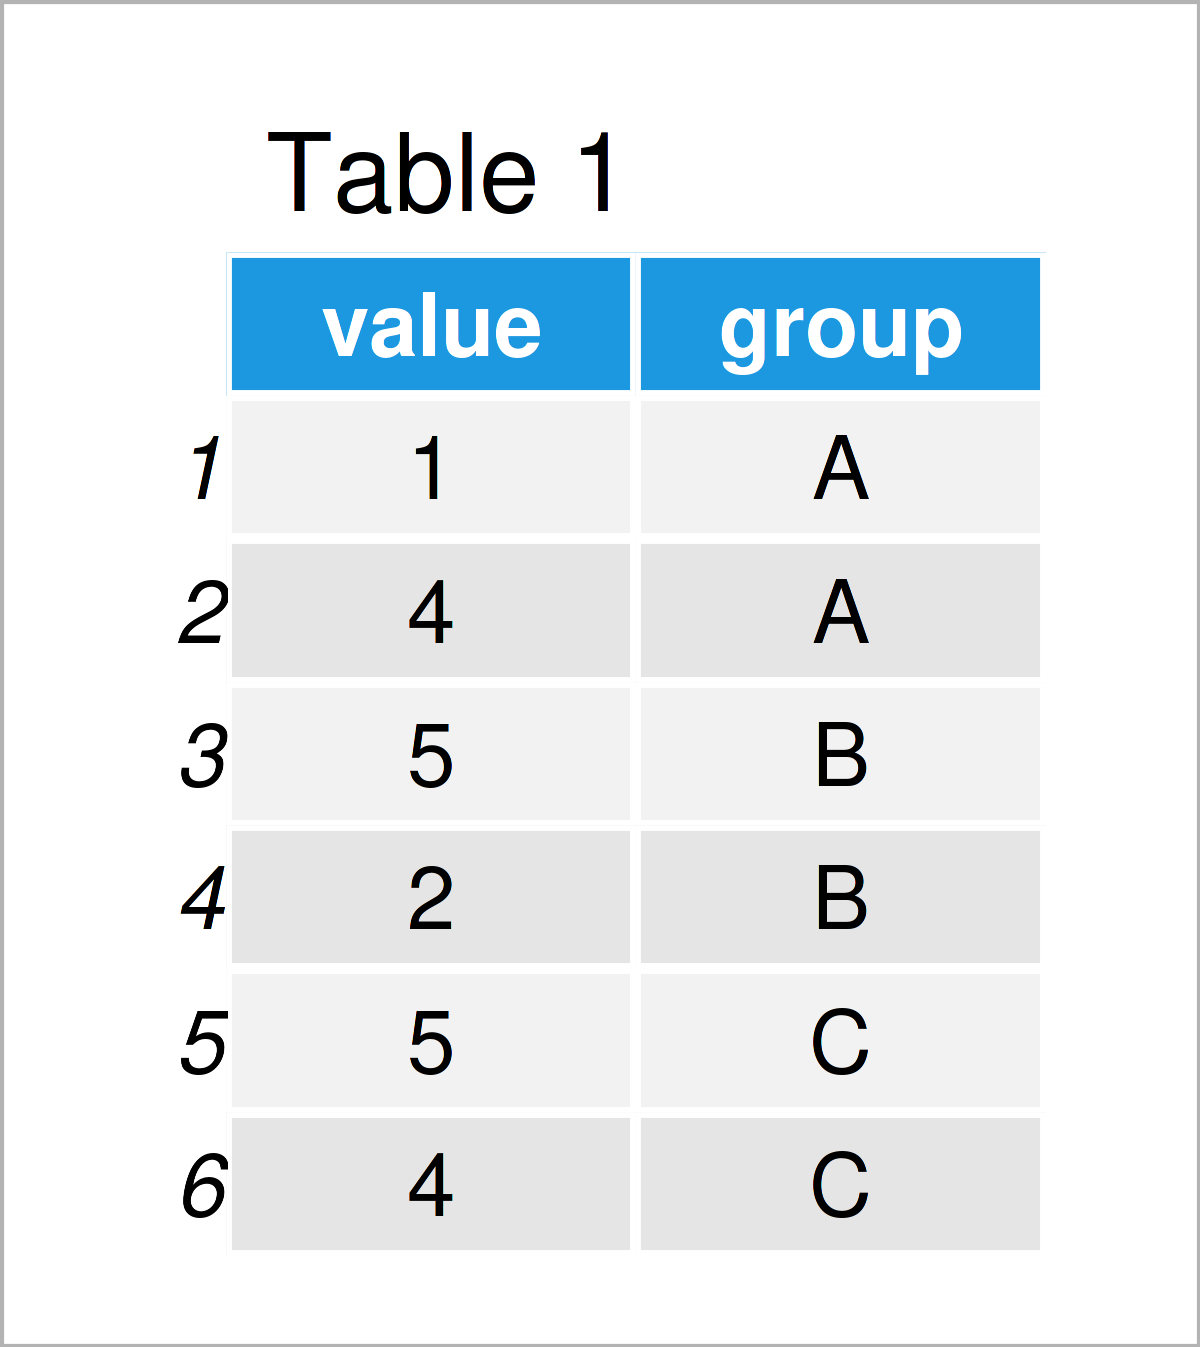
Table 1 visualizes the structure of the example data – It contains six rows and two columns. The column value is numerical, and the column group is a character.
Example 1: Calculate Mean by Group & Add as New Column Using ave() Function
In this example, I’ll show how to return the mean by group, and how to add this output as a new column to an existing data frame.
Consider the R code below:
data_new1 <- data                                        # Duplicate data frame
data_new1$gr_mean <- ave(data$value, data$group)         # Calculate mean by group
data_new1                                                # Print new data frame

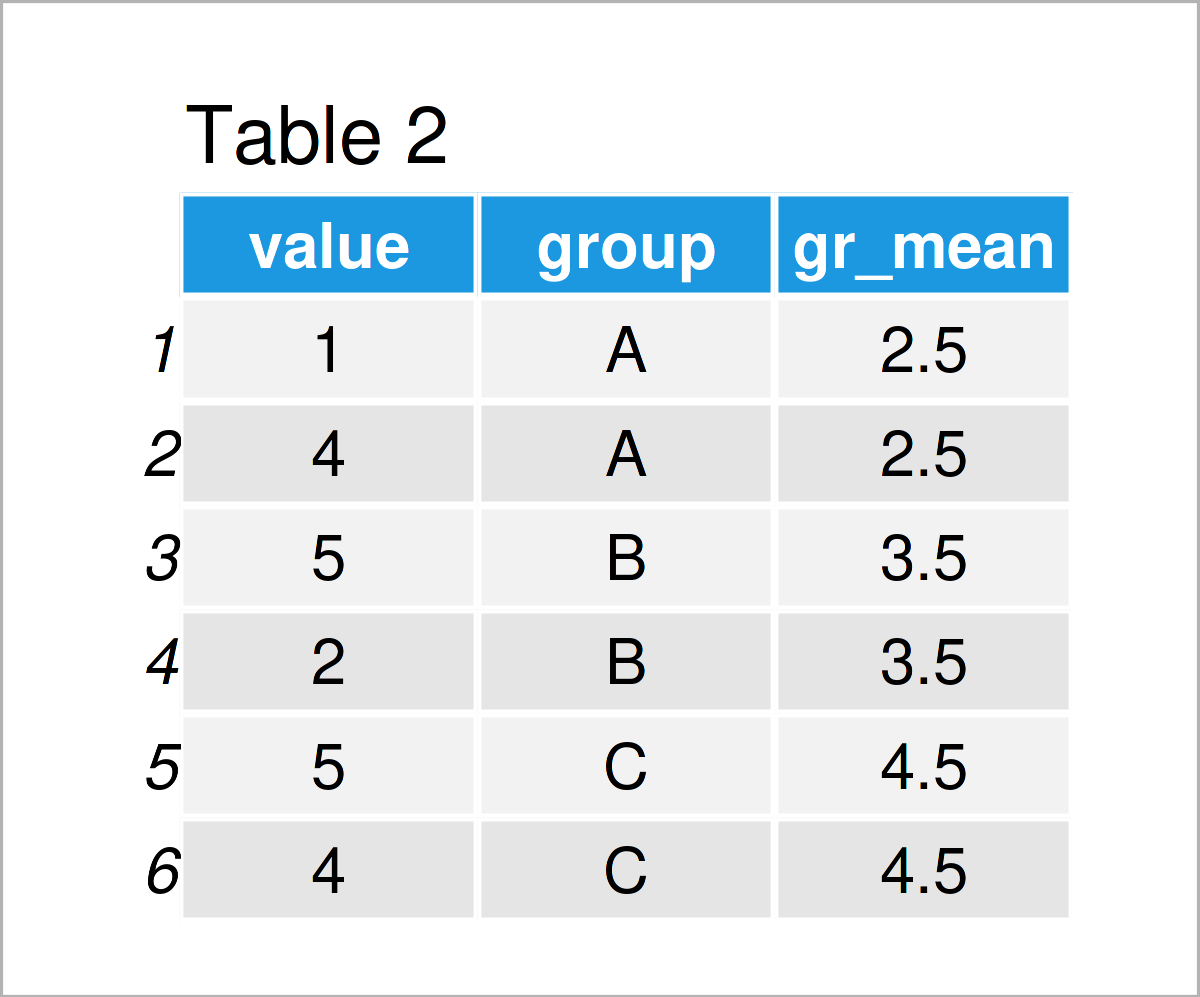
As shown in Table 2, we have created a new data frame object that contains our original data as well as an additional column that contains the mean by group.
Example 2: Calculate Mean by Group & Add as New Column Using group_by() & mutate() Functions of dplyr Package
In Example 2, I’ll explain how to use the dplyr packageto calculate the group mean and assign it as a new variable.
First, we need to install and load the dplyr package:
install.packages("dplyr")                                # Install & load dplyr package
library("dplyr")
Next, we can apply the group_by and mutate functions to add the group averages as a new variable to our data set.
Note that I’m also using the as.data.frame function to keep the data.frame class. This line of code might be skipped in case you prefer to work with tibbles instead of data frames.
data_new2 <- data %>%                                    # Calculate mean by group
  group_by(group) %>%
  mutate(gr_mean = mean(value)) %>%
  as.data.frame()
data_new2                                                # Print new data frame

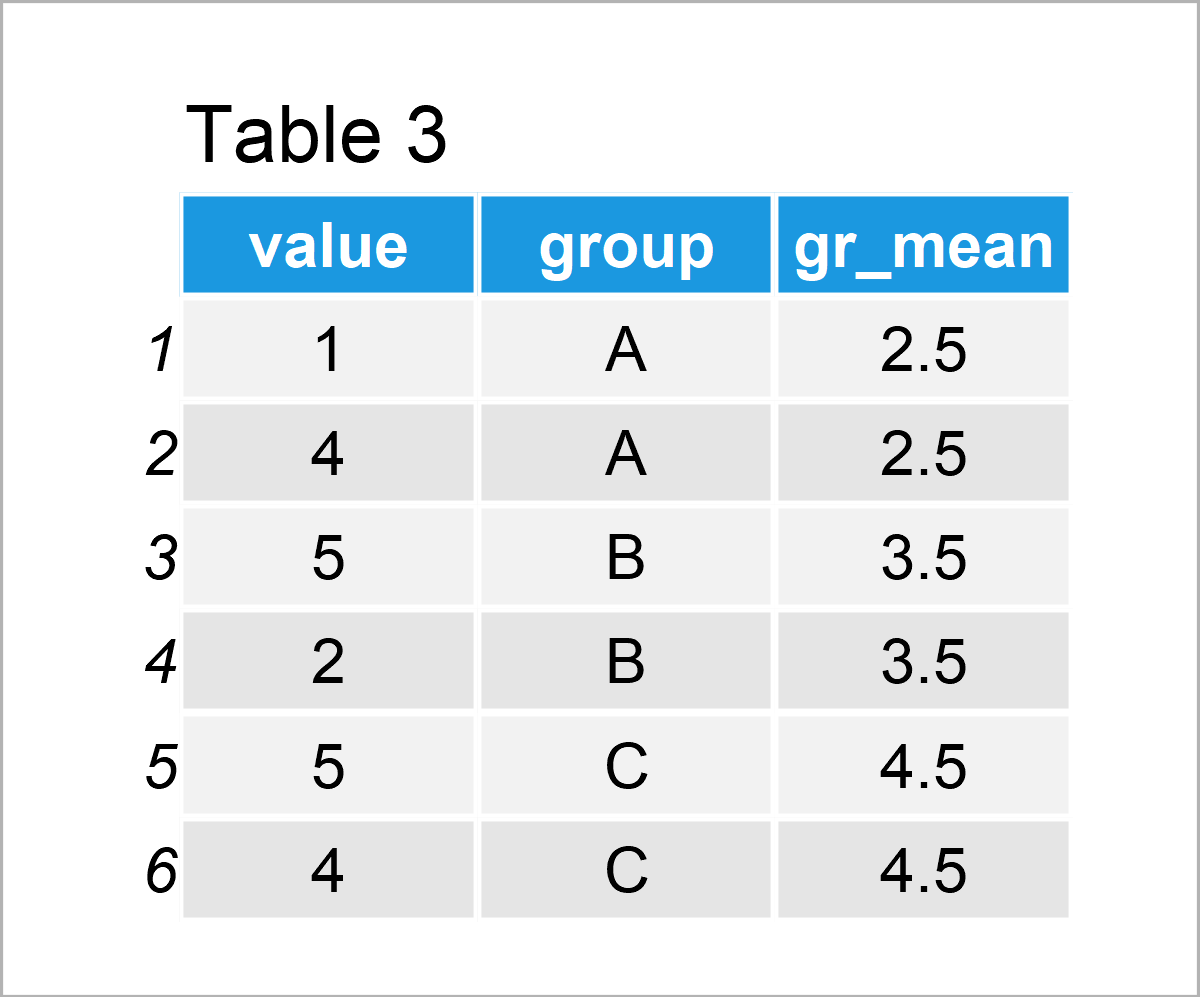
By running the previously shown R syntax, we have created Table 3, i.e. another data frame.
This data frame contains exactly the same values as the data frame created in Example 1. However, this time we have used the dplyr package for this task.
Example 3: Calculate Mean by Group & Add as New Column Using setDT() Function of data.table Package
The following R programming syntax demonstrates how to apply the functions of the data.table package to assign a group mean column to an already existing data frame.
First, we need to install and load the data.table package:
install.packages("data.table")                           # Install & load data.table package
library("data.table")
In the next step, we can apply the setDT function to assign a group average column.
As in Example 2, I’m using the data.frame function to keep the data.frame class instead of the data.table class. This step is optional.
data_new3 <- data                                        # Duplicate data frame
setDT(data_new3)[ , gr_mean := mean(value), by = group]  # Calculate mean by group
data_new3 <- as.data.frame(data_new3)                    # Convert data.table to data.frame
data_new3                                                # Print new data frame

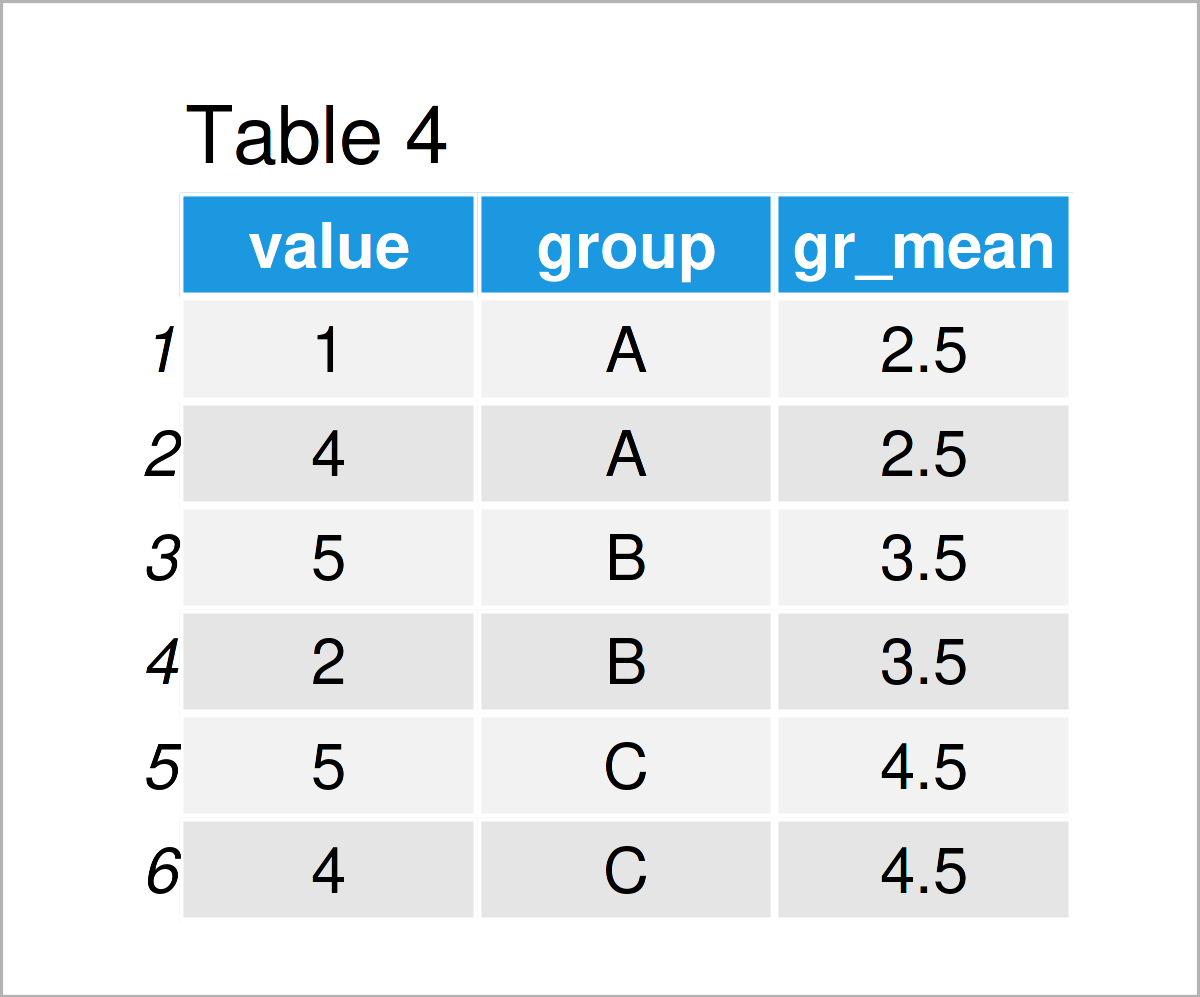
In Table 4 you can see that we have created another data frame with the previously shown code. It contains the same elements as the previously created data frames in Example 1 and 2.
Video, Further Resources & Summary
Do you want to know more about the computation of the group mean and the addition of the result as a new column to a data frame? Then you might want to have a look at the following video on my YouTube channel. In the video, I’m explaining the R programming syntax of this post:
Furthermore, you might want to have a look at the other articles that I have published on this website.
- Append to Data Frame in Loop
- Add New Row at Specific Index Position to Data Frame
- Insert New Column Between Two Data Frame Variables
- Extract Single Column as Data Frame in R
- Add New Row to Data Frame in R
- All R Programming Tutorials
In this article, I have illustrated how to compute the aggregated group mean and add the result as a new column to a data frame in the R programming language. In case you have further questions, don’t hesitate to tell me about it in the comments. Besides that, don’t forget to subscribe to my email newsletter for updates on the newest posts.


4 Comments. Leave new
Dear Joachim,
Thank you very much for this tutorial!
Just a question: at the end of Example 2, you write “This data frame contains exactly the same values as the data frame created in Example 1”, but actually, this is not the case. In Example 1, the mean has indeed been calculated by groups, but in Example 2, the mean has been calculated over all cases (i.e., 3.5 in each row).
I was using your code and facing exactly this issue; do you know how to obtain the same values as in Example 1 by using the dplyr package?
Thanks for your help!
Hello!
Thank you for pointing that out. The figure is apparently incorrect, now it is successfully changed. But the code is correct, it is strange that you don’t get the same results as Example 1. Can you share your code?
Regards,
Cansu
Thank you for your answer!
I just found the problem, the plyr package was masking de dplyr package. So everything is working now!
Best regards
Thank you for sharing. It happens quite often while using the dplyr package.
Regards,
Cansu