Draw Border Around Plot in Base R (3 Examples) | How to Apply the box() Function
In this R post you’ll learn how to draw a border around a plot using the box function.
The article looks as follows:
Here’s how to do it.
Creation of Example Data
As the first step, I’ll need to create some example data:
x <- 5:1                             # Create first example vector
x                                    # Print first example vector
# [1] 5 4 3 2 1
y <- 4:8                             # Create second example vector
y                                    # Print second example vector
# [1] 4 5 6 7 8
As you can see based on the previously shown outputs of the RStudio console, we have created two example vectors containing five integer values each.
Now, we can create a graphic of the data as shown below:
plot(x, y) # Draw plot

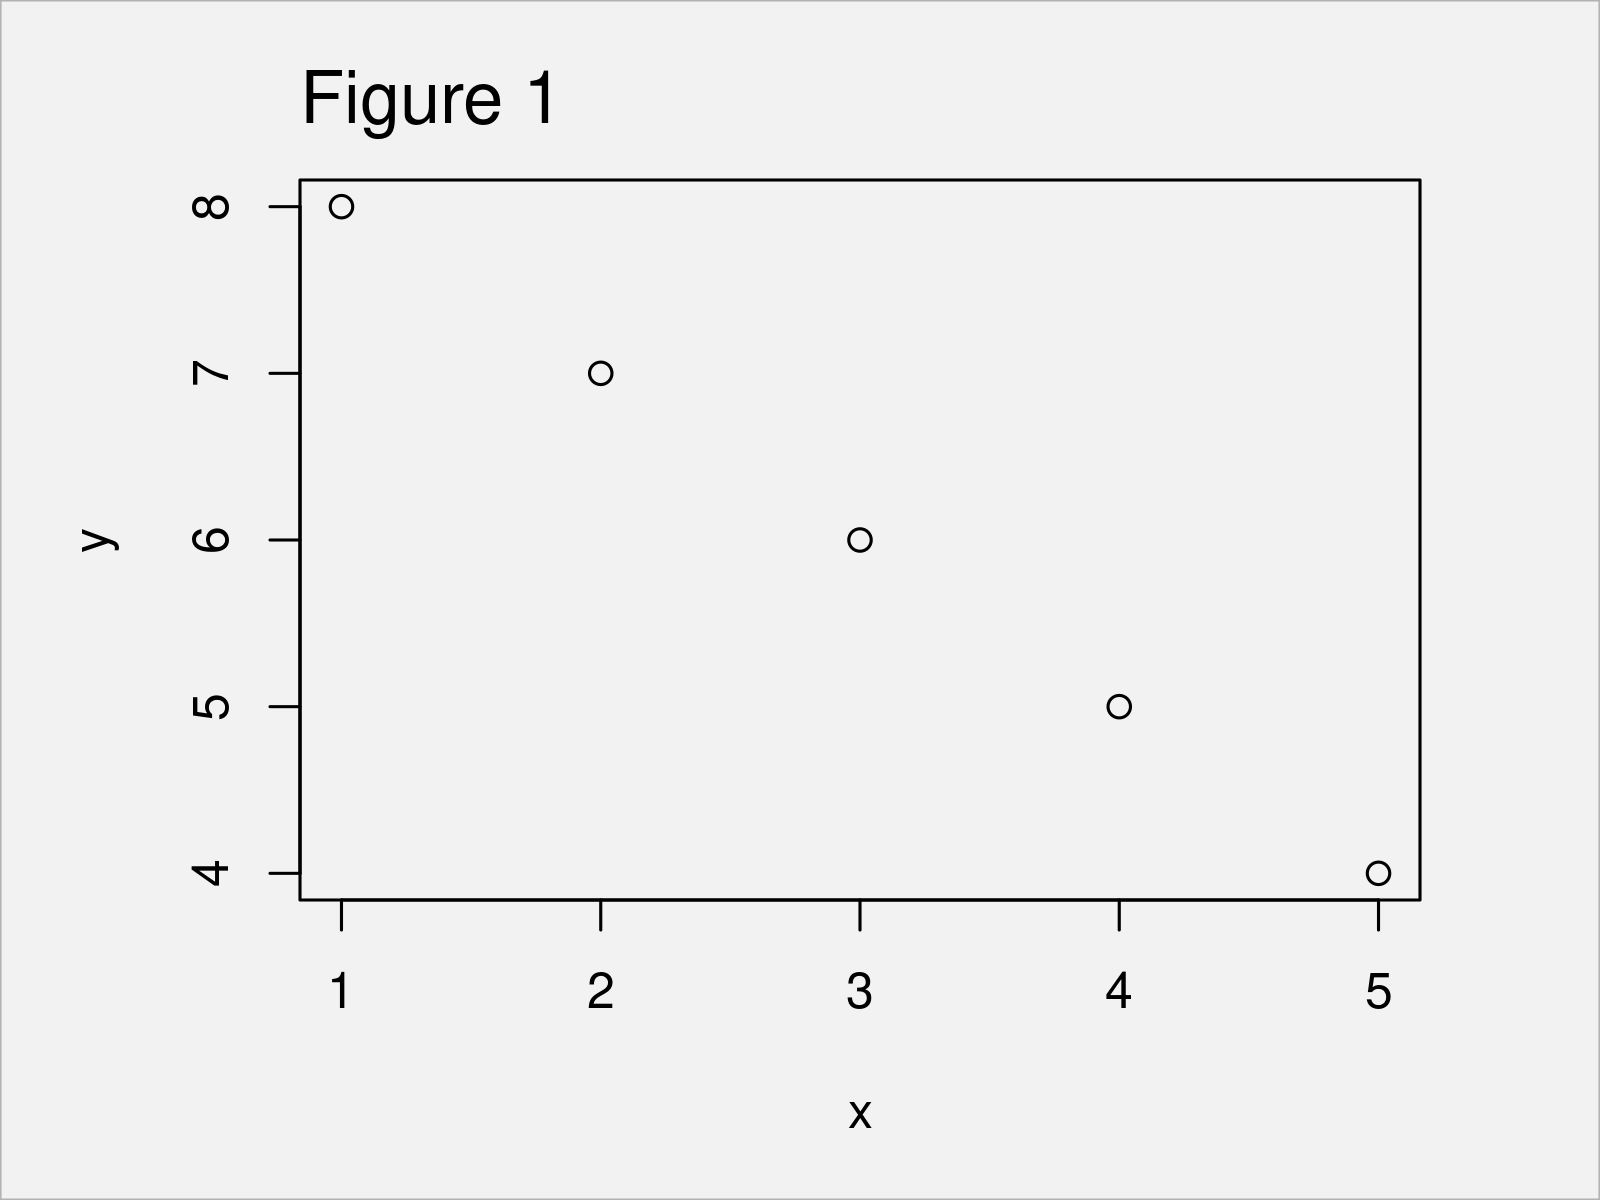
As illustrated in Figure 1, the previous R syntax has created a Base R scatterplot.
Example 1: Add Box Around Plot
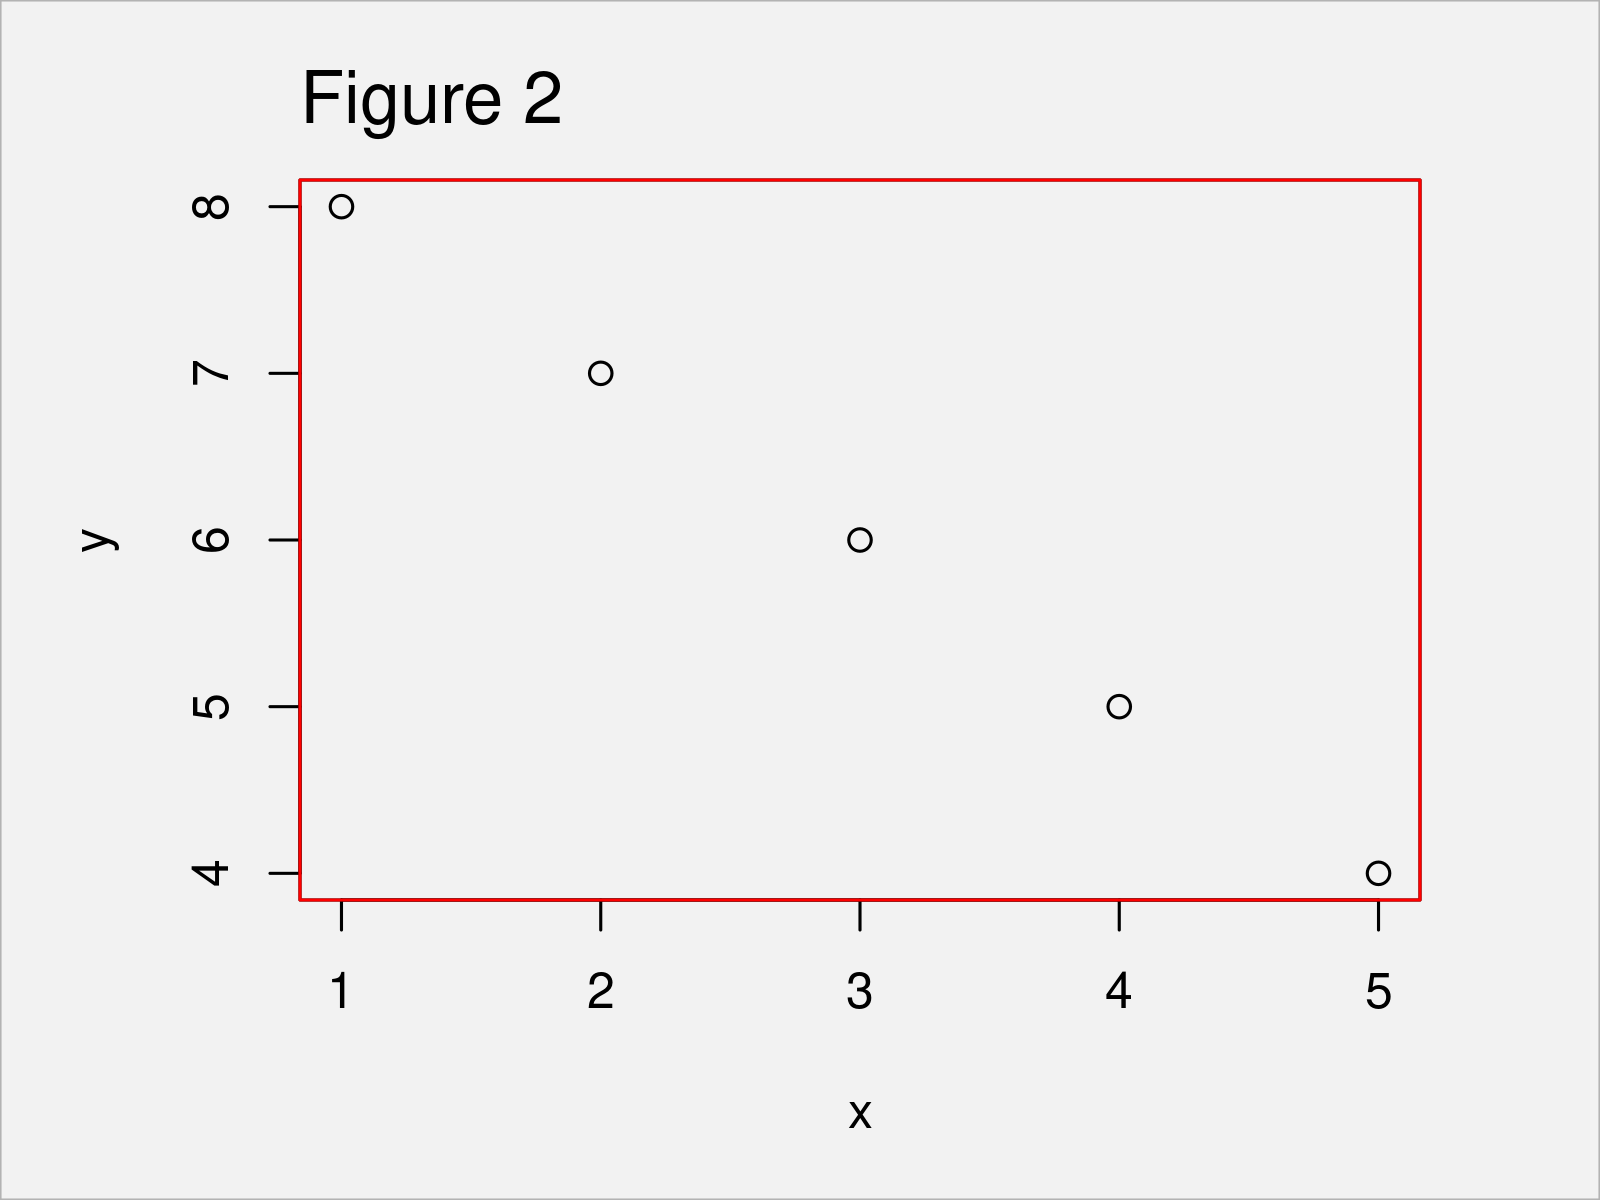
The following R syntax demonstrates how to add a colored box around the graphical panel of a plot.
For this task, we can apply the box function and the col argument as shown below:
plot(x, y)                           # Draw plot
box(col = "red")                     # Add box to plot

In Figure 2 you can see that we have added a red border around the panel of our graph.
Example 2: Change Thickness of Box Around Plot
The following code explains how to modify the thickness of the box around a Base R plot.
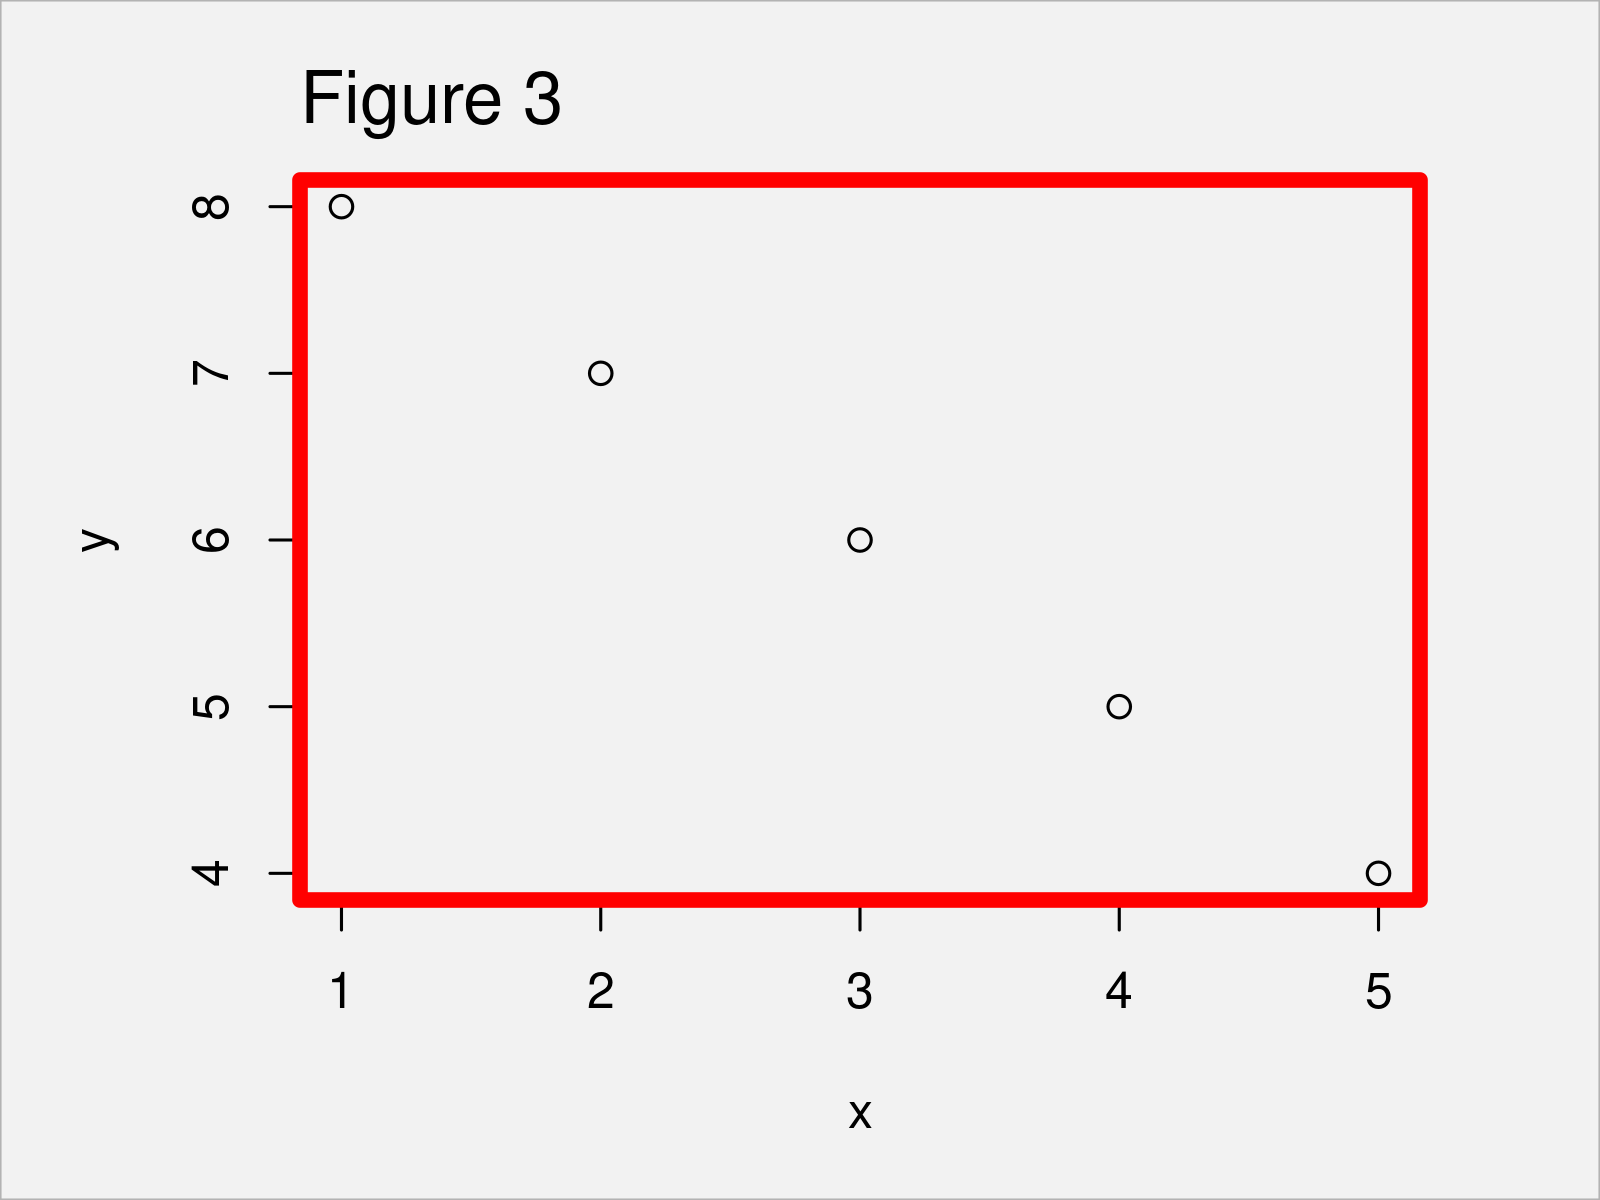
To do this, we have to increase or decrease the value specified to the lwd argument. The larger this value is, the thicker is the box around our plot:
plot(x, y)                           # Draw plot
box(col = "red",                     # Add box to plot
    lwd = 5)

After running the previous R syntax the box shown in Figure 3 has been created.
Example 3: Add Box Around Entire Figure
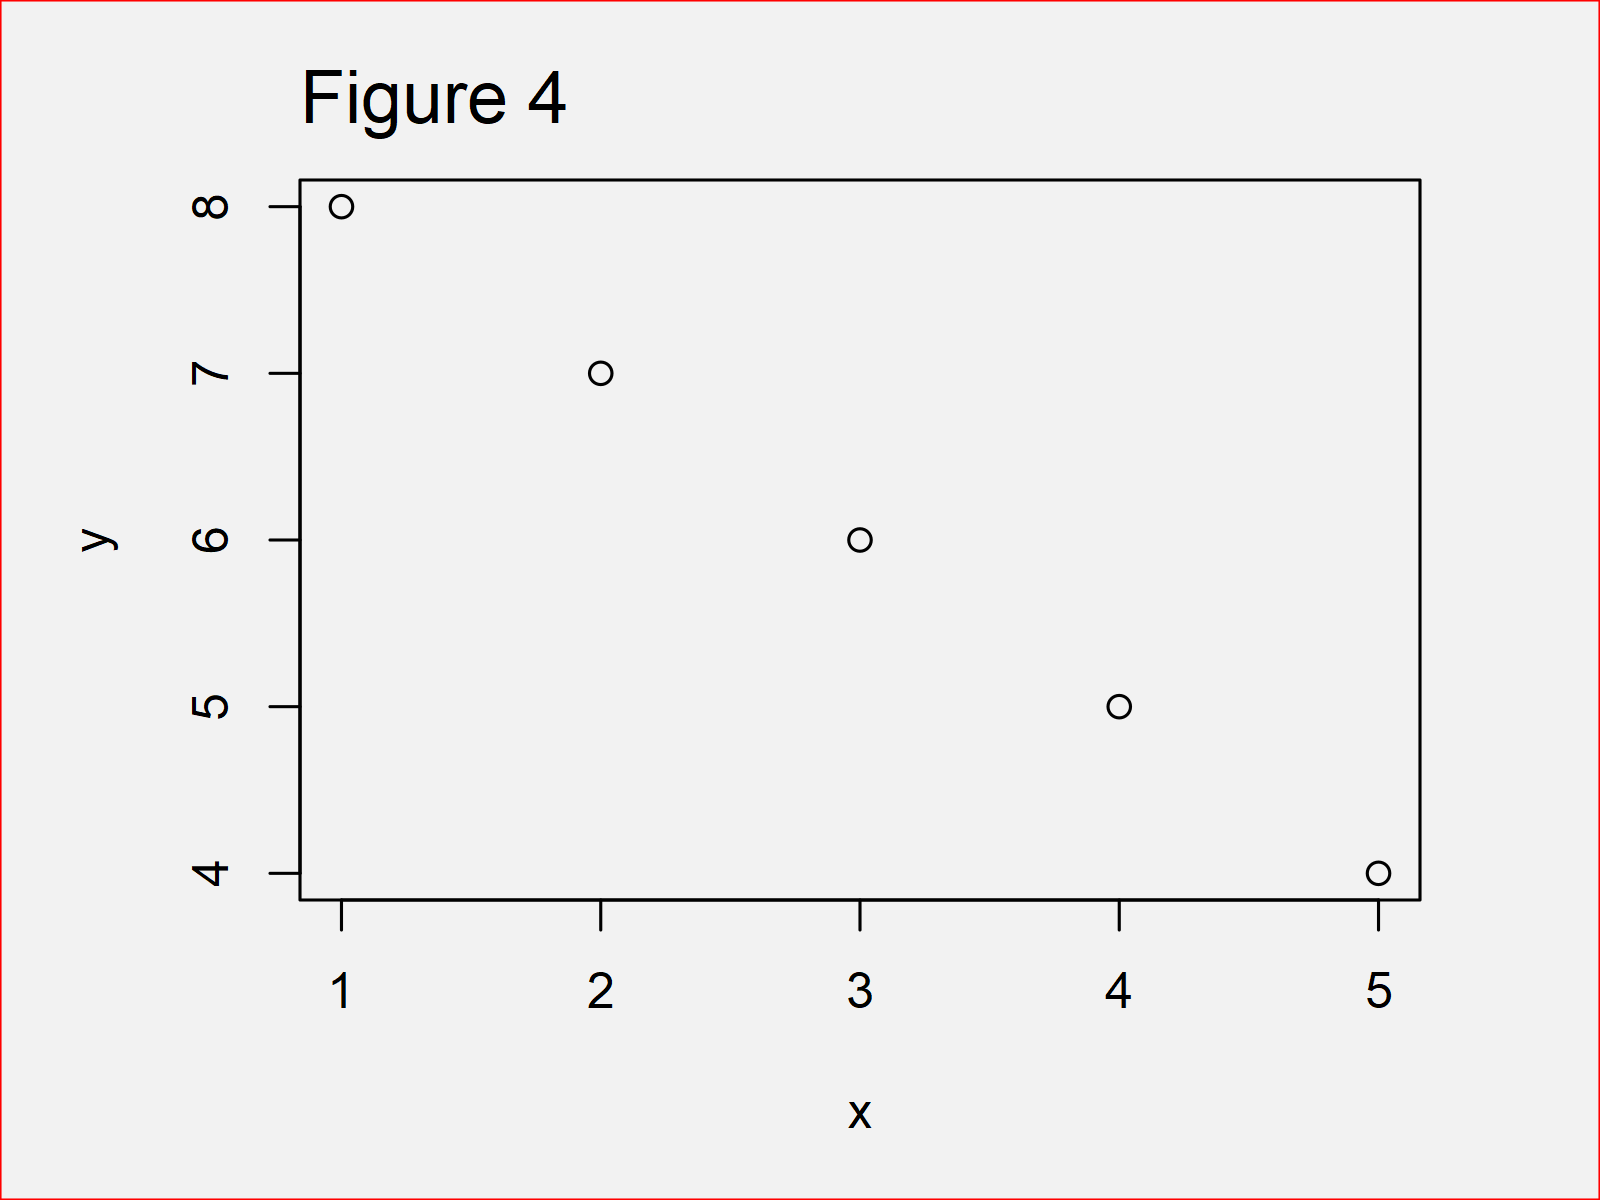
In this example, I’ll illustrate how to draw a border around an entire graphic.
To achieve this, we have to specify the which argument to be equal to “figure”:
plot(x, y)                           # Draw plot
box(col = "red",                     # Add box to plot
    which = "figure")

Figure 4 shows the output of the previous R programming syntax: A scatterplot with box around the entire graph.
Video, Further Resources & Summary
I have recently released a video tutorial on my YouTube channel, which illustrates the R syntax of this tutorial. Please find the video below.
Additionally, you could have a look at the related posts which I have published on this homepage:
- Add Panel Border to ggplot2 Plot in R
- Add Legend without Border & White Background to Plot
- Change Fill and Border Color of ggplot2 Plot
- Remove Grid, Background Color, Top & Right Borders from ggplot2 Plot
- Important Functions in R (Programming Examples)
- All R Programming Tutorials
To summarize: You have learned in this article how to add a border around a plot using the box function in the R programming language. Let me know in the comments, if you have additional questions.


