Aggregate Daily Data to Month & Year Intervals in R (2 Examples)
In this R tutorial you’ll learn how to summarize and group daily data into monthly intervals.
The tutorial will contain two examples for the aggregation of daily data. More precisely, the article will consist of this content:
Let’s just jump right in…
Introducing Example Data
Consider the following example data:
set.seed(8965379)                                   # Create random example data
data <- data.frame(date = sample(seq(as.Date("2020/01/01"),
                                     by = "day",
                                     length.out = 1000),
                                 100, replace = TRUE),
                   value = round(rnorm(100, 5, 2), 2))
head(data)                                          # Print head of example data
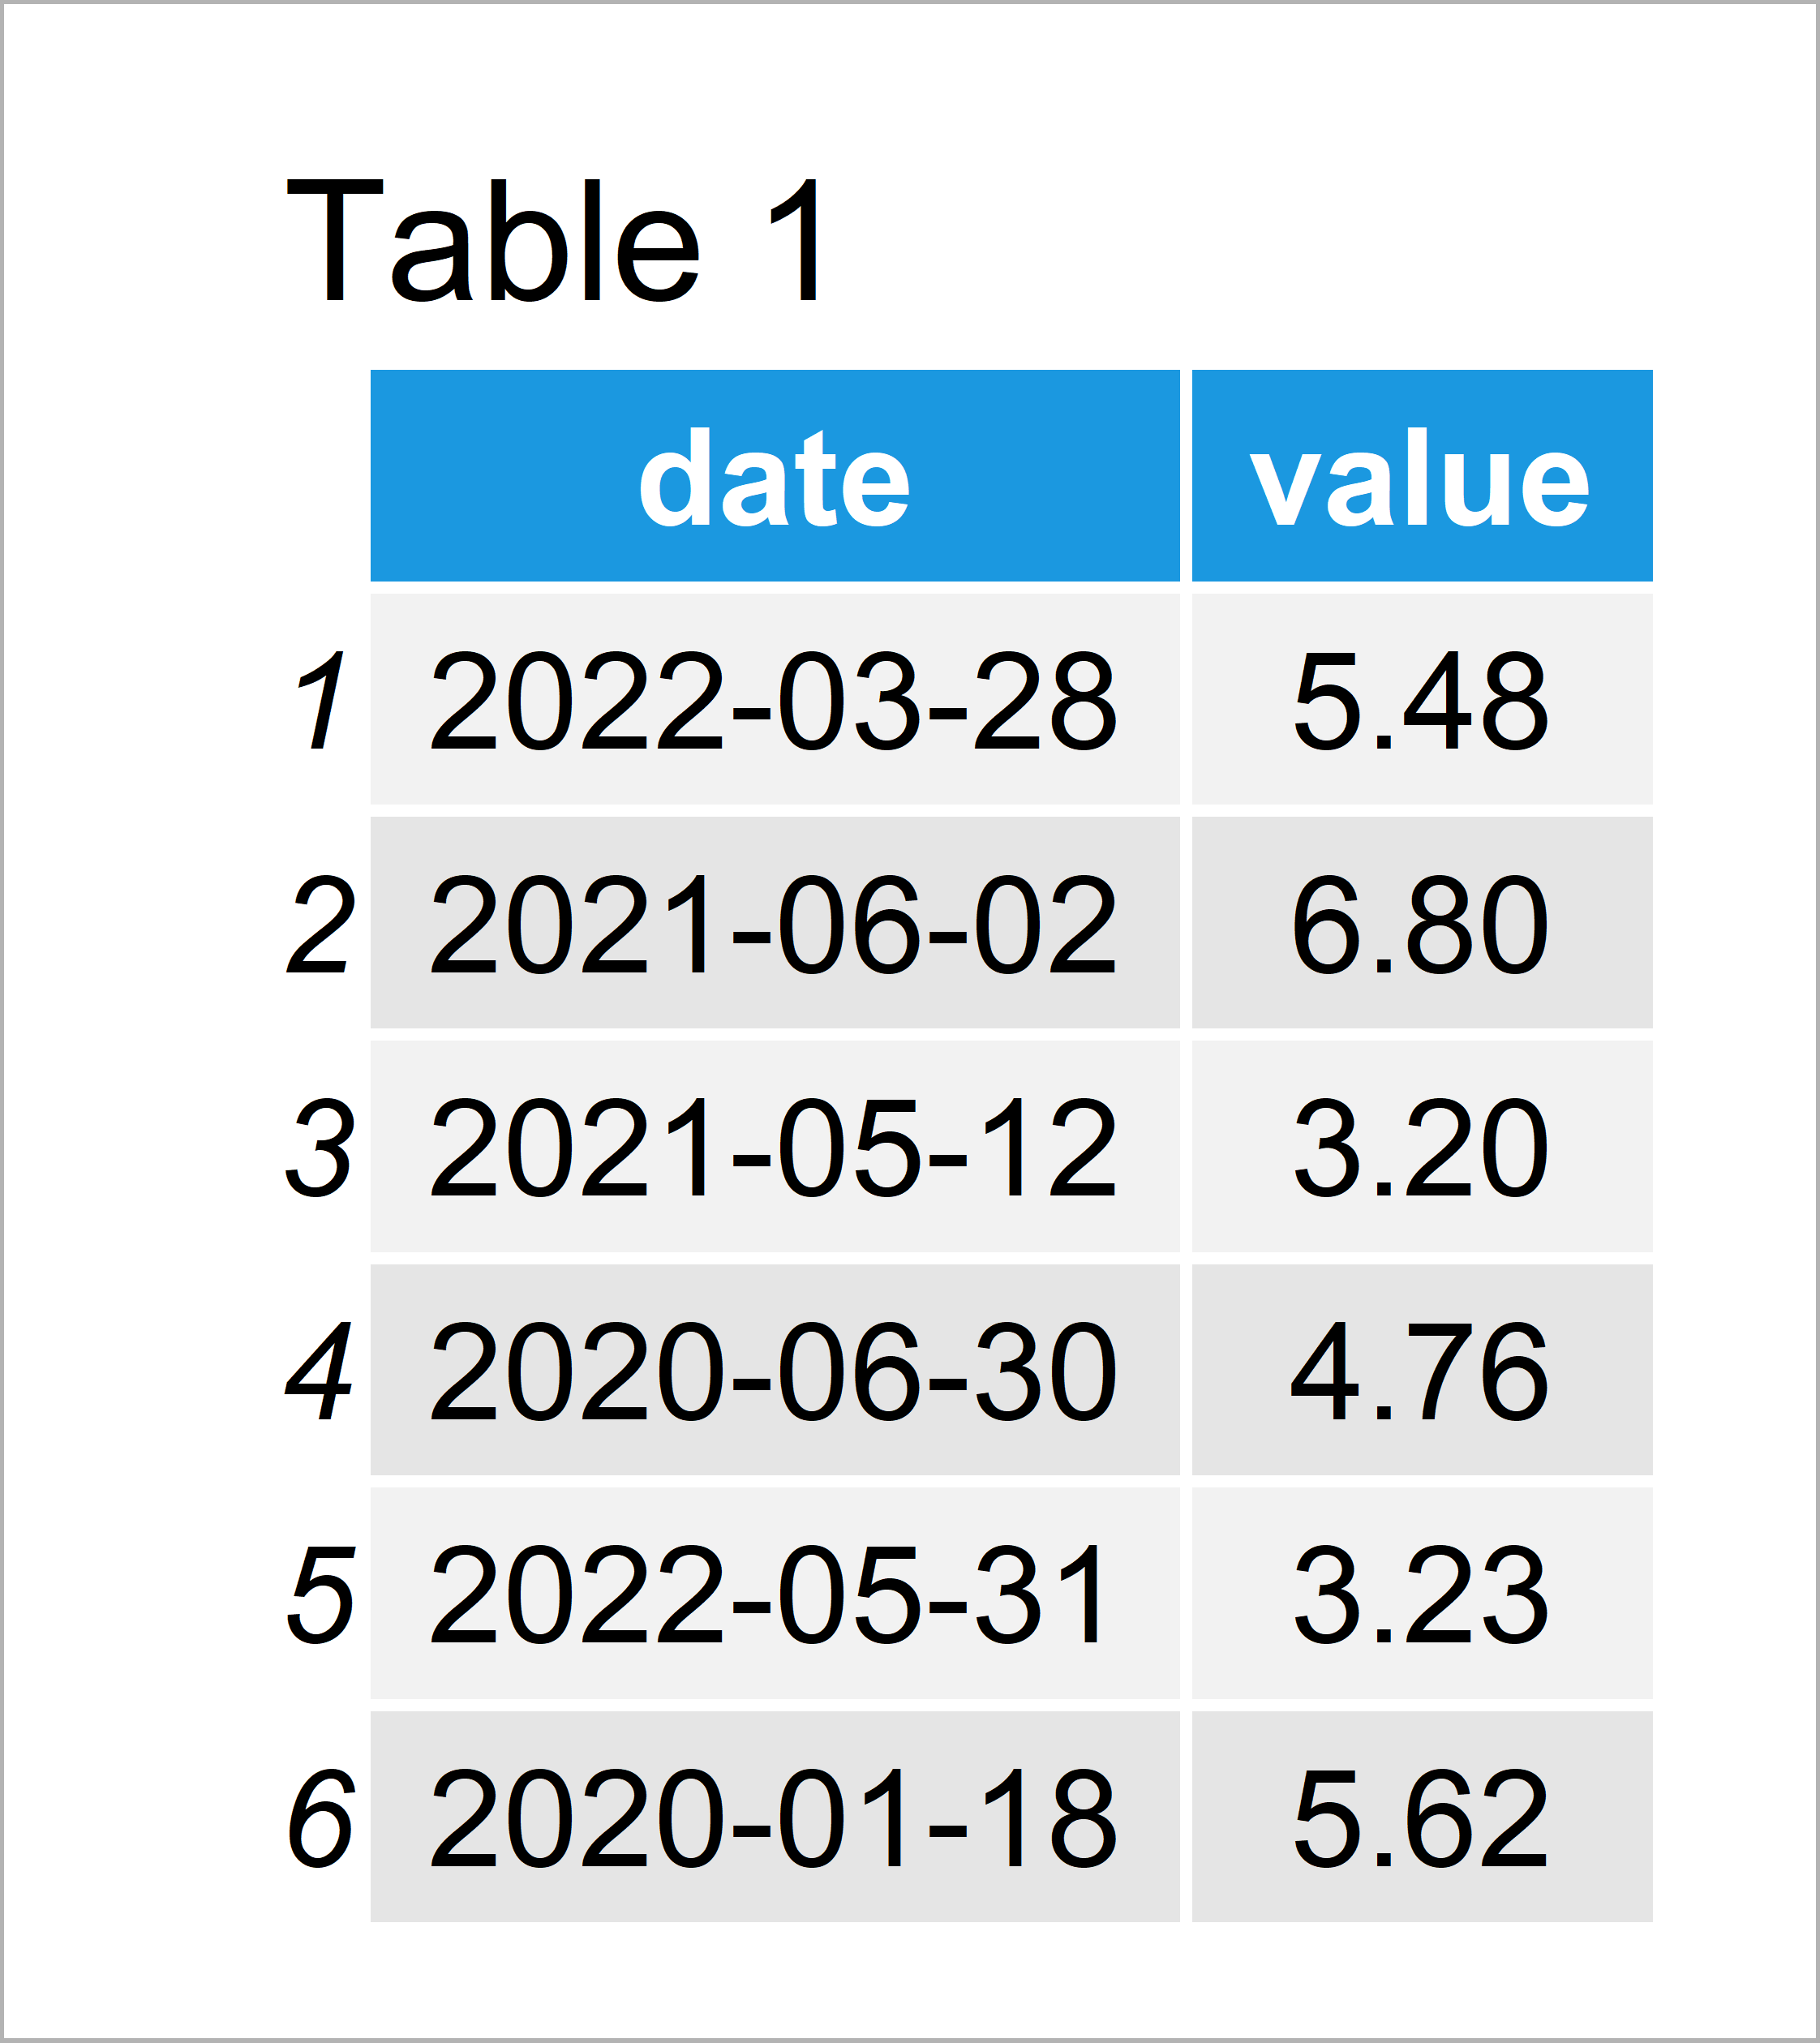
Table 1 shows the structure of our example data: It is composed of 100 data points and two columns. The first variable contains a random sequence of dates and the second variable contains corresponding values.
Example 1: Aggregate Daily Data to Month/Year Intervals Using Base R
The following R syntax explains how to use the basic installation of the R programming language to combine our daily data to monthly data.
First, we have to add a year and a month column to our data frame:
data_new1 <- data                                   # Duplicate data
data_new1$year <- strftime(data_new1$date, "%Y")    # Create year column
data_new1$month <- strftime(data_new1$date, "%m")   # Create month column
head(data_new1)                                     # Head of updated data
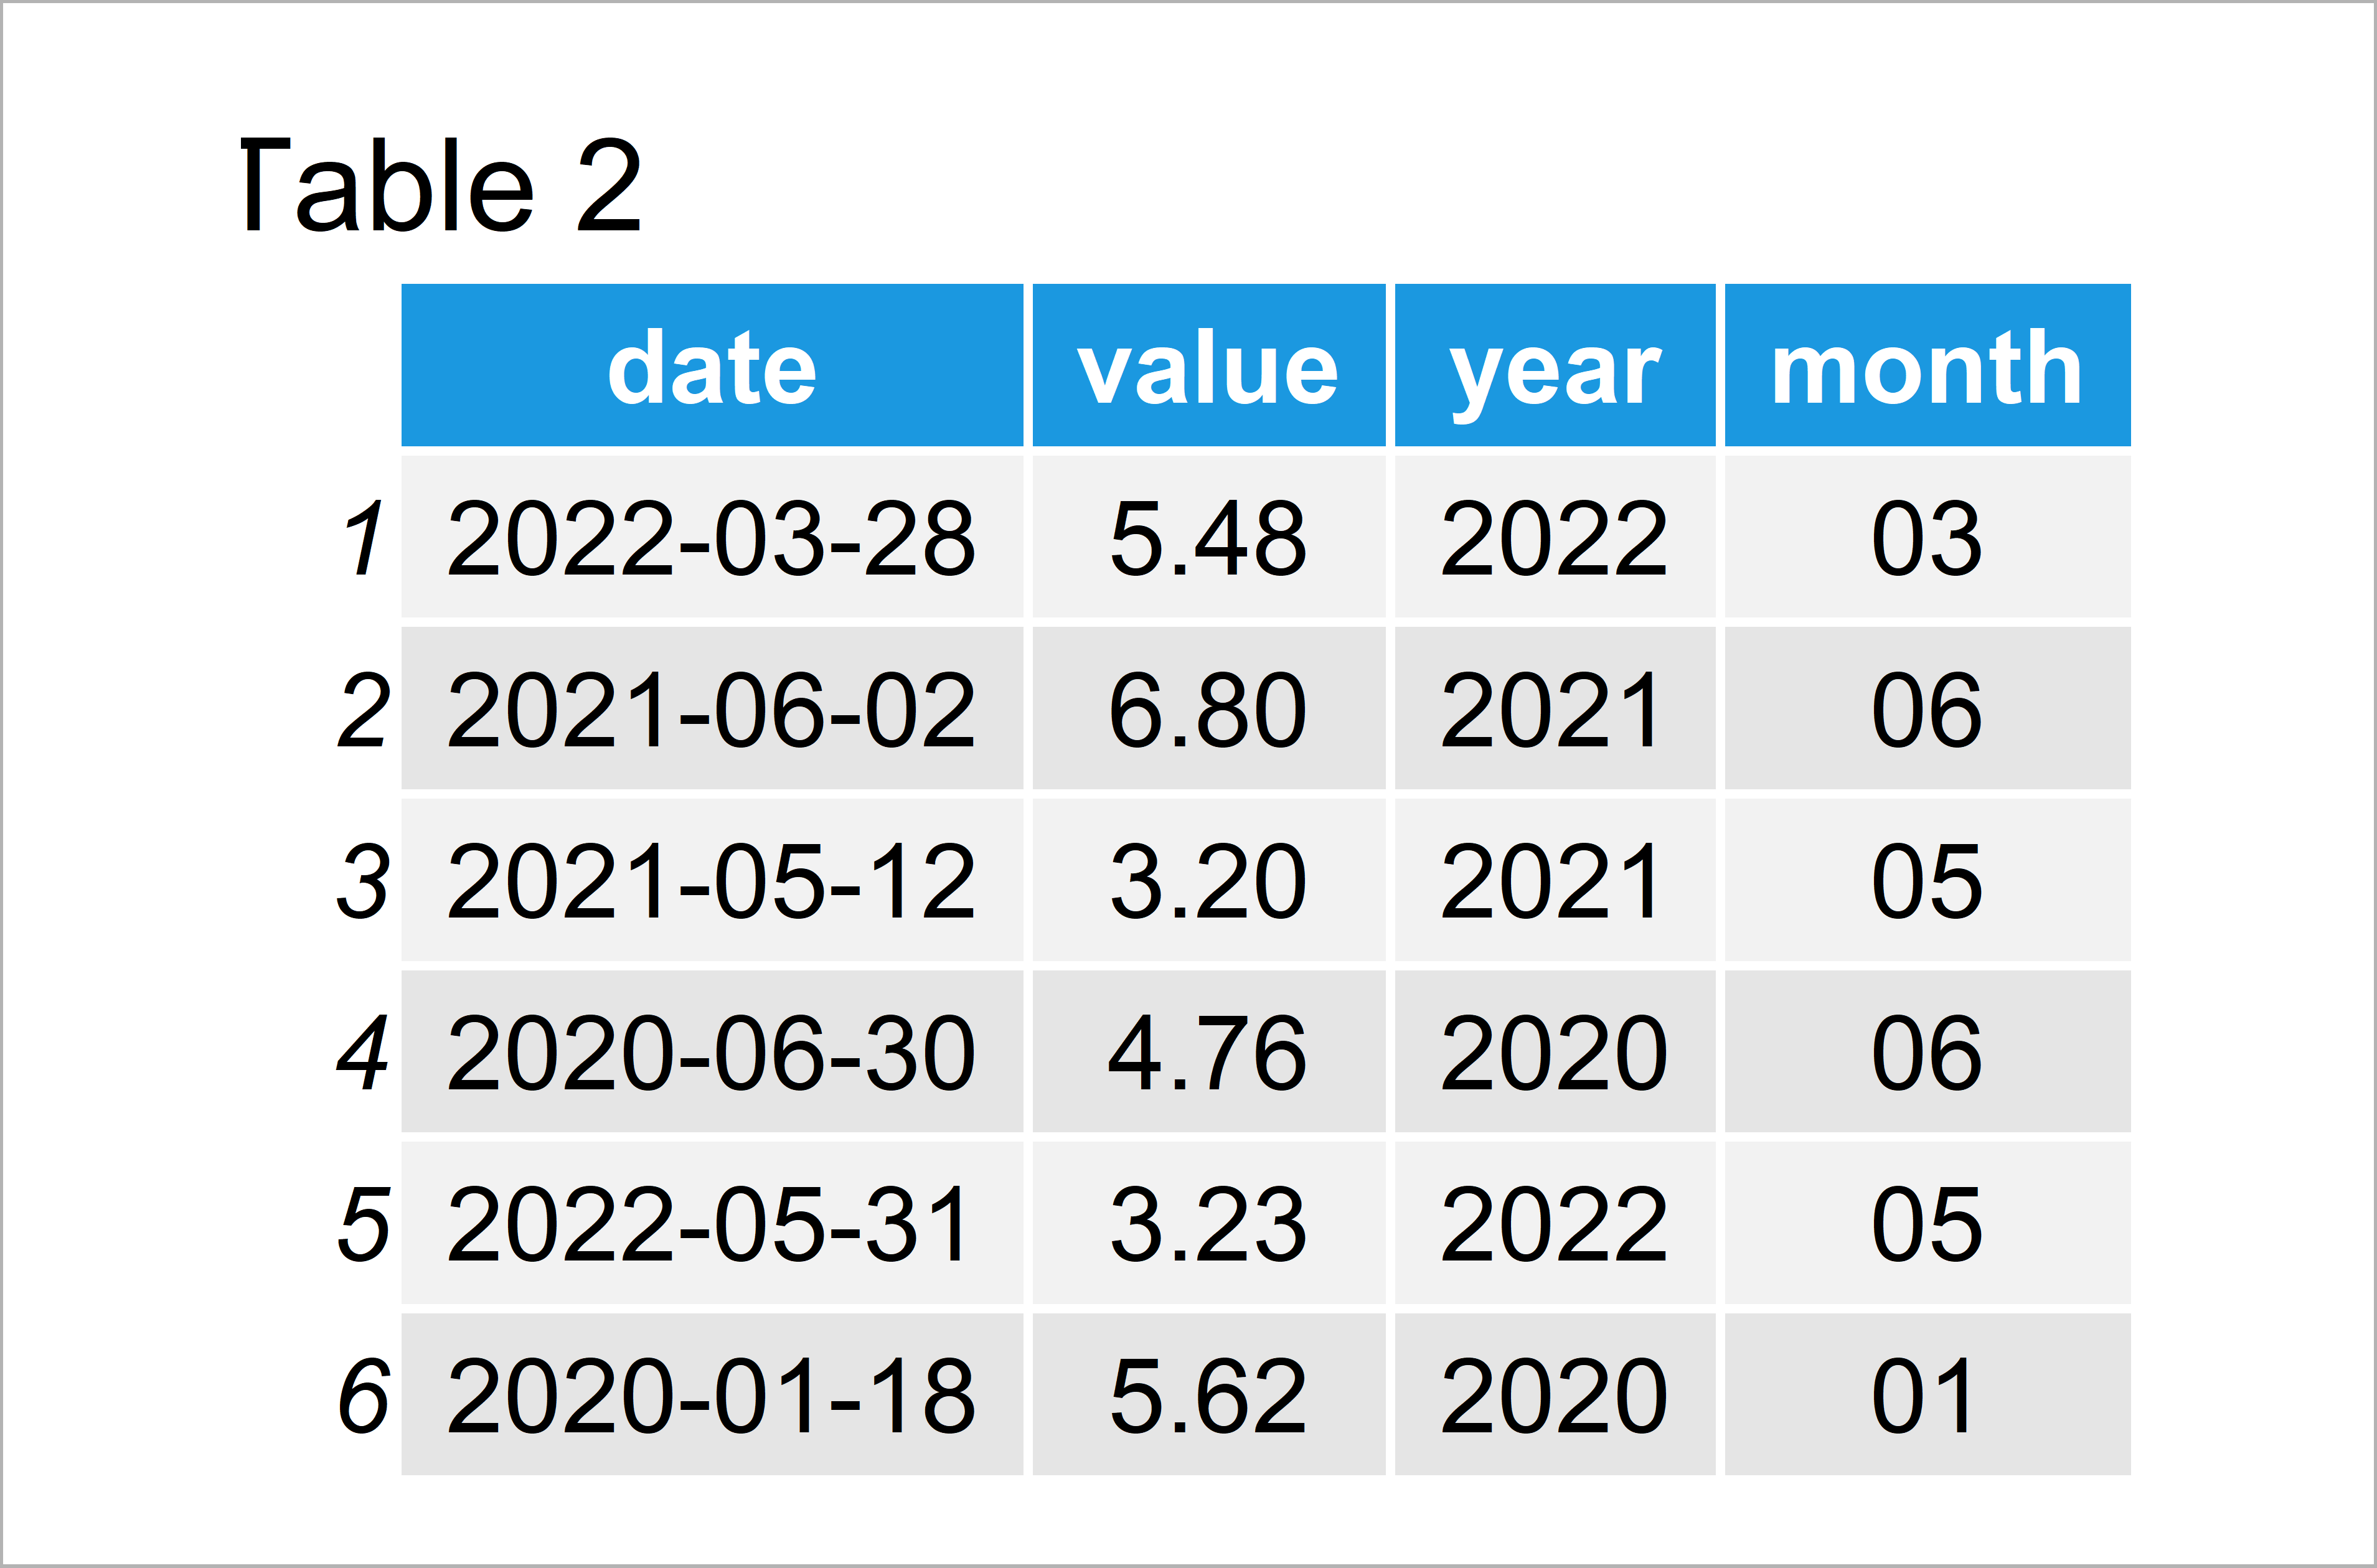
Table 2 shows the output of the previous R programming syntax: We have created a new data frame containing separate year and month columns.
In the next step, we can apply the aggregate function to convert our daily data to monthly data:
data_aggr1 <- aggregate(value ~ month + year,       # Aggregate data
                        data_new1,
                        FUN = sum)
head(data_aggr1)                                    # Head of aggregated data
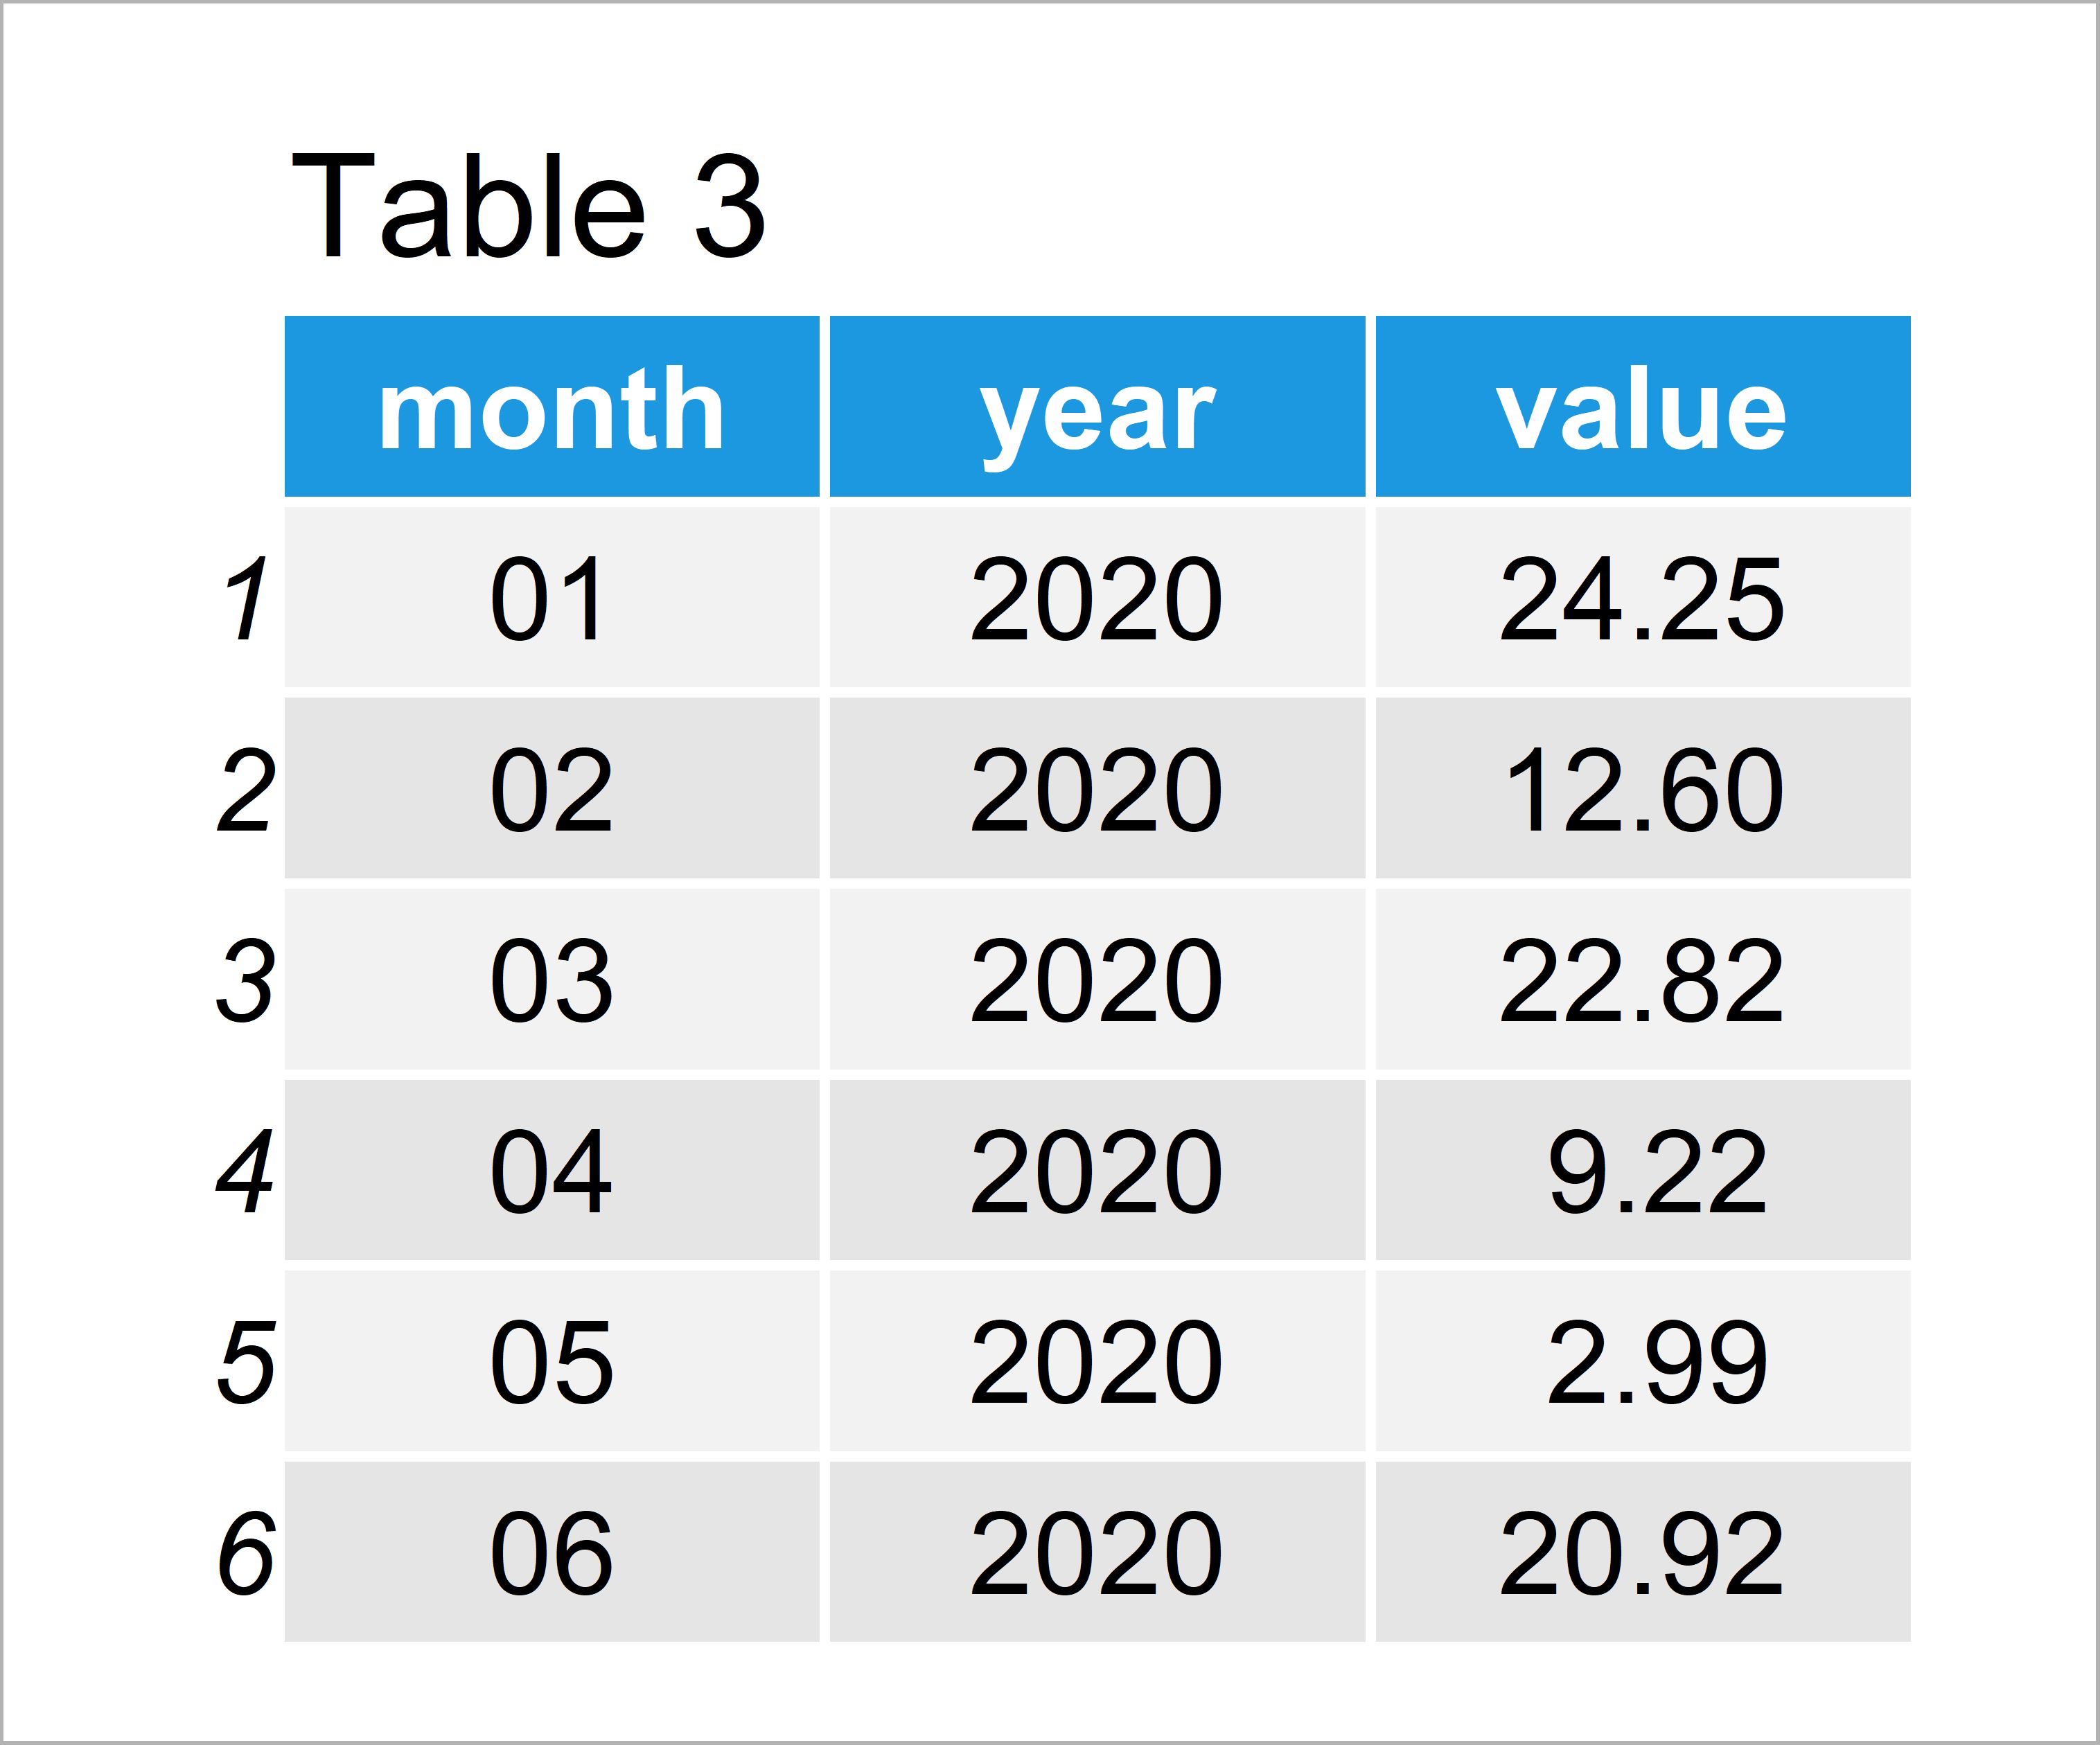
Table 3 illustrates the output of the previous R syntax: An aggregated version of our data frame.
In this case, we have used the sum function to get the sum of all values within each month. However, you may also use other functions such as mean or median to summarize our data.
Example 2: Aggregate Daily Data to Month/Year Intervals Using lubridate & dplyr Packages
Example 2 illustrates how to use the functions of the tidyverse environment to switch from daily to monthly/yearly data.
First, we need to install and load the lubridate package:
install.packages("lubridate")                       # Install & load lubridate
library("lubridate")
Now, we can use the floor_date function to add a year/month column to our data frame:
data_new2 <- data                                   # Duplicate data
data_new2$year_month <- floor_date(data_new2$date,  # Create year-month column
                                   "month")
head(data_new2)                                     # Head of updated data
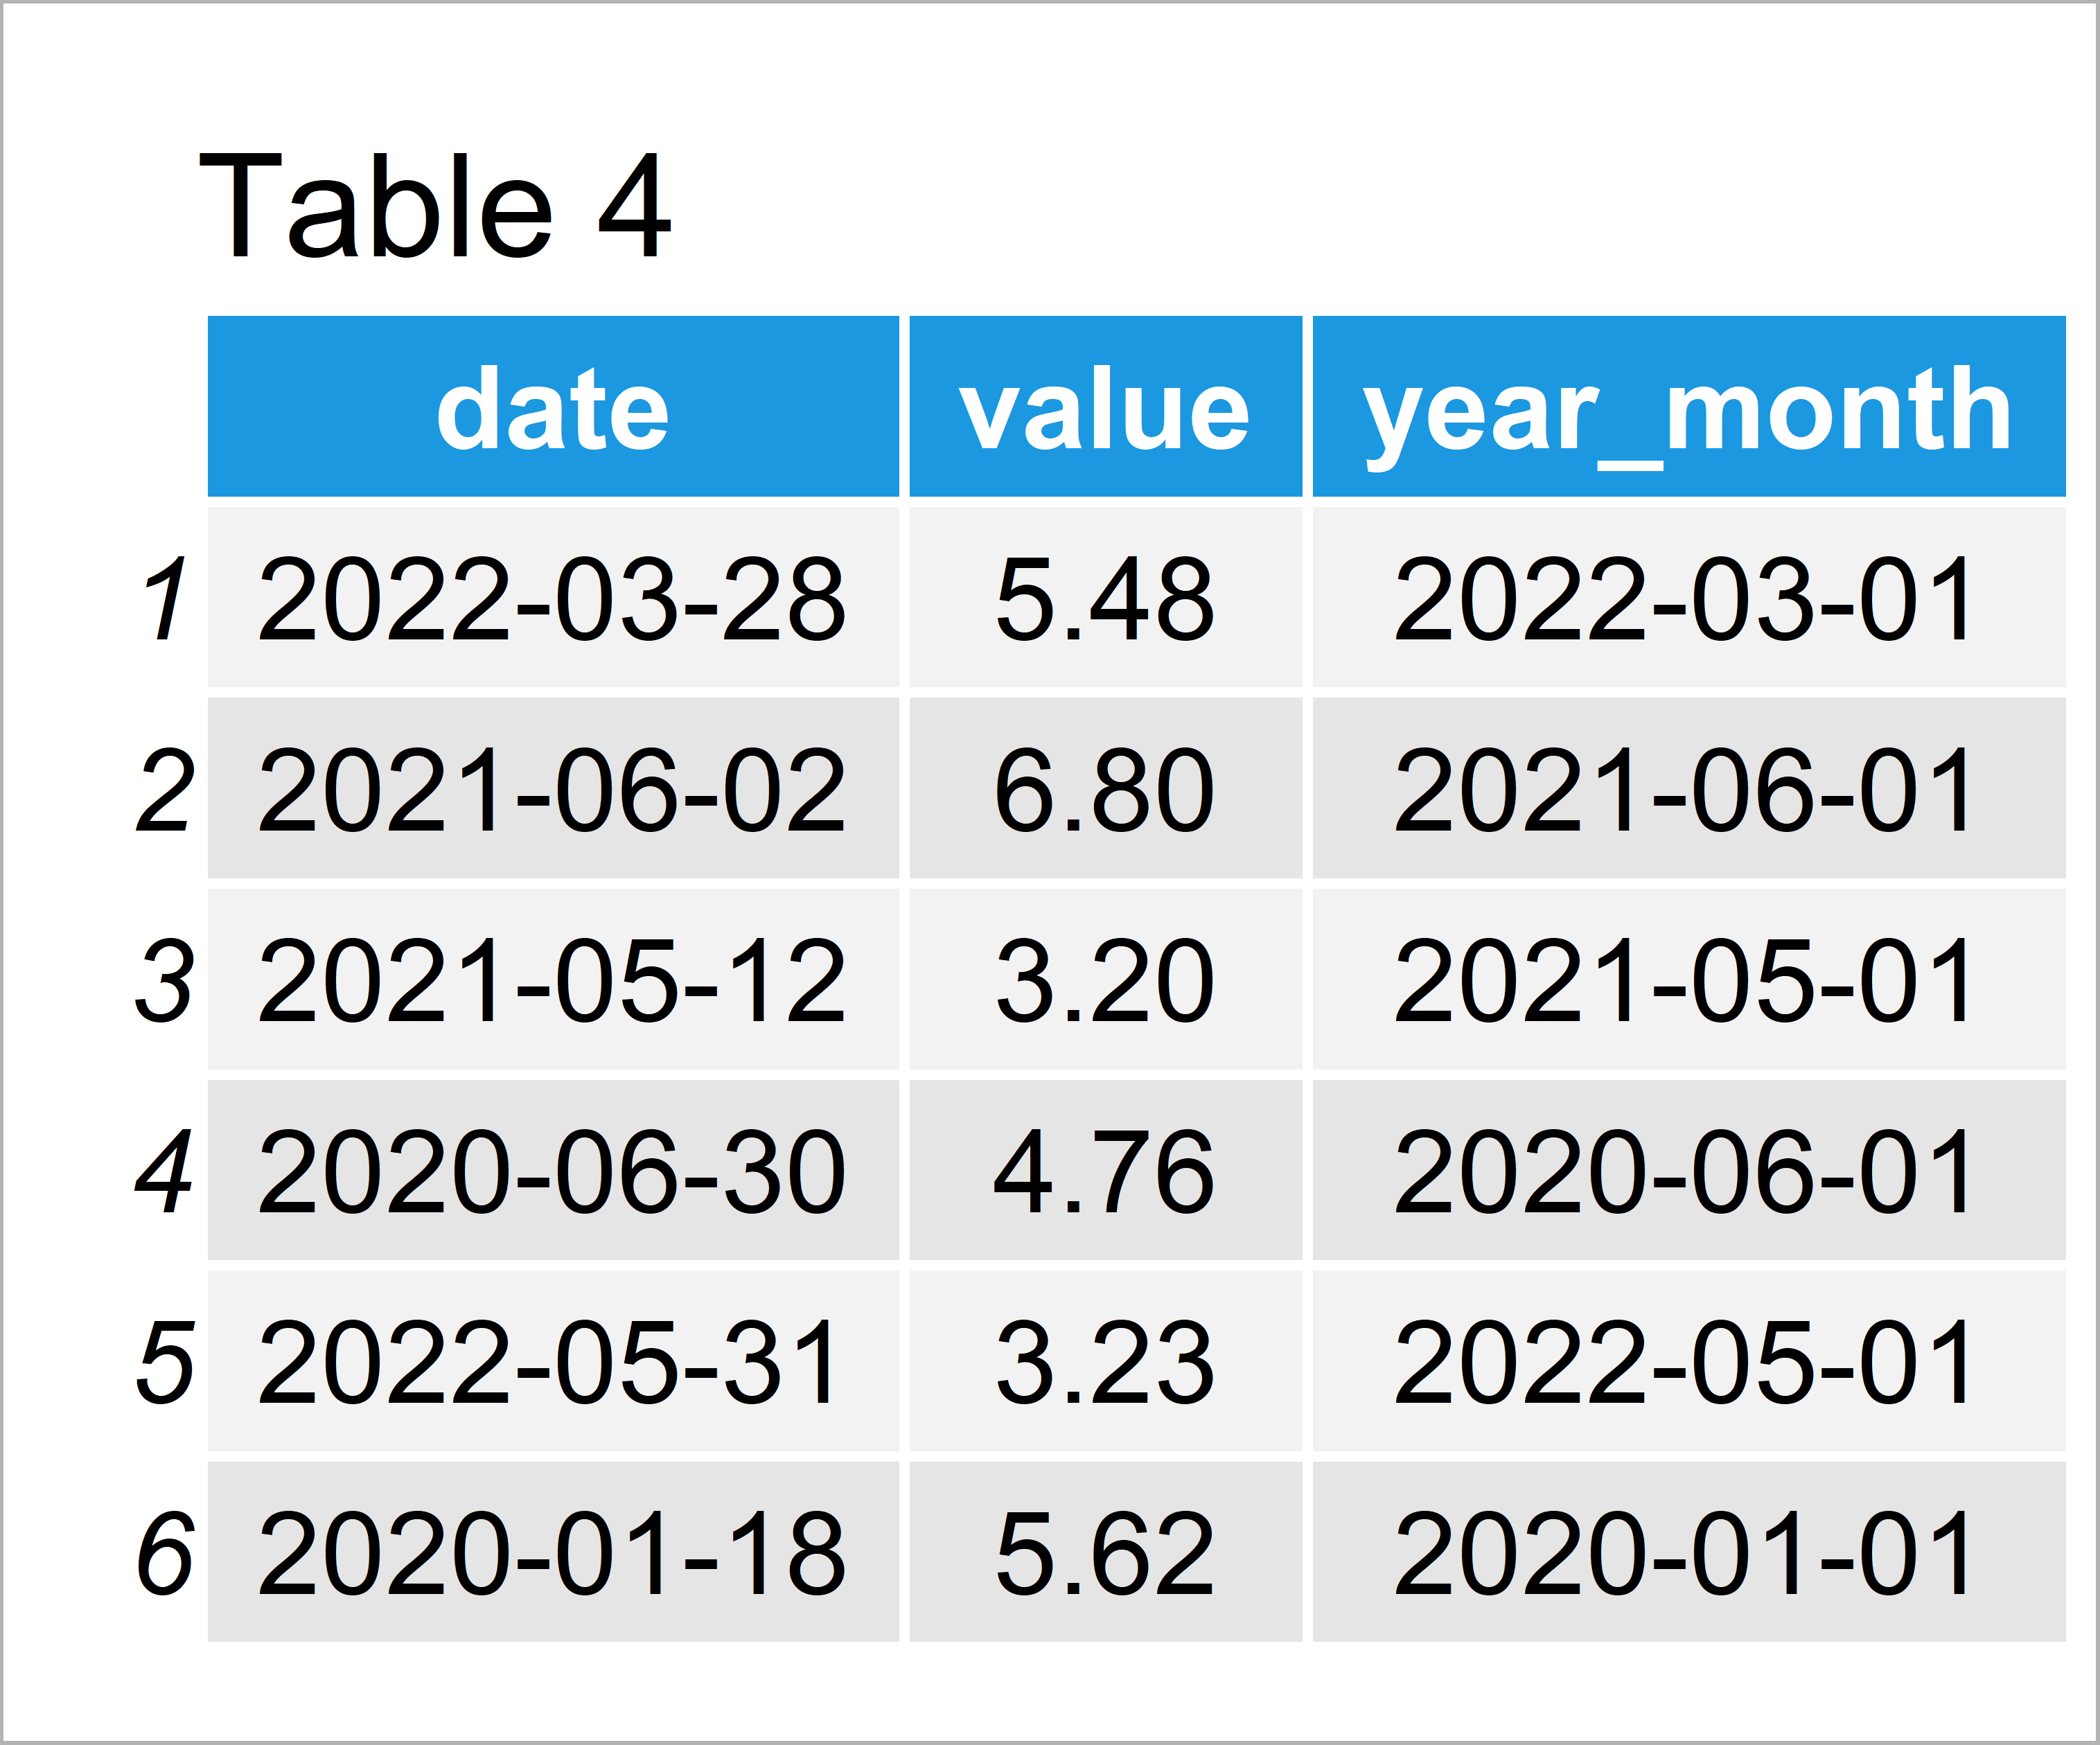
As revealed in Table 4, the previous R code has managed to construct a new data frame containing a year/month variable. Note that our year/month variable still contains days, but all days were set to 01.
Next, we have to install and load the dplyr package to R:
install.packages("dplyr")                           # Install dplyr package
library("dplyr")                                    # Load dplyr
Now, we can use the group_by and summarize functions of the dplyr package to aggregate our data.
data_aggr2 <- data_new2 %>%                         # Aggregate data
  group_by(year_month) %>%
  dplyr::summarize(value = sum(value)) %>%
  as.data.frame()
head(data_aggr2)                                    # Head of aggregated data
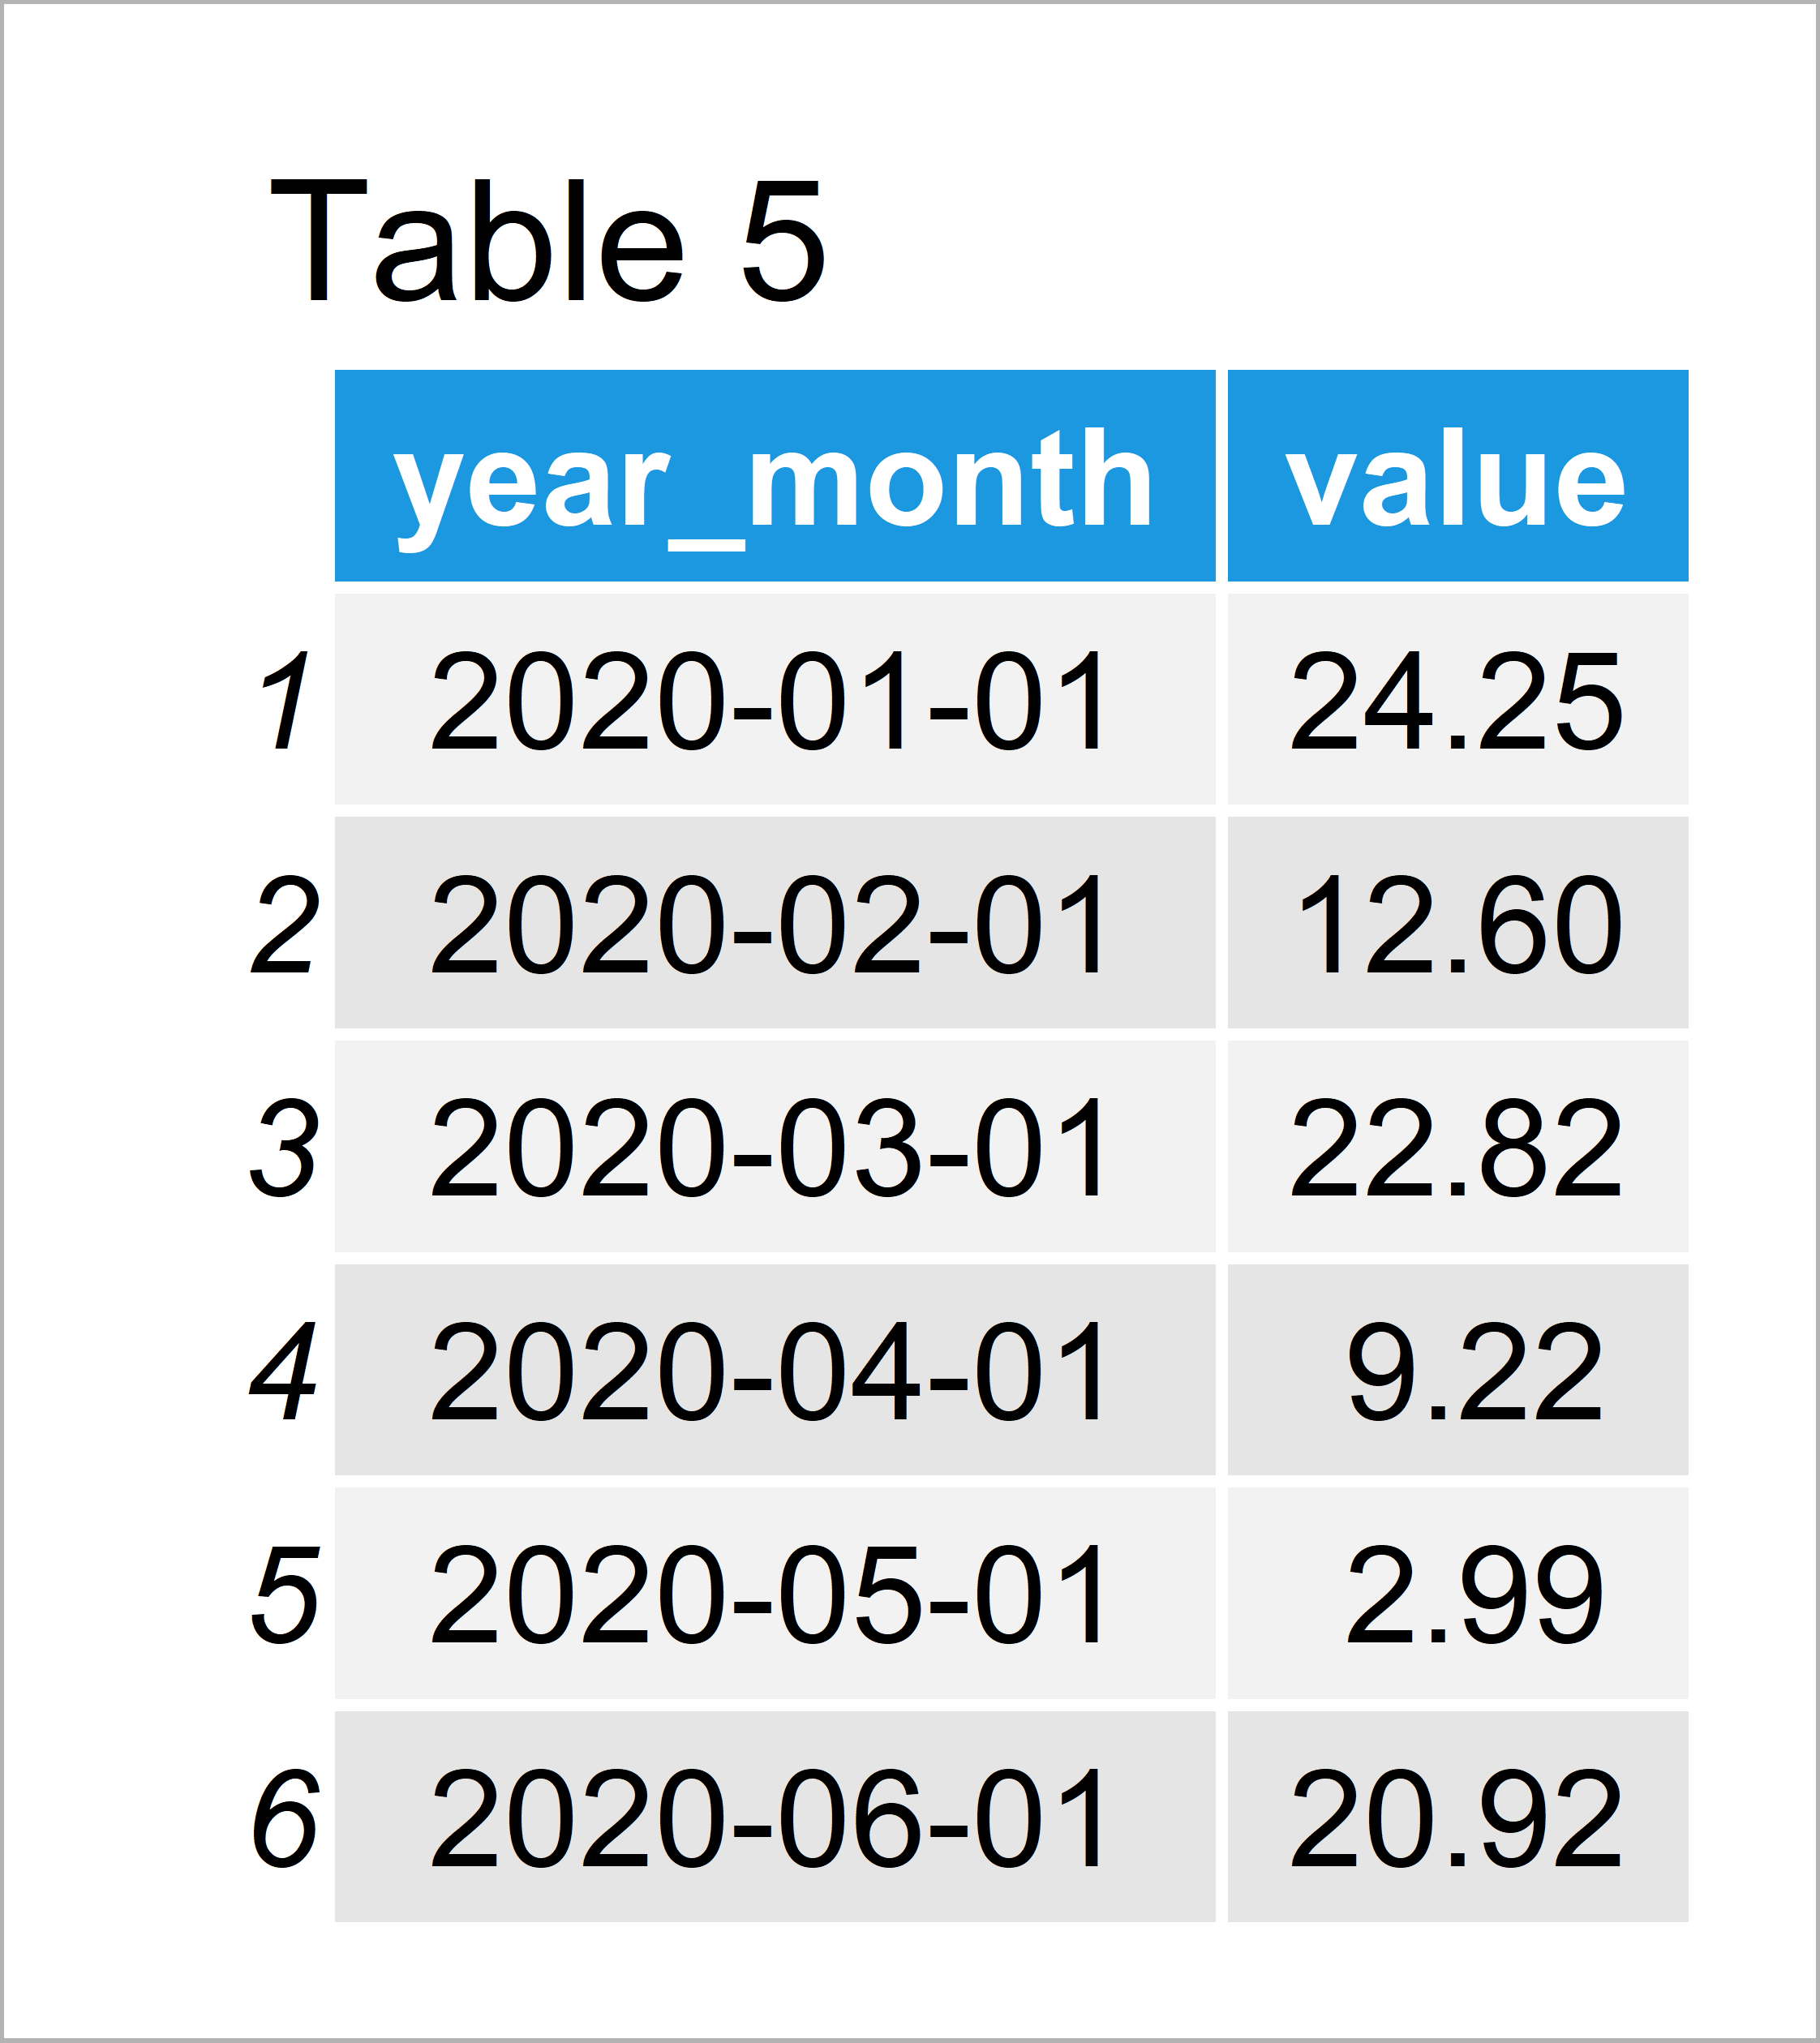
In Table 5 it is shown that we have created an aggregated data frame by running the previous R programming syntax.
The data shown in Table 5 is exactly the same as in Table 3. Whether you want to use the functions of Base R or the tidyverse environment is a matter of taste.
Video, Further Resources & Summary
Some time ago I have published a video on my YouTube channel, which shows the R syntax of this tutorial. Please find the video below:
In addition, you might have a look at some of the related articles of this website.
- aggregate Function in R
- Sum by Group in R
- Mean by Group in R
- R dplyr group_by & summarize Functions don’t Work Properly
- Find Earliest & Latest Date in R
- All R Programming Examples
You have learned in this tutorial how to aggregate time series data from daily to monthly/yearly in the R programming language. If you have additional questions, let me know in the comments below. Furthermore, please subscribe to my email newsletter in order to receive regular updates on new tutorials.


10 Comments. Leave new
Hi Joachim,
Thanks a lot for posting this, I found it very helpful. However, I was wondering if there is a way to aggregate seasonally for each year such as spring, summer, fall, and winter.
Thank you!
Anisha
Hey Anisha,
Thank you, glad you find the tutorial helpful!
Regarding your question: You may first convert your dates to seasons as explained here, and then you can use the seasons to aggregate your data.
Regards,
Joachim
Thank you so much Joachim. What you published allowed me to make my summarized data work (‘dplyr::summarize’). It seems like something minor, but I looked everywhere and this is where I found the solution to the error message I kept getting.
Hey Gonzalo,
Thank you very much for the kind words, glad it helped! 🙂
Regards,
Joachim
Thank you so much Joachim. You page is the first page I check when I have questions in R. Most of the time I can find my answer here which is great and I appreciate it. This time I couldn’t find what I can do to solve my problem. I have annual data for population which are age specific. It means that I have the population data for 21 age groups for each year. I want to aggregate the data to every five years and get the total population in each age group. In other words, I need the age specific data for each 5 years while I have the age specific data for each year. Here is the dataset I am using:
“Population by Age Groups BothSexes”
https://population.un.org/wpp/Download/Standard/Population/
Thank you!
Hey Ellie,
Thank you so much for the wonderful feedback! It’s really great to hear that you find my tutorials helpful! 🙂
Also, thanks a lot for the interesting question! Actually, I have noticed that I do not have a tutorial on this question yet. Your question has inspired me to create such a tutorial: https://statisticsglobe.com/group-data-frame-rows-range-r
I hope that helps!
Joachim
showing an error-:
“Error in data_new2$date : object of type ‘closure’ is not subsettable”
Hey Limin,
Could you please share your code? It’s difficult to tell why you got this error without seeing your syntax.
Regards,
Joachim
Hi Joachim,
I enjoy your posts, keep it up.
I know that there are many ways of achieving the same thing, here is how I typically do the same when analyzing my daily data.
library(tidyverse)
library(lubridate)
data$month <- month(data$date)
data$year <- year(data$date)
data_aggr2 %
group_by(year, month) %>%
summarise(value = sum(value)) %>%
ungroup()
This produces a data frame with three variables:
year
month
value
Hey Conrad!
Thank you for this feedback. I am sure it will be useful for the readers who are looking for some other alternatives.
Best,
Cansu