Group Data Frame Rows by Range in R (2 Examples)
In this article, I’ll demonstrate how to aggregate data by a certain range in the R programming language.
The article looks as follows:
So let’s jump right to the examples…
Example 1: Group Data Frame Rows by Range of Values
In this example, I’ll demonstrate how to group and summarize the rows of a data frame based on particular group ranges.
For this example, we first have to create an exemplifying data frame:
data_values <- data.frame(group = 2011:2024,                # Create example data frame
                          value = 51:64)
data_values                                                 # Print example data frame

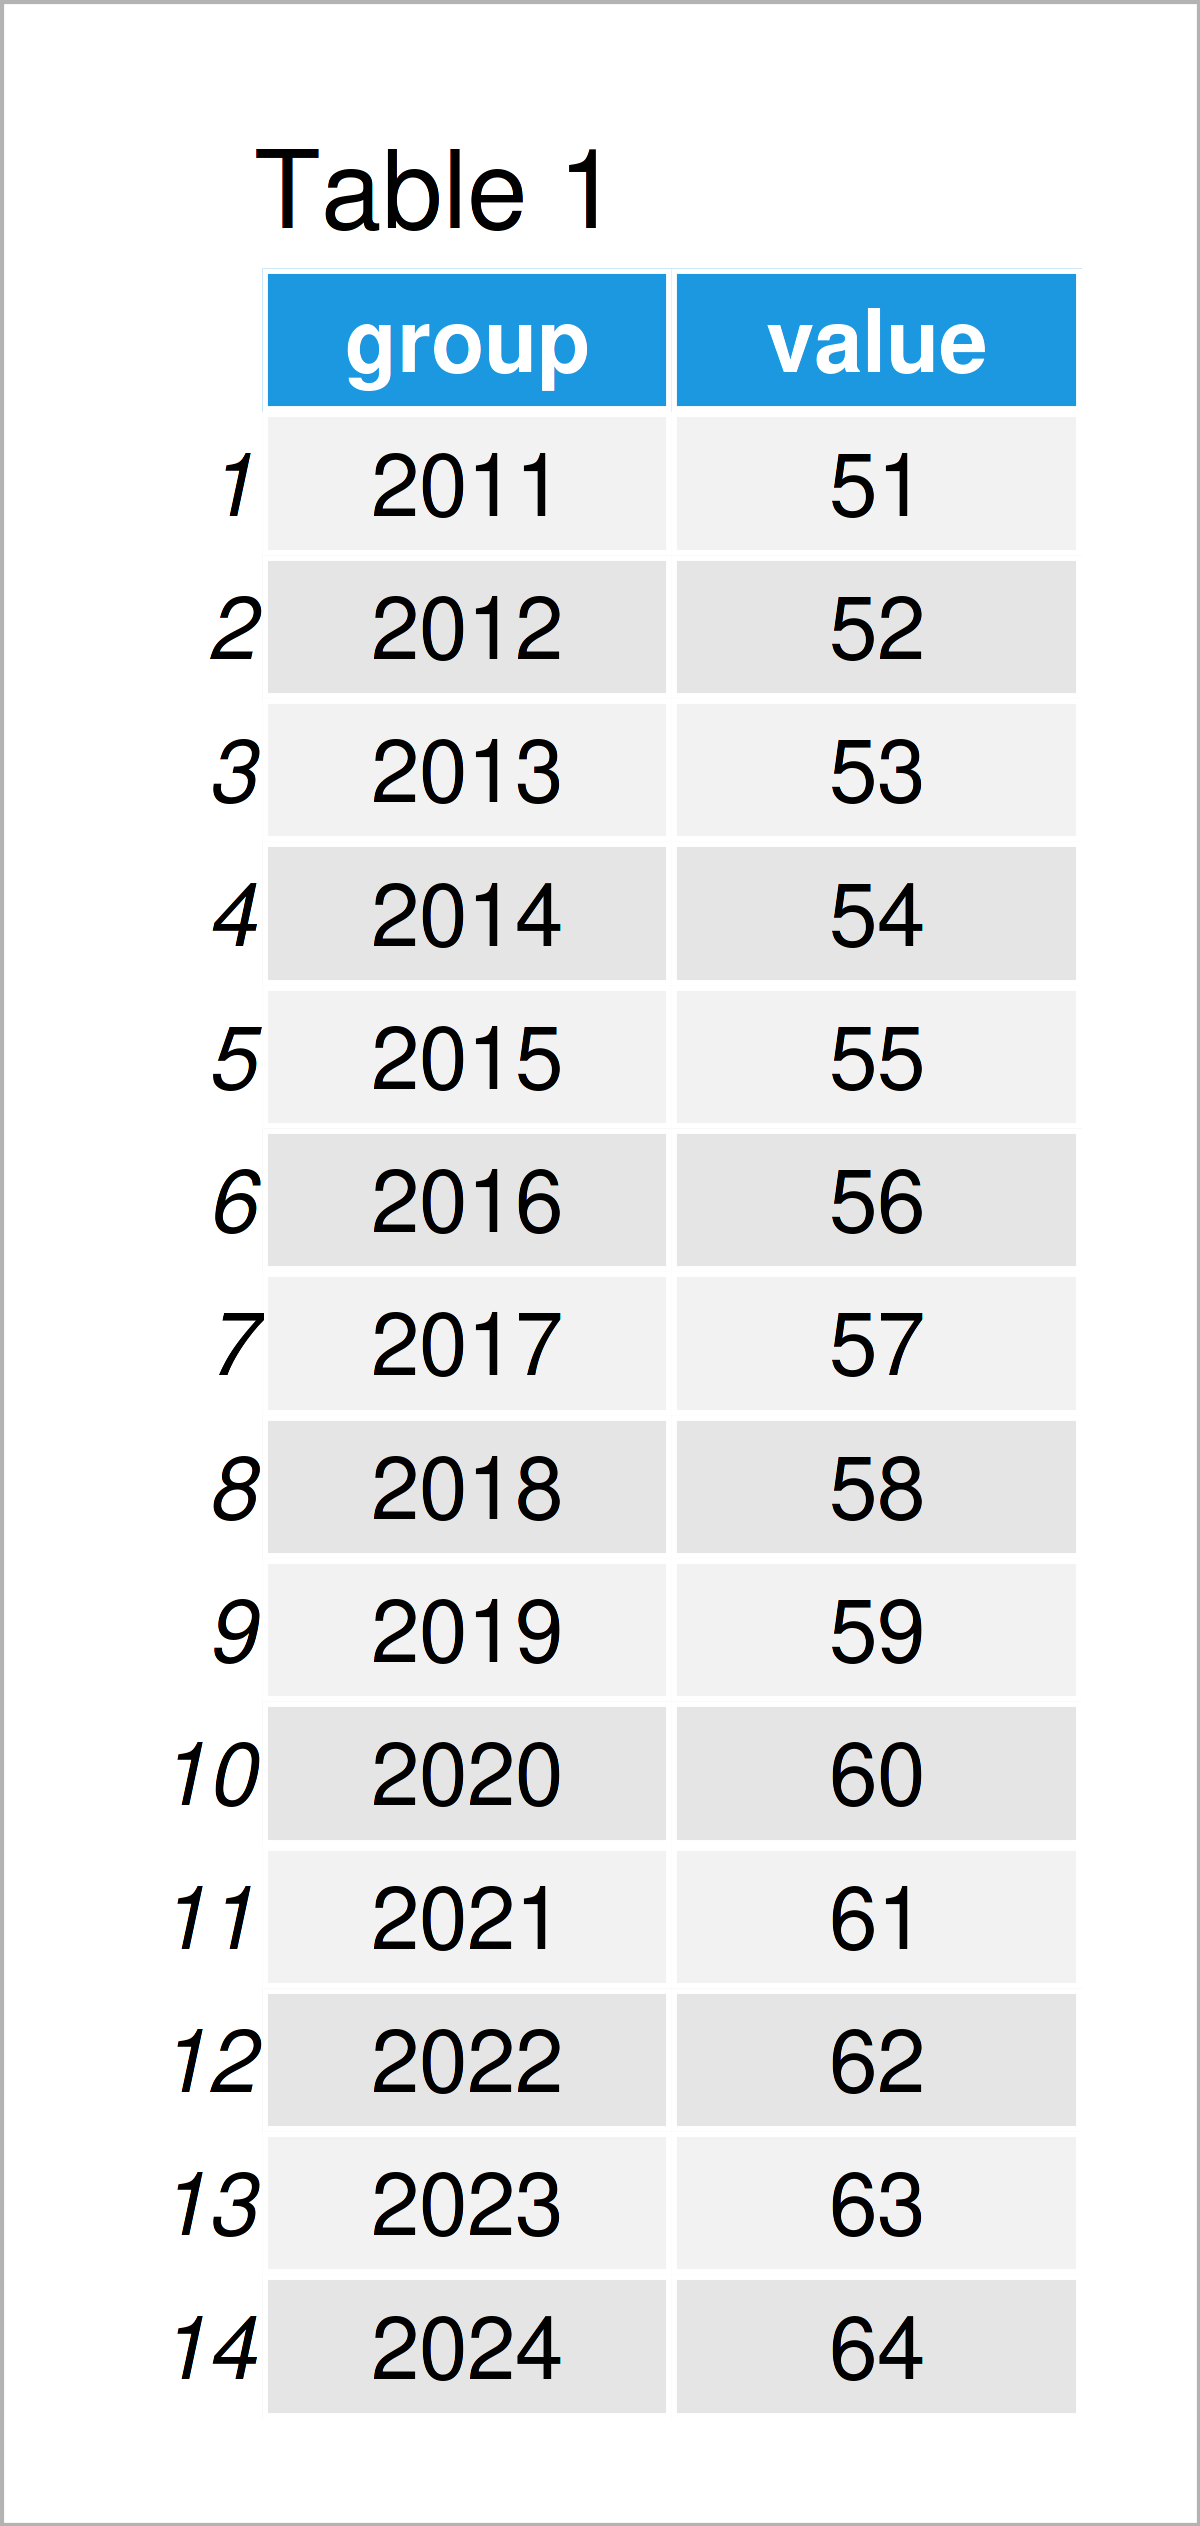
As shown in Table 1, we have created a data frame containing a group and a value column by executing the previous R code. The numbers in the group column could be specific years, or it could be any other numeric values.
Next, we have to install and load the dplyr package:
install.packages("dplyr")                                   # Install & load dplyr package
library("dplyr")
Now, we can use the mutate, cut, seq, group_by, summarize, and sum functions to create an aggregated version of our data frame. Within the cut and seq functions we specify the cut-off points of the ranges.
data_values_range <- data_values %>%                        # Aggregate values in range
  mutate(ranges = cut(group,
                      seq(2010, 2025, 5))) %>%
  group_by(ranges) %>%
  dplyr::summarize(sums = sum(value)) %>%
  as.data.frame()
data_values_range                                           # Print aggregated values in range

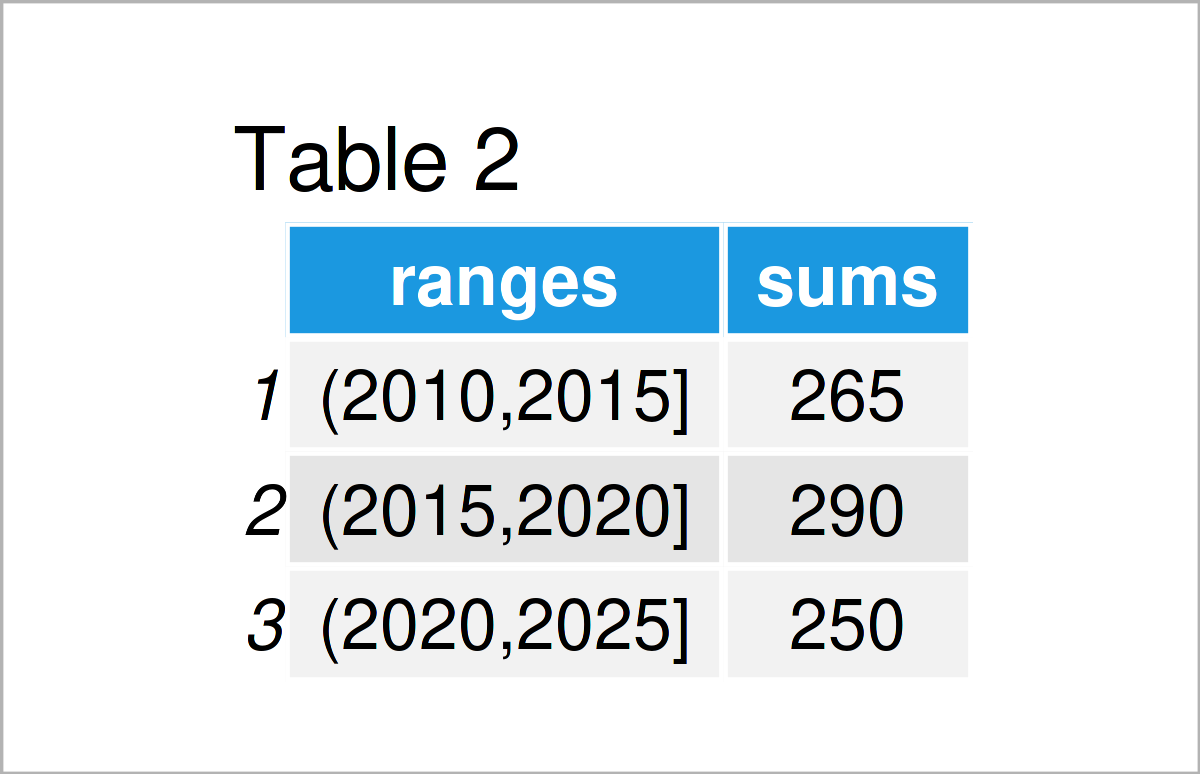
As shown in Table 2, the previous R programming code has created a new data frame that contains the sum by each group range.
Example 2: Group Data Frame Rows by Range of Dates
In the first example, I have explained how to group by certain numeric intervals.
This example shows how to group by ranges of dates.
For this, we first have to create another example data set:
data_dates <- data.frame(date = seq(as.Date("2023-10-03"),  # Create example data frame
                                    as.Date("2023-10-20"),
                                    "day"),
                         value = 10:27)
head(data_dates)                                            # Print head of example data frame

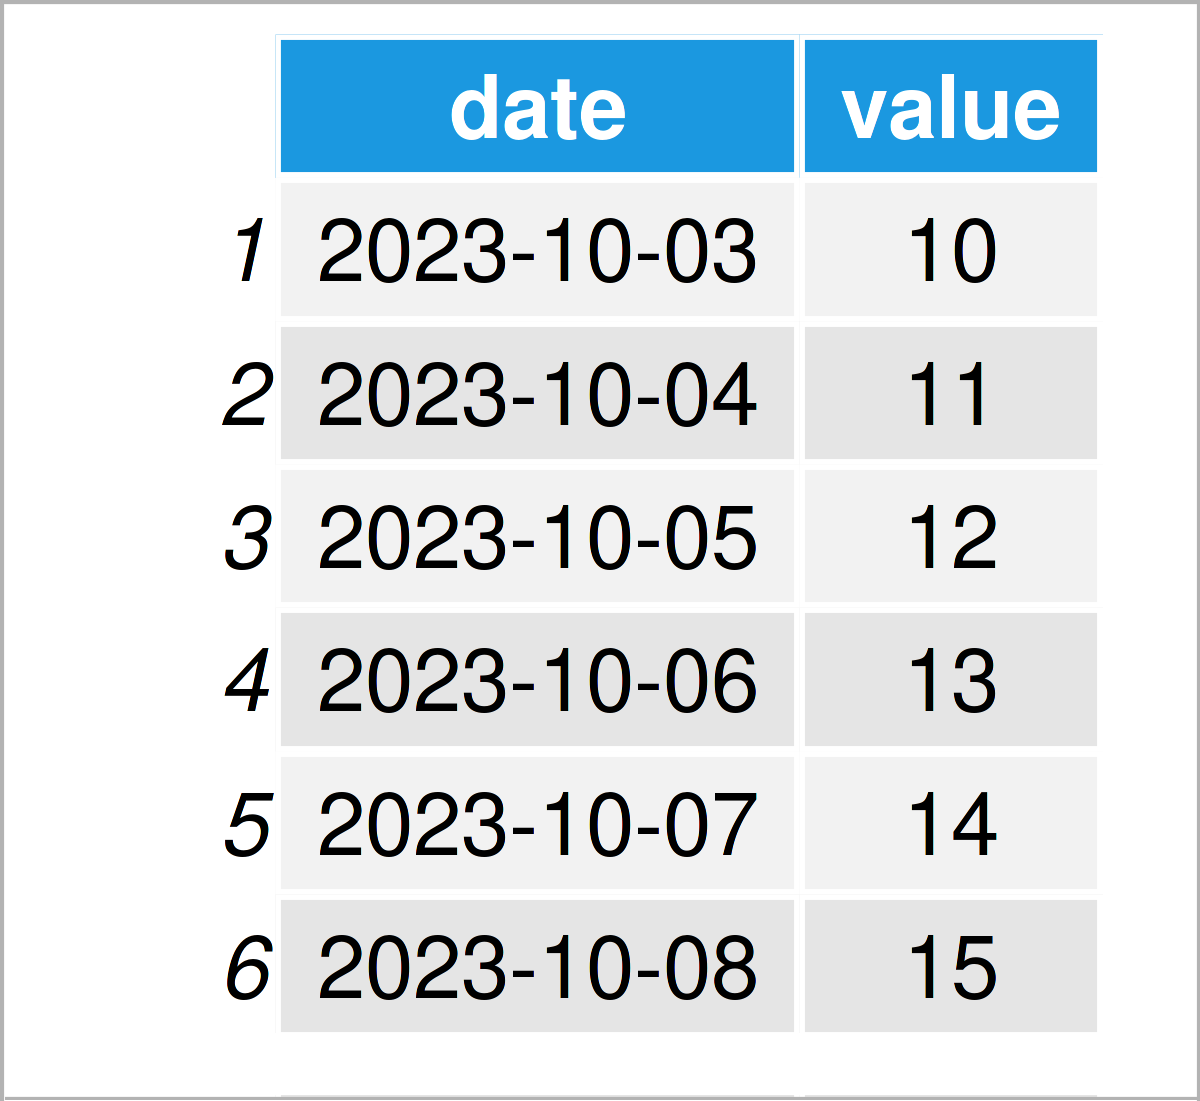
As shown in Table 3, we have created a new data frame that contains a dates and a values variable.
Next, we can apply a similar syntax as in Example 1 to our data. Note that we are specifying certain dates as cut-off points using the as.Date function:
data_dates_range <- data_dates %>%                          # Aggregate dates in range
  mutate(ranges = cut(date,
                      c(as.Date("2023-10-01"),
                        as.Date("2023-10-05"),
                        as.Date("2023-10-12"),
                        as.Date("2023-10-16"),
                        as.Date("2023-10-25")))) %>%
  group_by(ranges) %>%
  dplyr::summarize(sums = sum(value)) %>%
  as.data.frame()
data_dates_range                                            # Print aggregated dates in range

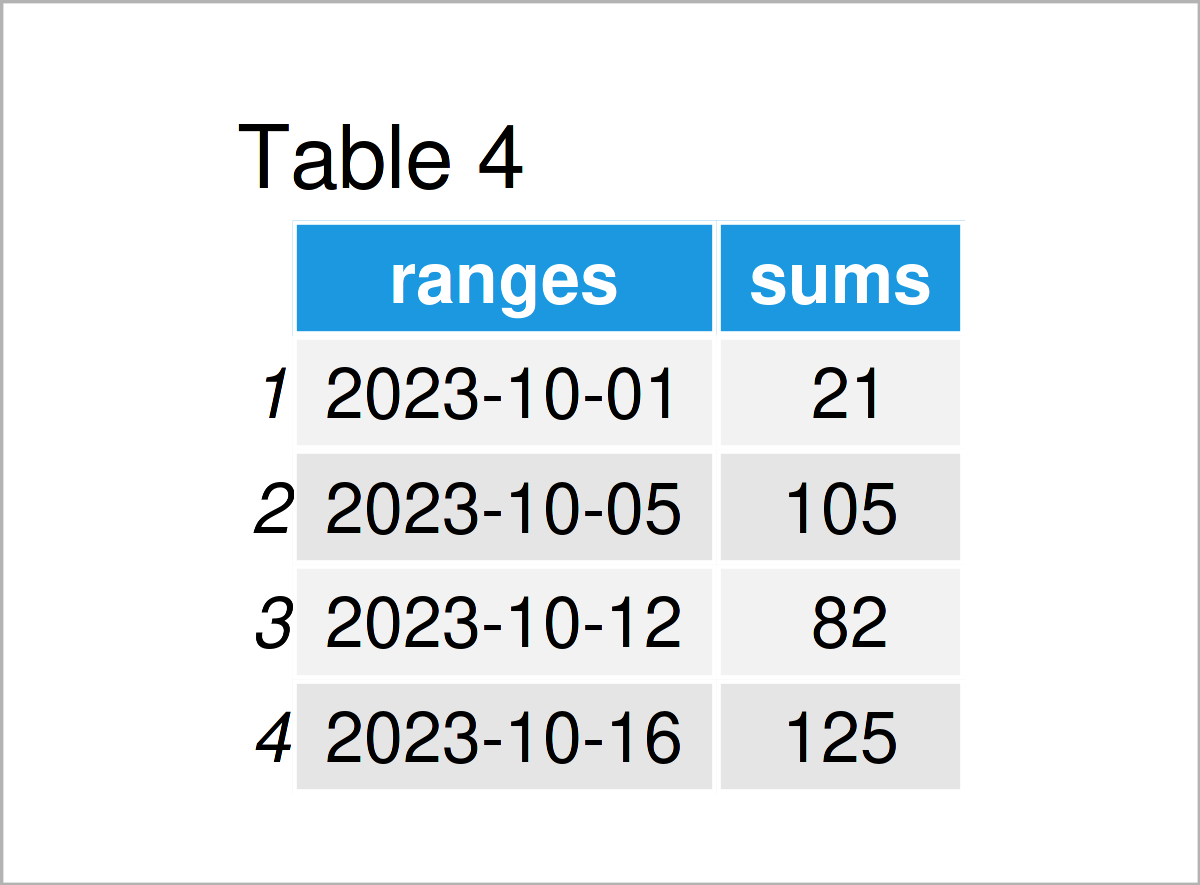
As shown in Table 4, we have created an aggregated data set by date ranges by executing the previous R programming code.
Video, Further Resources & Summary
Would you like to know more about the grouping of data frame rows by a range of values? Then I recommend having a look at the following video which I have published on my YouTube channel. In the video, I’m explaining the topics of this tutorial:
Furthermore, you might have a look at the other R programming articles on my website. Some posts about topics such as counting, numeric values, groups, and extracting data can be found below:
- Assign Value to Elements in Certain Range in R
- Scale Data to Range Between Two Values
- Create Categories Based On Integer & Numeric Range
- range Function in R
- Count Number of Cases within Each Group of Data Frame
- Select Data Frame Rows where Column Values are in Range
- R Programming Tutorials
To summarize: In this post you have learned how to group data by a certain range of values in R programming. In case you have any additional questions, please tell me about it in the comments. Furthermore, please subscribe to my email newsletter in order to receive updates on the newest articles.


