Add Mean & Median to Histogram in R (4 Examples)
In this tutorial you’ll learn how to draw a mean or median line to a histogram in R programming.
The content of the page looks as follows:
You’re here for the answer, so let’s get straight to the examples:
Creation of Exemplifying Data
Consider the following example data:
set.seed(658329)                          # Create example data
x <- round(rnorm(100, 10, 5))
head(x)                                   # Print head of example data
# [1]  6  9  8  9 12 11
The previous output of the RStudio console shows that the example data is a numeric vector consisting of 100 random values.
Example 1: Draw Mean Line to Histogram Using Base R
In this example, I’ll illustrate how to create a histogram with a mean line using the basic installation of the R programming language.
For this, we can use the hist, mean, and abline functions as shown below.
Note that we are also using the text and paste functions to add text labels to our plot:
hist(x)                                   # Draw histogram
abline(v = mean(x),                       # Add line for mean
       col = "red",
       lwd = 3)
text(x = mean(x) * 1.7,                   # Add text for mean
     y = mean(x) * 1.7,
     paste("Mean =", mean(x)),
     col = "red",
     cex = 2)

Figure 1 shows the output of the previous R programming syntax: A Base R histogram with mean line.
Example 2: Draw Median Line to Histogram Using Base R
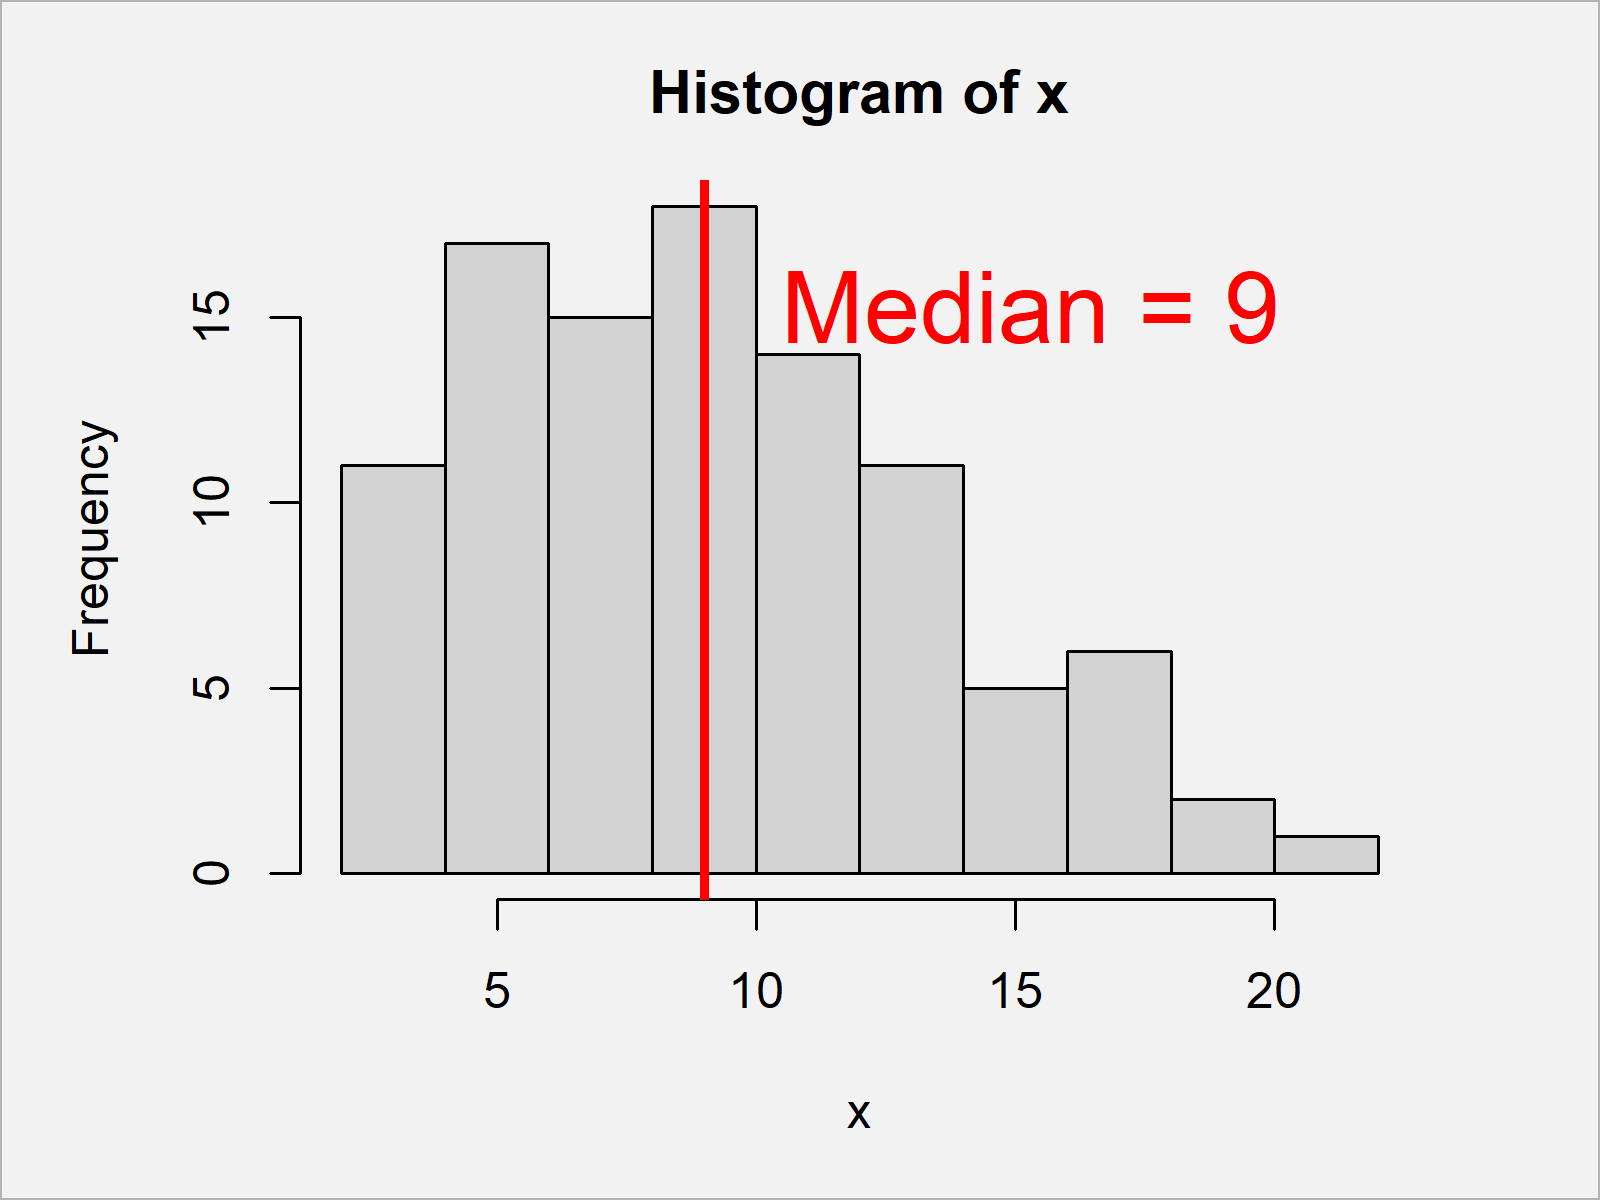
In this example, I’ll illustrate how to overlay a median line to our Base R histogram.
Consider the following R code:
hist(x)                                   # Draw histogram
abline(v = median(x),                     # Add line for median
       col = "red",
       lwd = 3)
text(x = median(x) * 1.7,                 # Add text for median
     y = median(x) * 1.7,
     paste("Median =", median(x)),
     col = "red",
     cex = 2)

By running the previous code we have created Figure 2, i.e. a histogram with vertical median line.
Example 3: Draw Mean Line to Histogram Using ggplot2 Package
In this example, I’ll illustrate how to use the functions of the ggplot2 package to add a mean line to our plot.
First, we need to install and load the ggplot2 package to R:
install.packages("ggplot2")               # Install ggplot2 package
library("ggplot2")                        # Load ggplot2 package
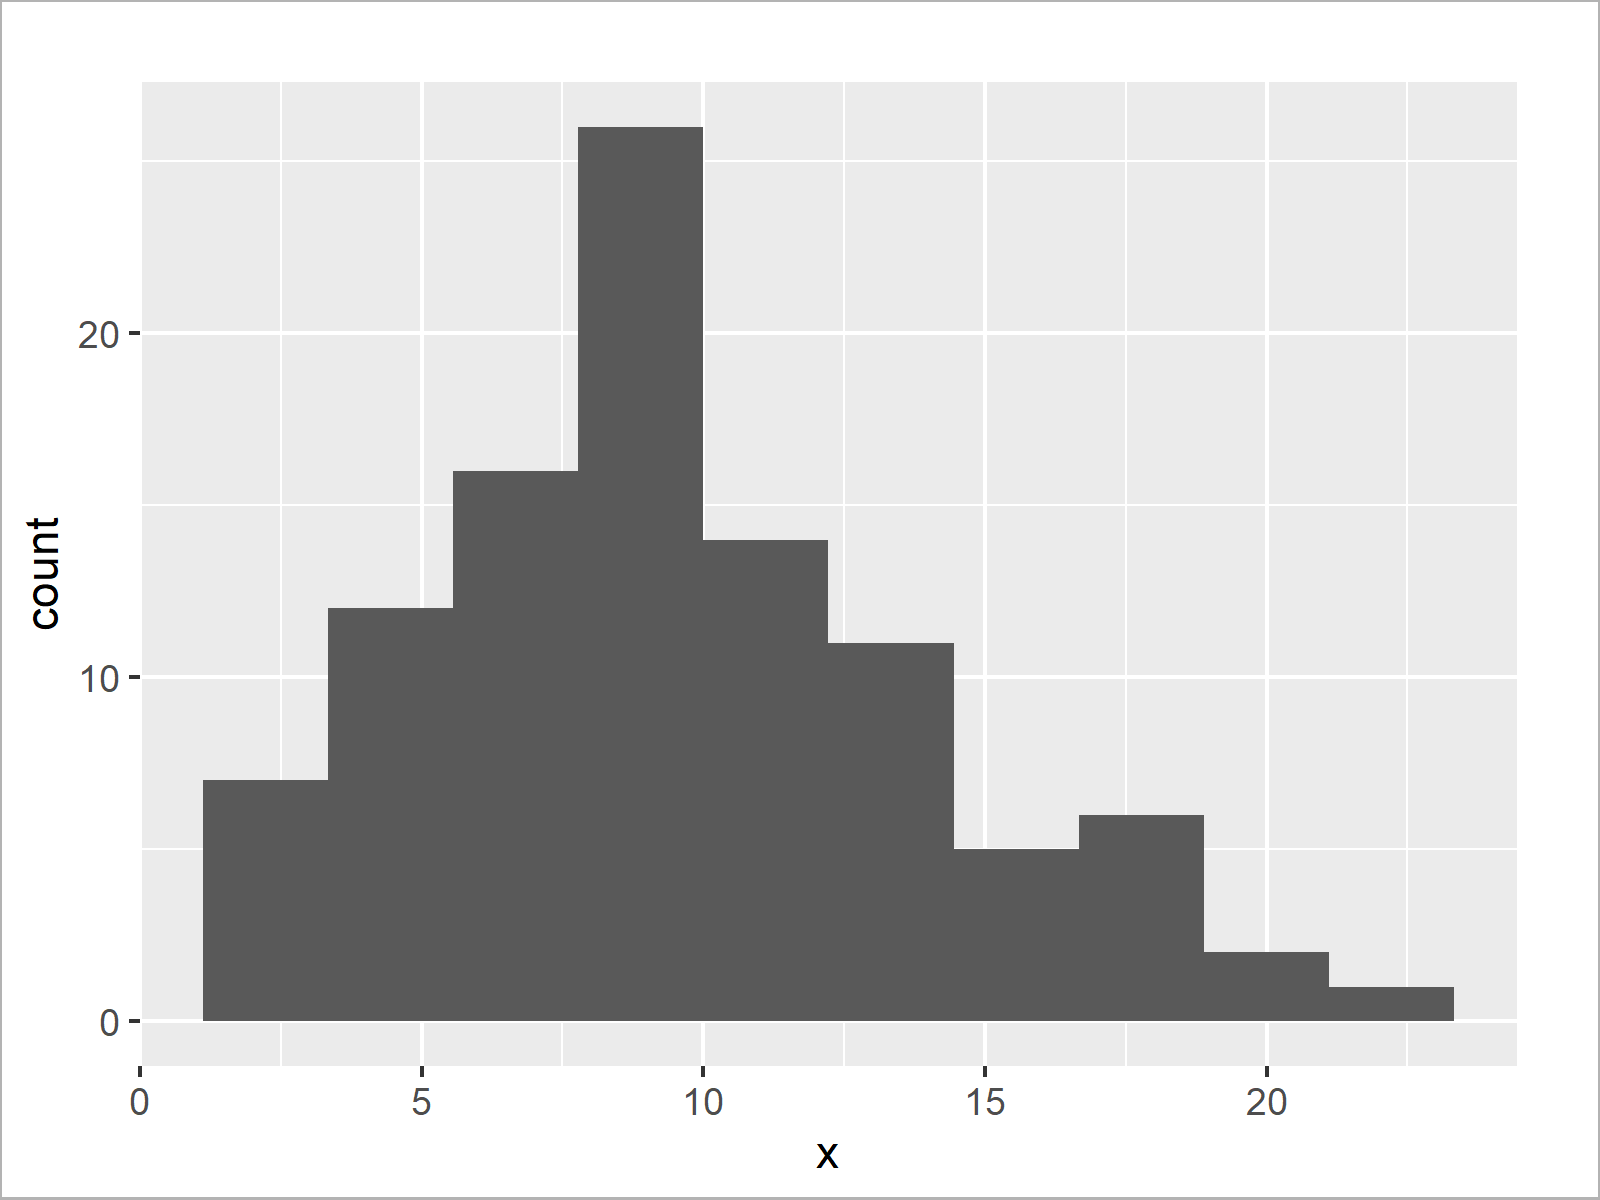
Next, we can create and draw a ggplot2 histogram without mean line as shown below:
ggp <- ggplot(data.frame(x), aes(x)) +    # Draw histogram
  geom_histogram(bins = 10)
ggp

In the next step, we can annotate a vertical mean line and text labels:
ggp +                                     # Draw histogram
  geom_vline(xintercept = mean(x),        # Add line for mean
             col = "red",
             lwd = 3) +
  annotate("text",                        # Add text for mean
           x = mean(x) * 1.7,
           y = mean(x) * 1.7,
           label = paste("Mean =", mean(x)),
           col = "red",
           size = 8)

After running the previous code the ggplot2 histogram with mean line shown in Figure 4 has been created.
Example 4: Draw Median Line to Histogram Using ggplot2 Package
In this example, I’ll illustrate how to draw a median line to a ggplot2 histogram.
For this, we can use the graphic object ggp that we have created in the previous example as basement:
ggp +                                     # Draw histogram
  geom_vline(xintercept = median(x),      # Add line for median
             col = "red",
             lwd = 3) +
  annotate("text",                        # Add text for median
           x = median(x) * 1.7,
           y = median(x) * 1.7,
           label = paste("Median =", median(x)),
           col = "red",
           size = 8)

The output of the previous R code is shown in Figure 5 – A ggplot2 graph showing a histogram with median line.
Video & Further Resources
In case you need more explanations on how to draw an average line to a plot using the R syntax of this article, you may watch the following video of my YouTube channel. I’m showing the topics of this article in the video.
In addition, you might want to have a look at the other articles of my website. I have published numerous related tutorials about plots in R already.
Summary: In this tutorial you have learned how to add a vertical mean or median line to a graph in R. If you have further comments and/or questions, let me know in the comments section below.


