Add Text to Plot Using text() Function in Base R (3 Examples)
In this tutorial, I’ll illustrate how to add text to graphics using the text() function in the R programming language.
The article consists of the following contents:
Let’s jump right to the examples…
Definition & Basic R Syntax of text Function
Definition: The text R function draws text elements to plots in Base R.
Basic R Syntax: Please find the basic R programming syntax of the text function below.
text(x = 1, y = 1, "any text") # Basic R syntax of text function
In the following, I’ll show three examples for the application of the text function in the R programming language.
Example Plot
First, let’s create an example plot in R:
plot(1:10) # Basic plot in R

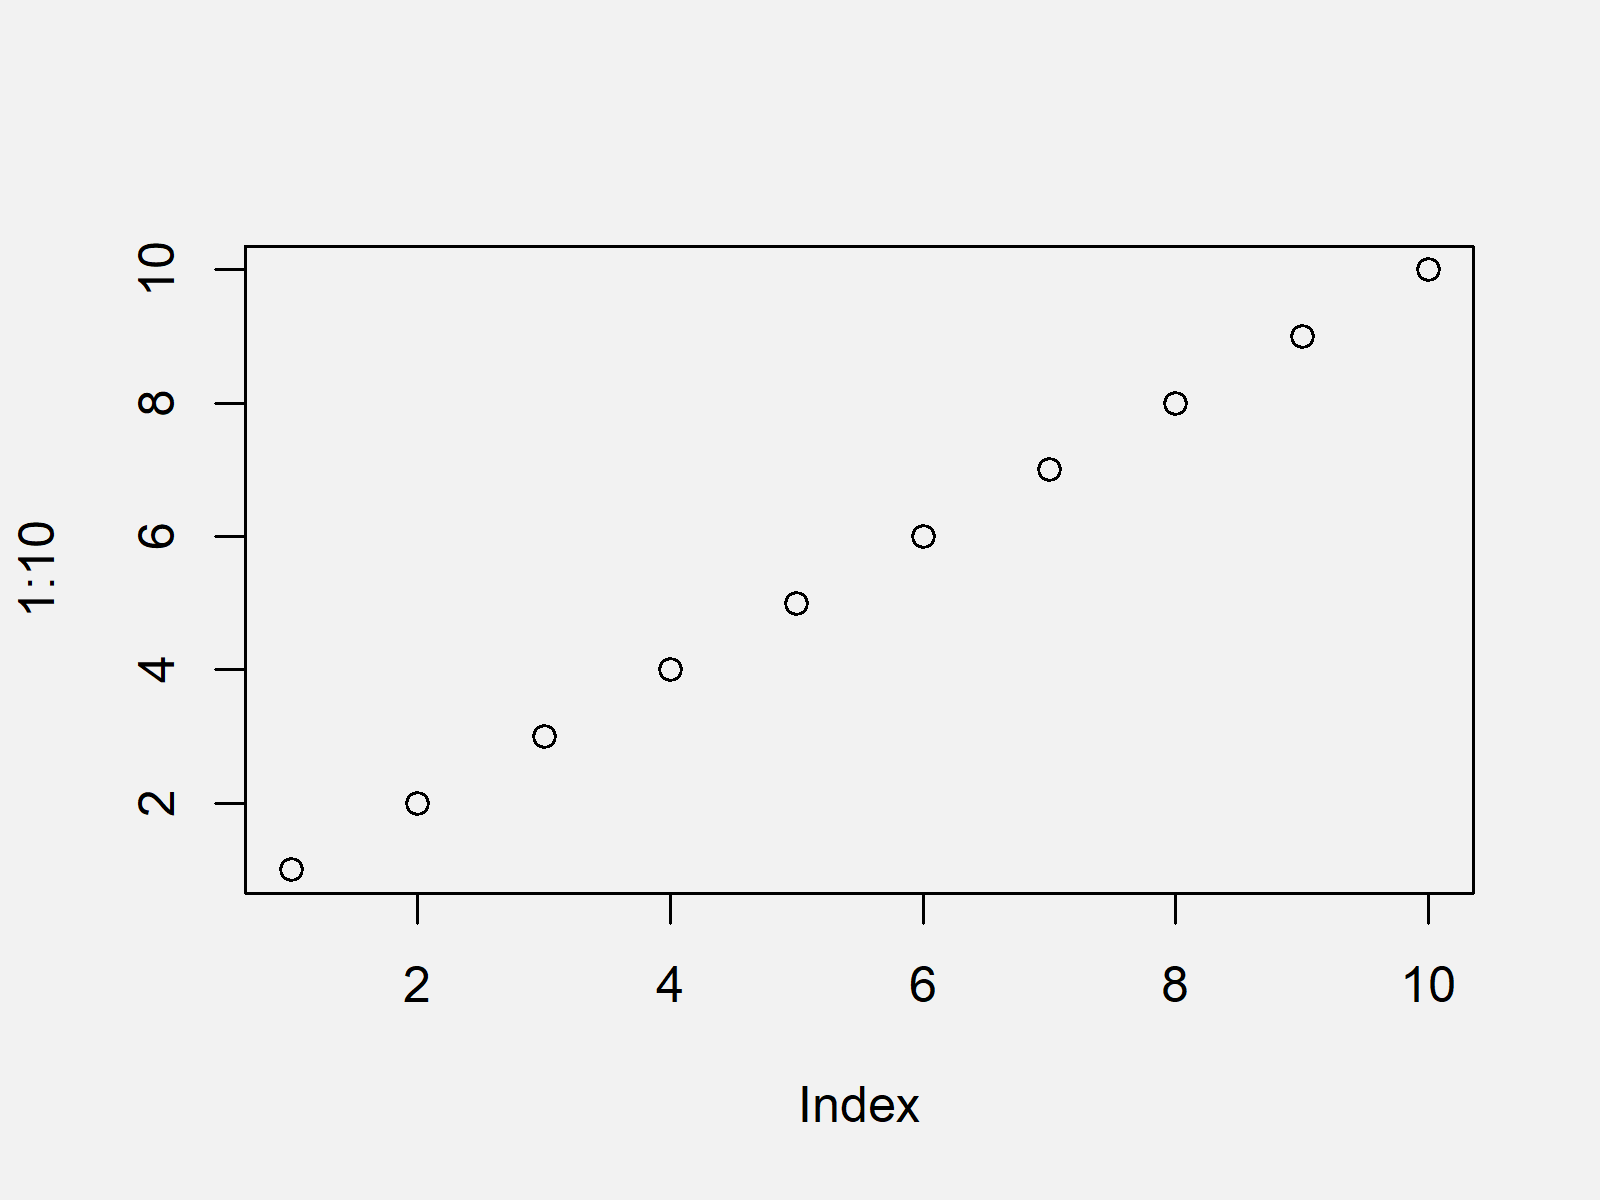
The output of the previous R programming syntax is shown in Figure 1 – Our example plot is a scatterplot showing ten data points that are ranging from 1 to 10. Note that we could also apply the following examples to other Base R plot types such as boxplots, barcharts, histograms, and density plots.
Example 1: Add Text to Plot
Example 1 shows the basic application of the text function in the R programming language. Within the text function, we have to specify the x- and y-coordinates and the text we want to annotate as character string:
plot(1:10)                        # Basic plot in R
text(x = 2, y = 3,                # Add text element
     "This is my text")

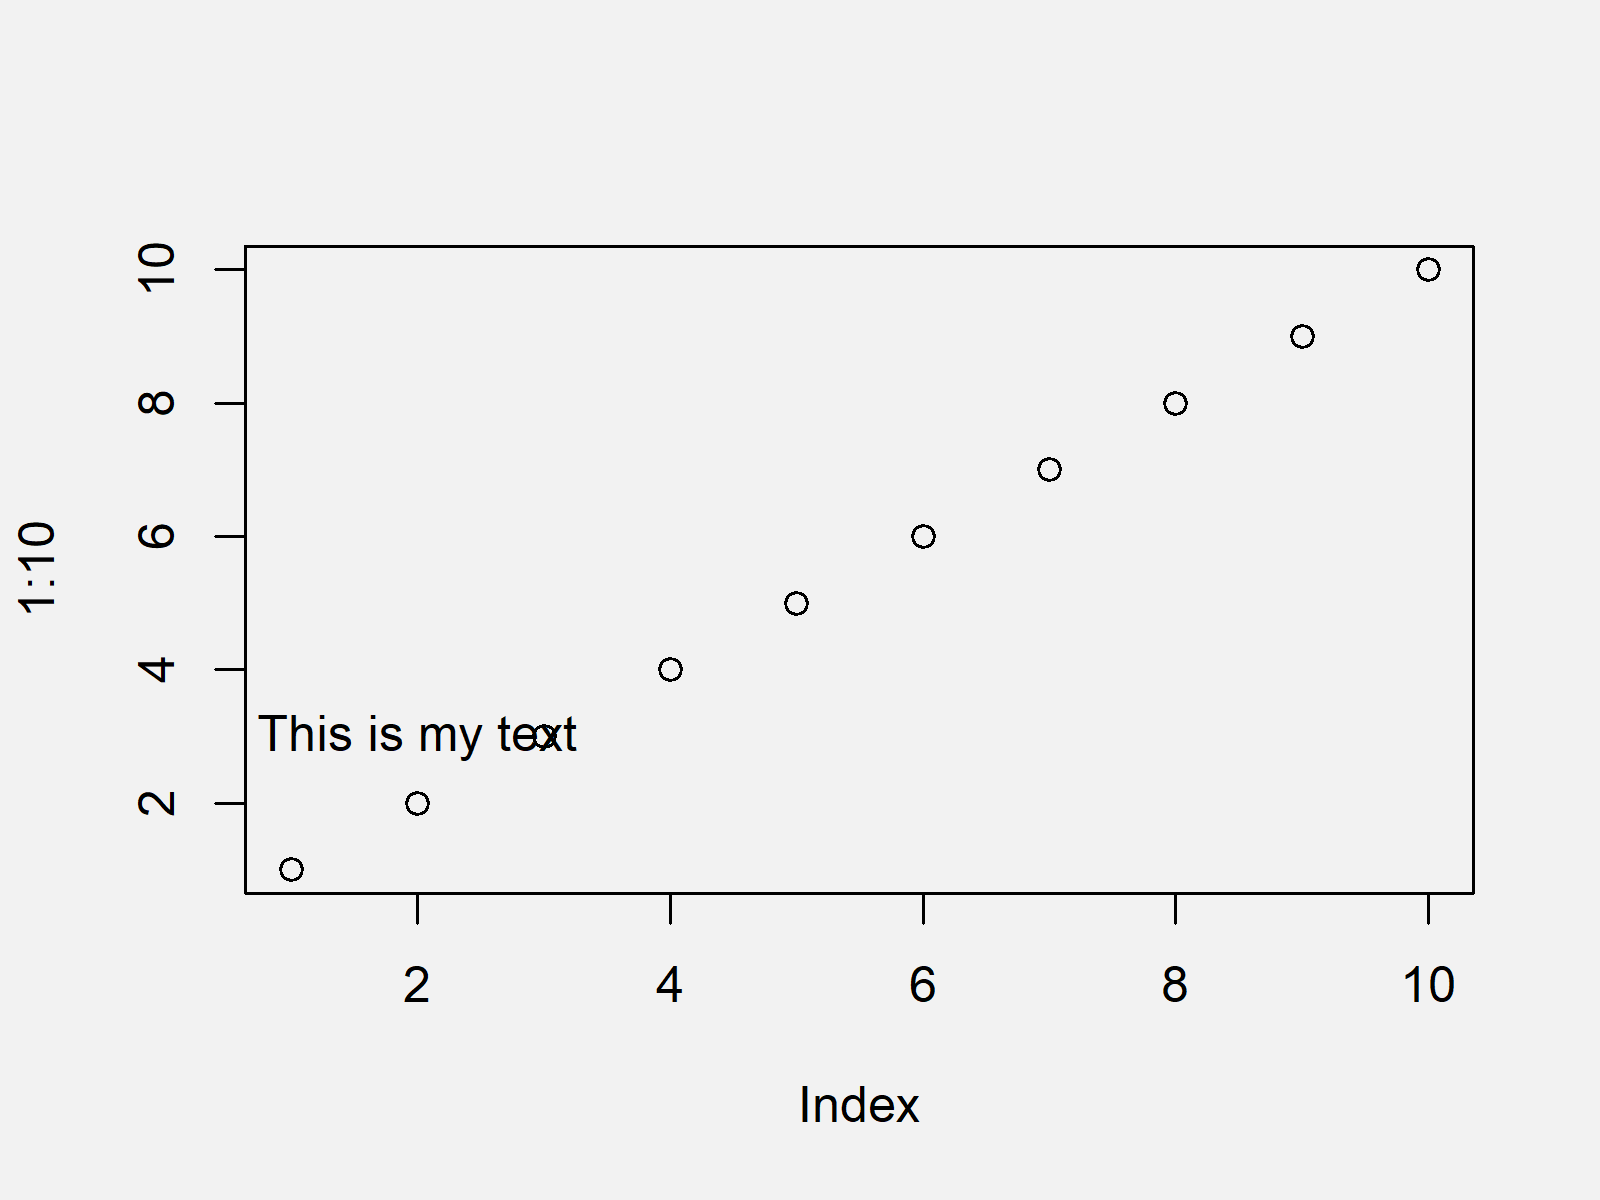
Figure 2 shows the output of the previous syntax – Our example graph and a text element at the bottom left corner of the plot.
Example 2: Change Color & Size of Text
The following R programming code illustrates how to modify the color and size of our text element. The color can be changed by using the col argument of the text function and the size can be changed by using the cex argument.
plot(1:10)                        # Basic plot in R
text(x = 5, y = 7,                # Text with different color & size
     "This is my text",
     col = "#1b98e0",
     cex = 2)

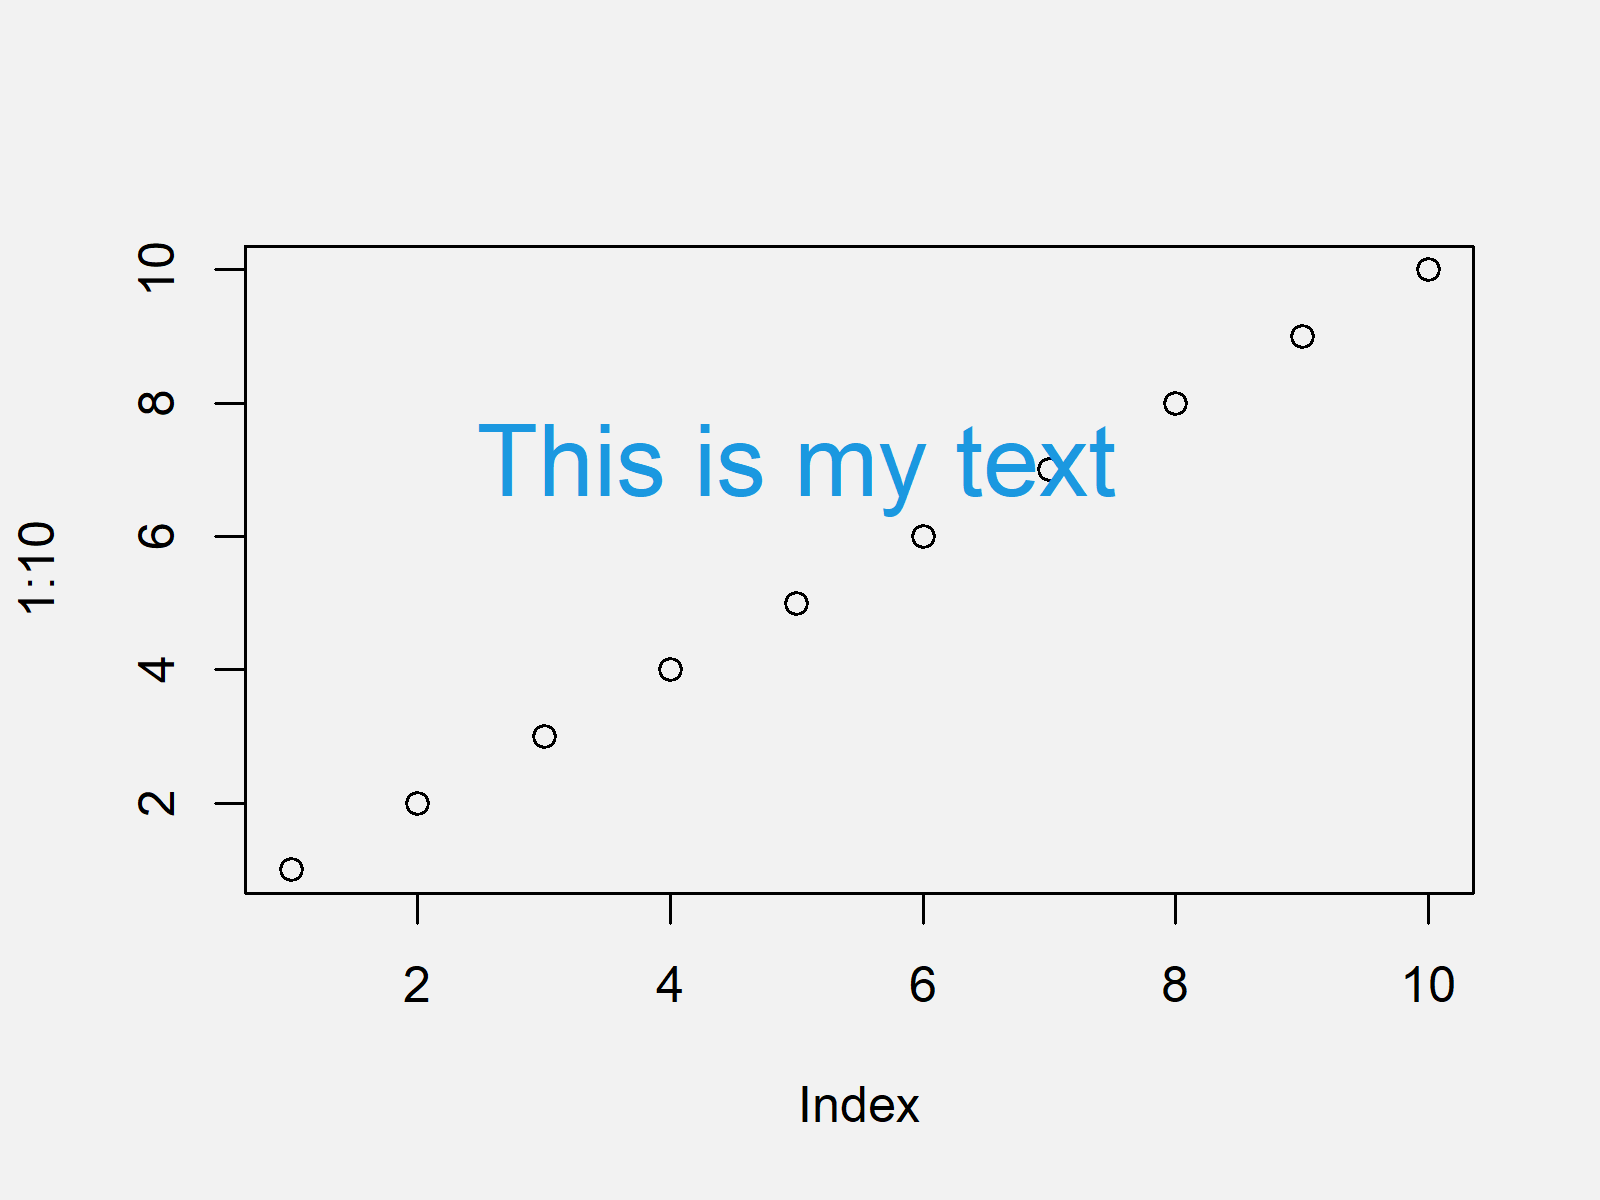
Figure 3 shows the output of the previous R programming code: Our example plot with a blue text element and a text with larger size.
Note that we can assign any hex color code to the col argument, or we could use predefined colors such as red, yellow, orange and green. Also note that the larger the values assigned to the cex argument gets, the larger (or smaller) gets the text shown in the graph.
Example 3: Draw Multiple Text Elements to Plot
In Example 3, I’ll show how to add multiple texts to our plot. For this, we simply need to apply the text command several times:
plot(1:10)                        # Basic plot in R
text(x = 3, y = 4,                # First text
     "This is my first text")
text(x = 5, y = 7,                # Second text
     "This is my second text")

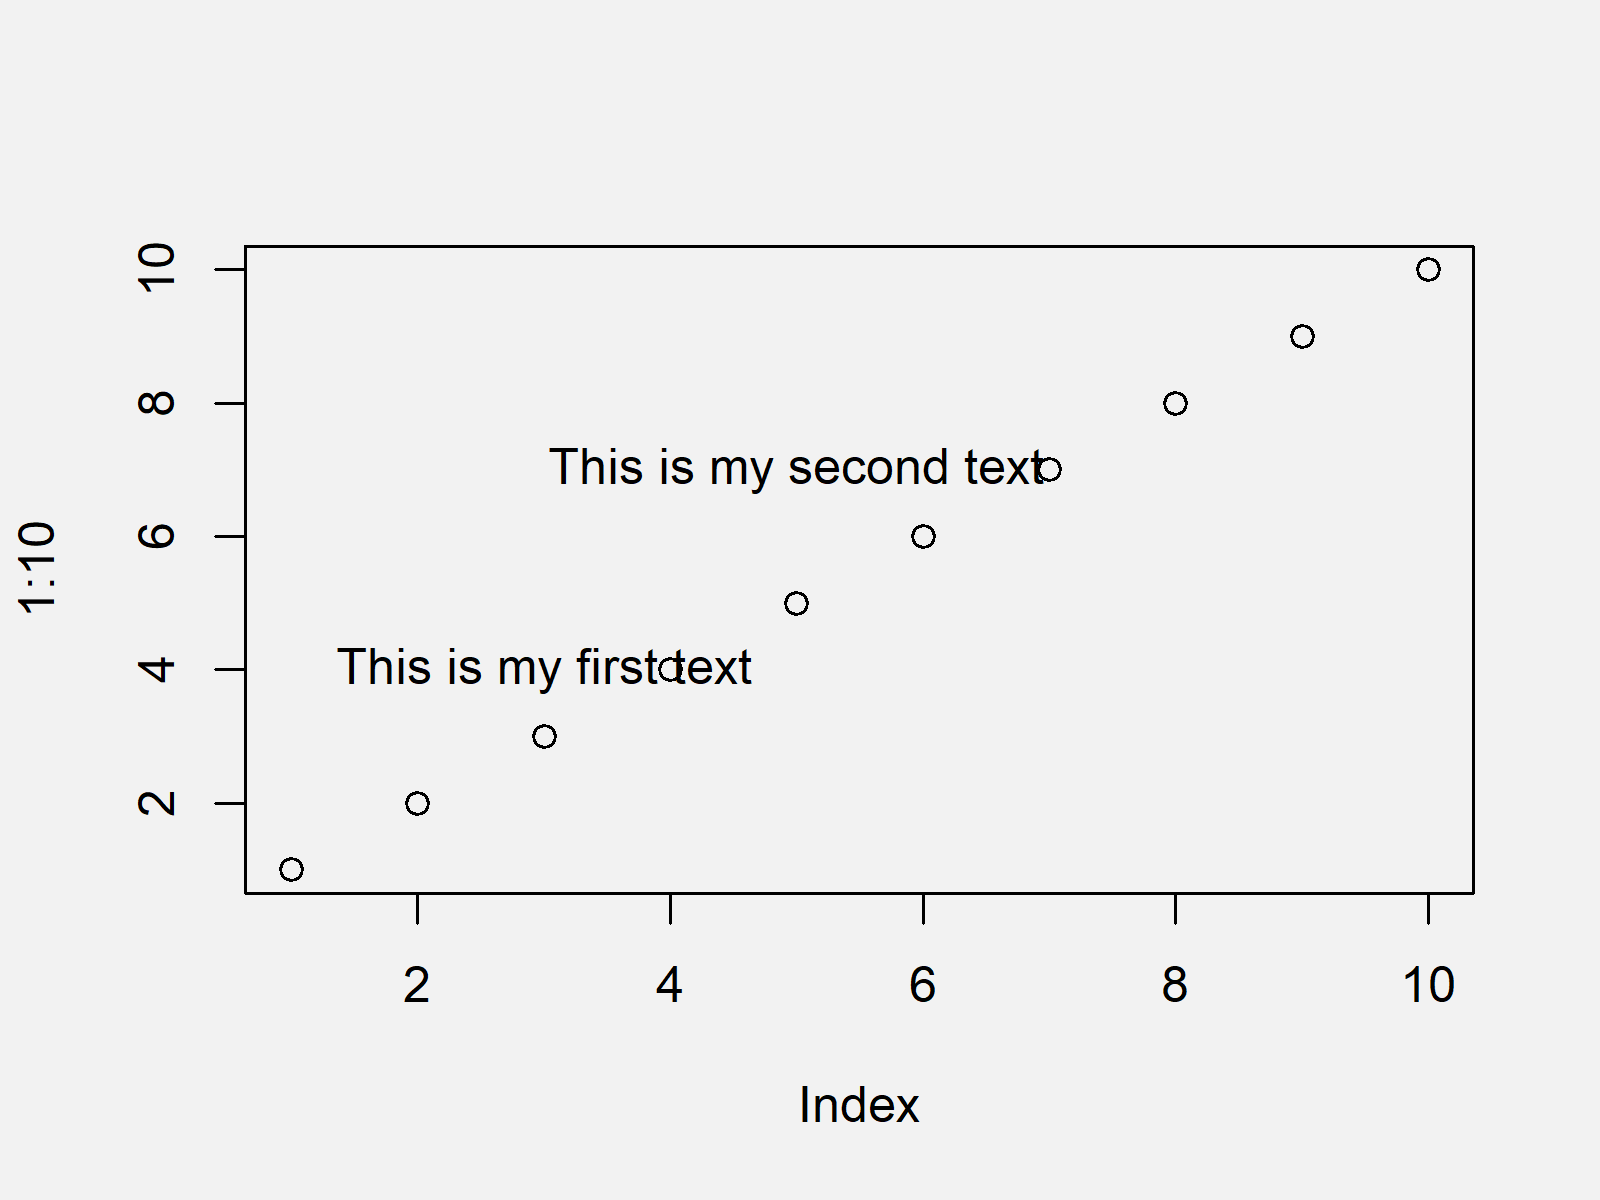
The output of the previous syntax is shown in Figure 4 – Our example plot with two sentences.
Video, Further Resources & Summary
I have recently released a video on my YouTube channel, which explains the R codes of this article. You can find the video below:
In addition, you might want to have a look at the related tutorials that I have published on my website. Note that this tutorial explained how to add text to Base R plots. Below you can find tutorials for other graphical environments such as the ggplot2 package of the tidyverse or the plotrix package.
- Annotate Text Outside of ggplot2 Plot in R
- Left-Align Text in ggplot2 Plot in R
- Change Font Size of ggplot2 Plot in R
- R Graphics Gallery
- R Functions List (+ Examples)
- The R Programming Language
In this post, I illustrated how to apply the text function in the R programming language. If you have further comments or questions, don’t hesitate to let me know in the comments section below.


