Add Inset on Top of Previous Plot Using inset_element Function in R (Example)
On this page, I’ll show how to apply the inset_element function to add a plot on top of another plot in the R programming language.
The tutorial will consist of these contents:
Here’s how to do it.
Example Data, Packages & Default Graphics
The data below is used as basement for this R programming tutorial:
data <- data.frame(x = 1:5,            # Creating example data
                   y1 = 1:5,
                   y2 = 5:1)
data                                   # Printing example data
#   x y1 y2
# 1 1  1  5
# 2 2  2  4
# 3 3  3  3
# 4 4  4  2
# 5 5  5  1
The previous output of the RStudio console shows that our example data has five rows and three columns. All variables of our plot are numeric.
For the following tutorial, we’ll need to install and load the ggplot2 package:
install.packages("ggplot2")            # Install & load ggplot2
library("ggplot2")
Furthermore, we have to install and load the patchwork package.
install.packages("patchwork")          # Install patchwork package
library("patchwork")                   # Load patchwork package
As next step, we can draw the data in two separate plots:
ggp_1 <- ggplot(data, aes(x, y1)) +    # Create first plot
  geom_point()
ggp_1                                  # Draw first plot

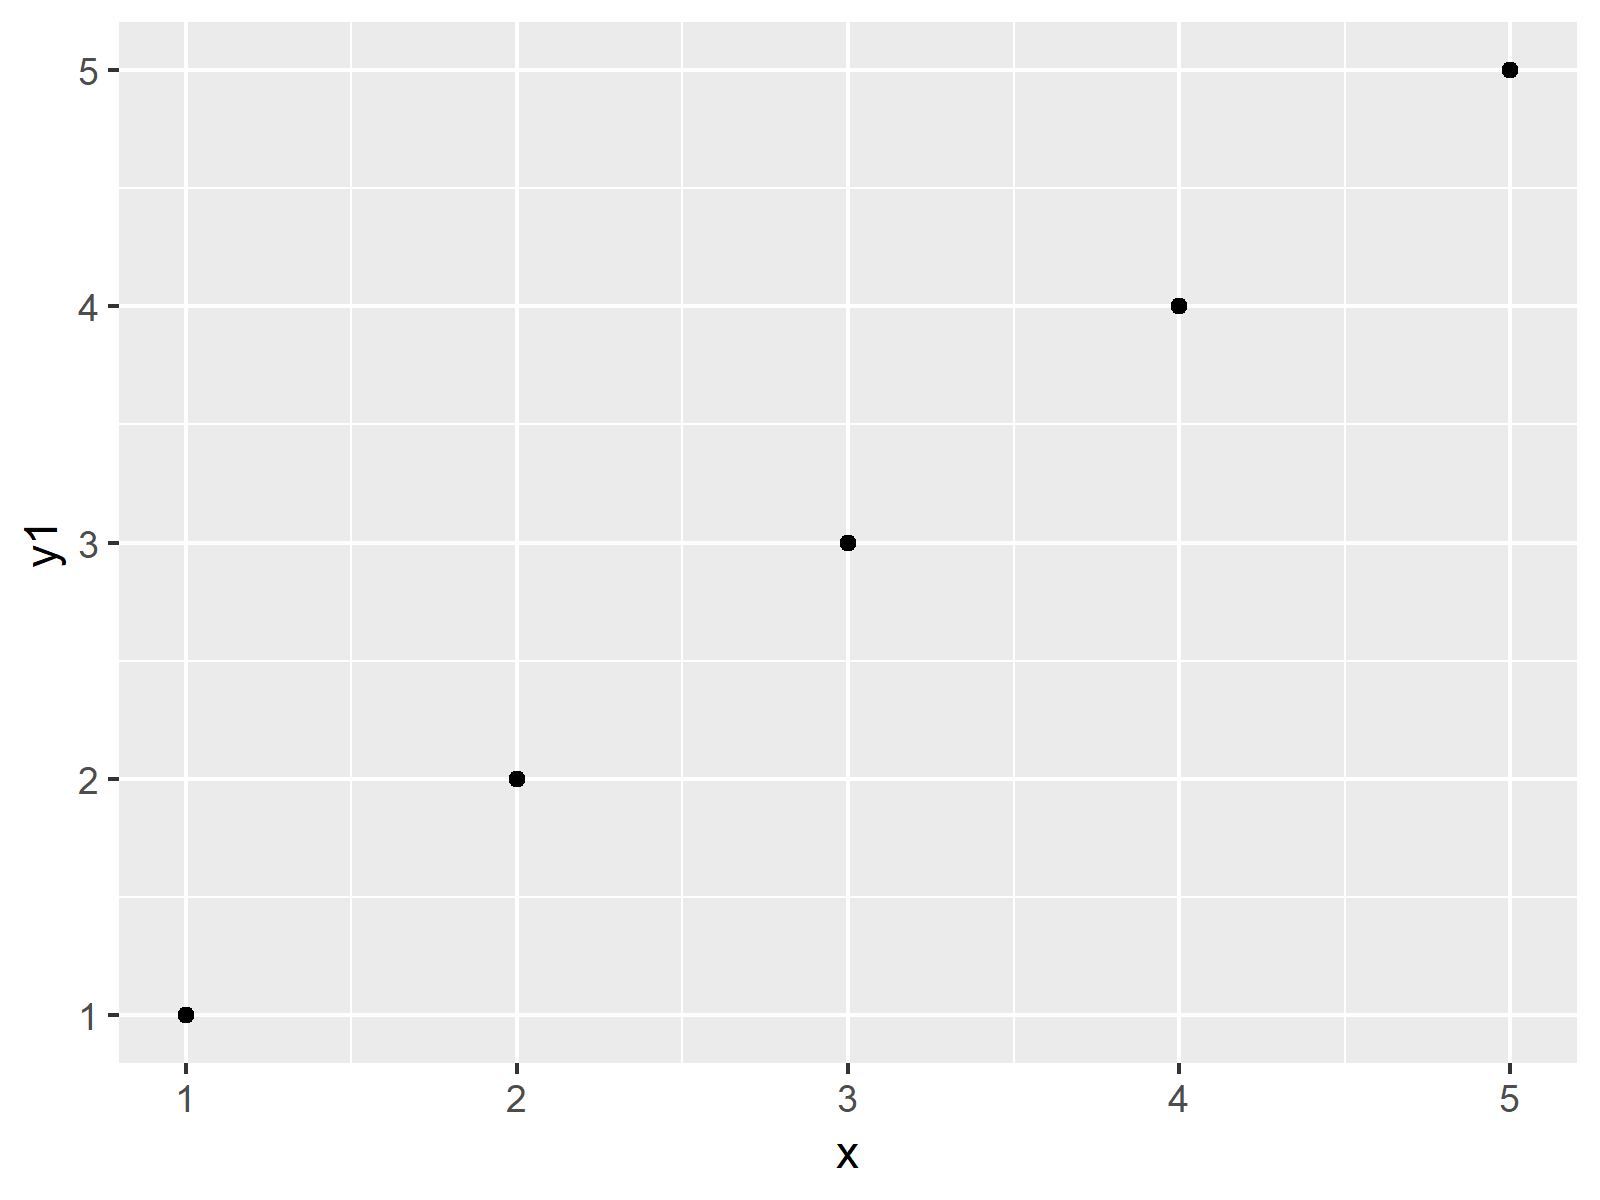
As you can see in Figure 1, the previous R programming syntax created a scatterplot showing the variables x and y1.
Let’s draw our second ggplot2 plot:
ggp_2 <- ggplot(data, aes(x, y2)) +    # Create second plot
  geom_point()
ggp_2                                  # Draw second plot

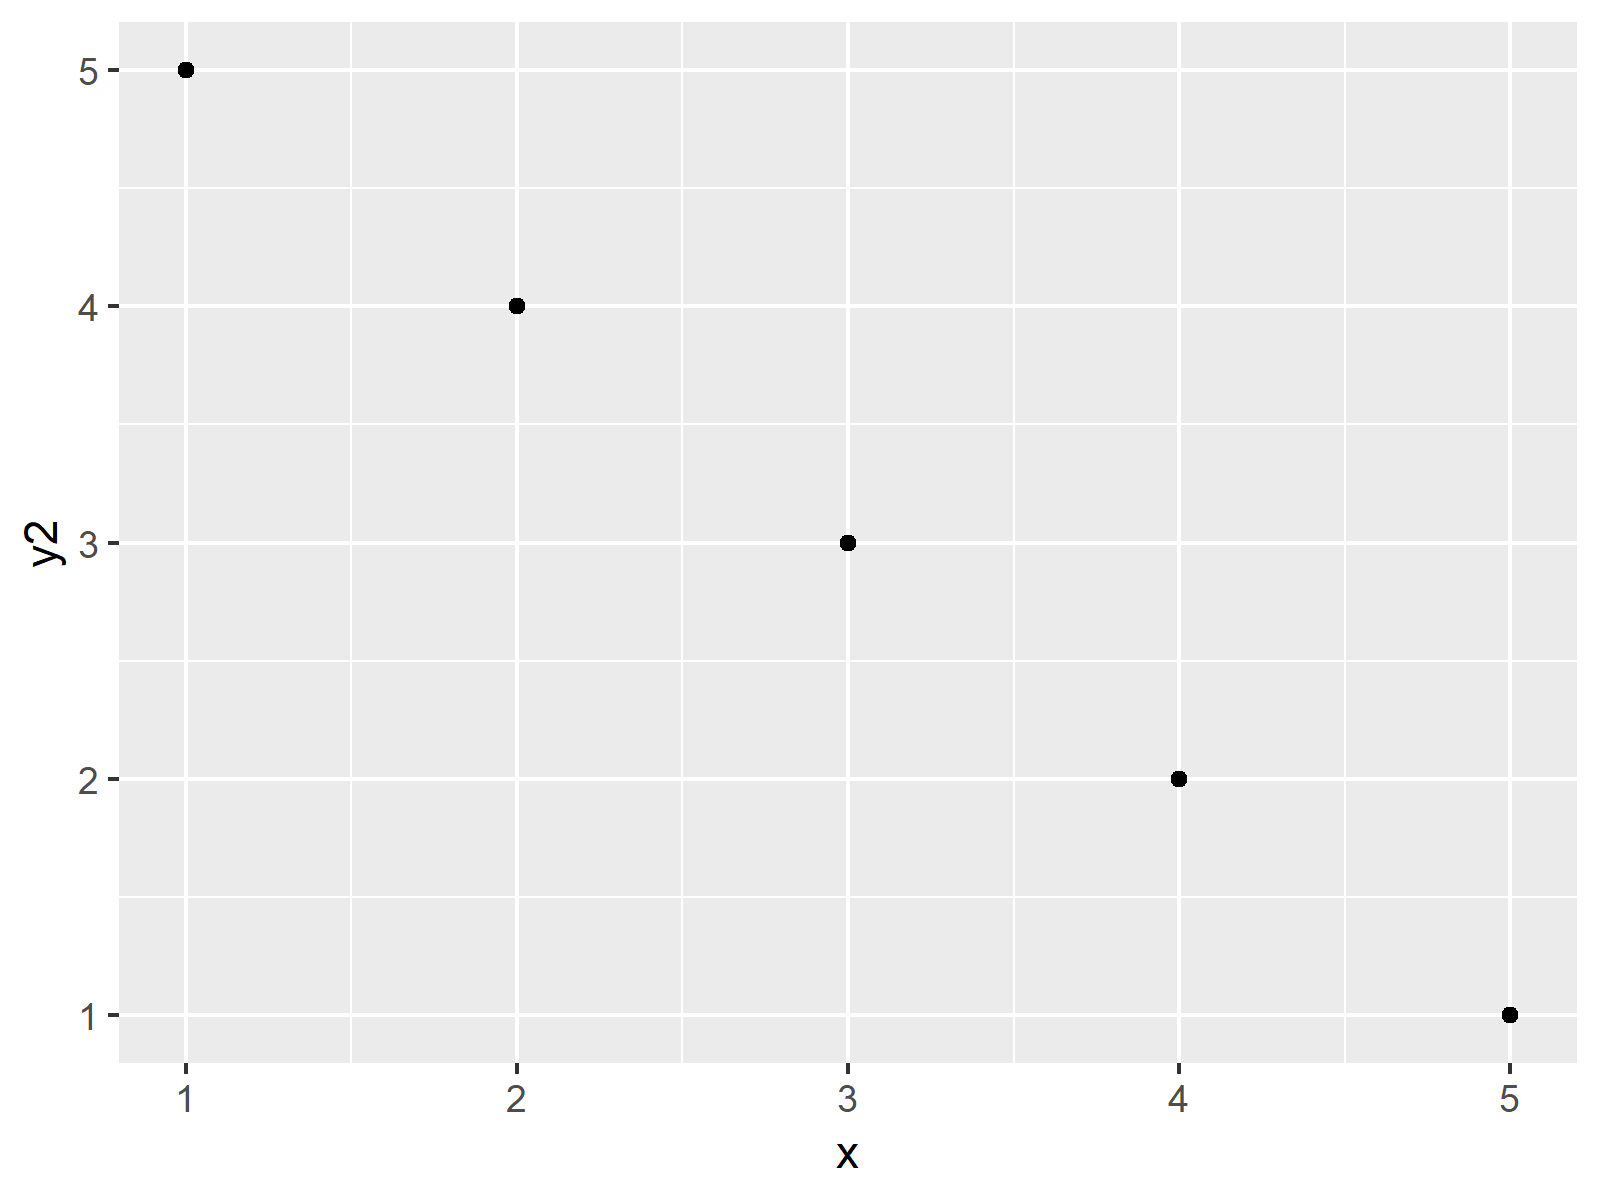
The output of the previous R code is shown in Figure 2: Another scatterplot that contains the values of x and y2.
Next, I’ll explain how to use the second plot as inset for the first plot.
Example: Using inset_element() Function of patchwork Package to Add Inset
This example illustrates how to apply the inset_element to draw our second plot on top of the first plot. Have a look at the following R code and the resulting graphic:
ggp_combi <- ggp_1 +                   # Combine plots
  inset_element(p = ggp_2,
                left = 0.05,
                bottom = 0.6,
                right = 0.5,
                top = 0.95)
ggp_combi                              # Draw combined plot

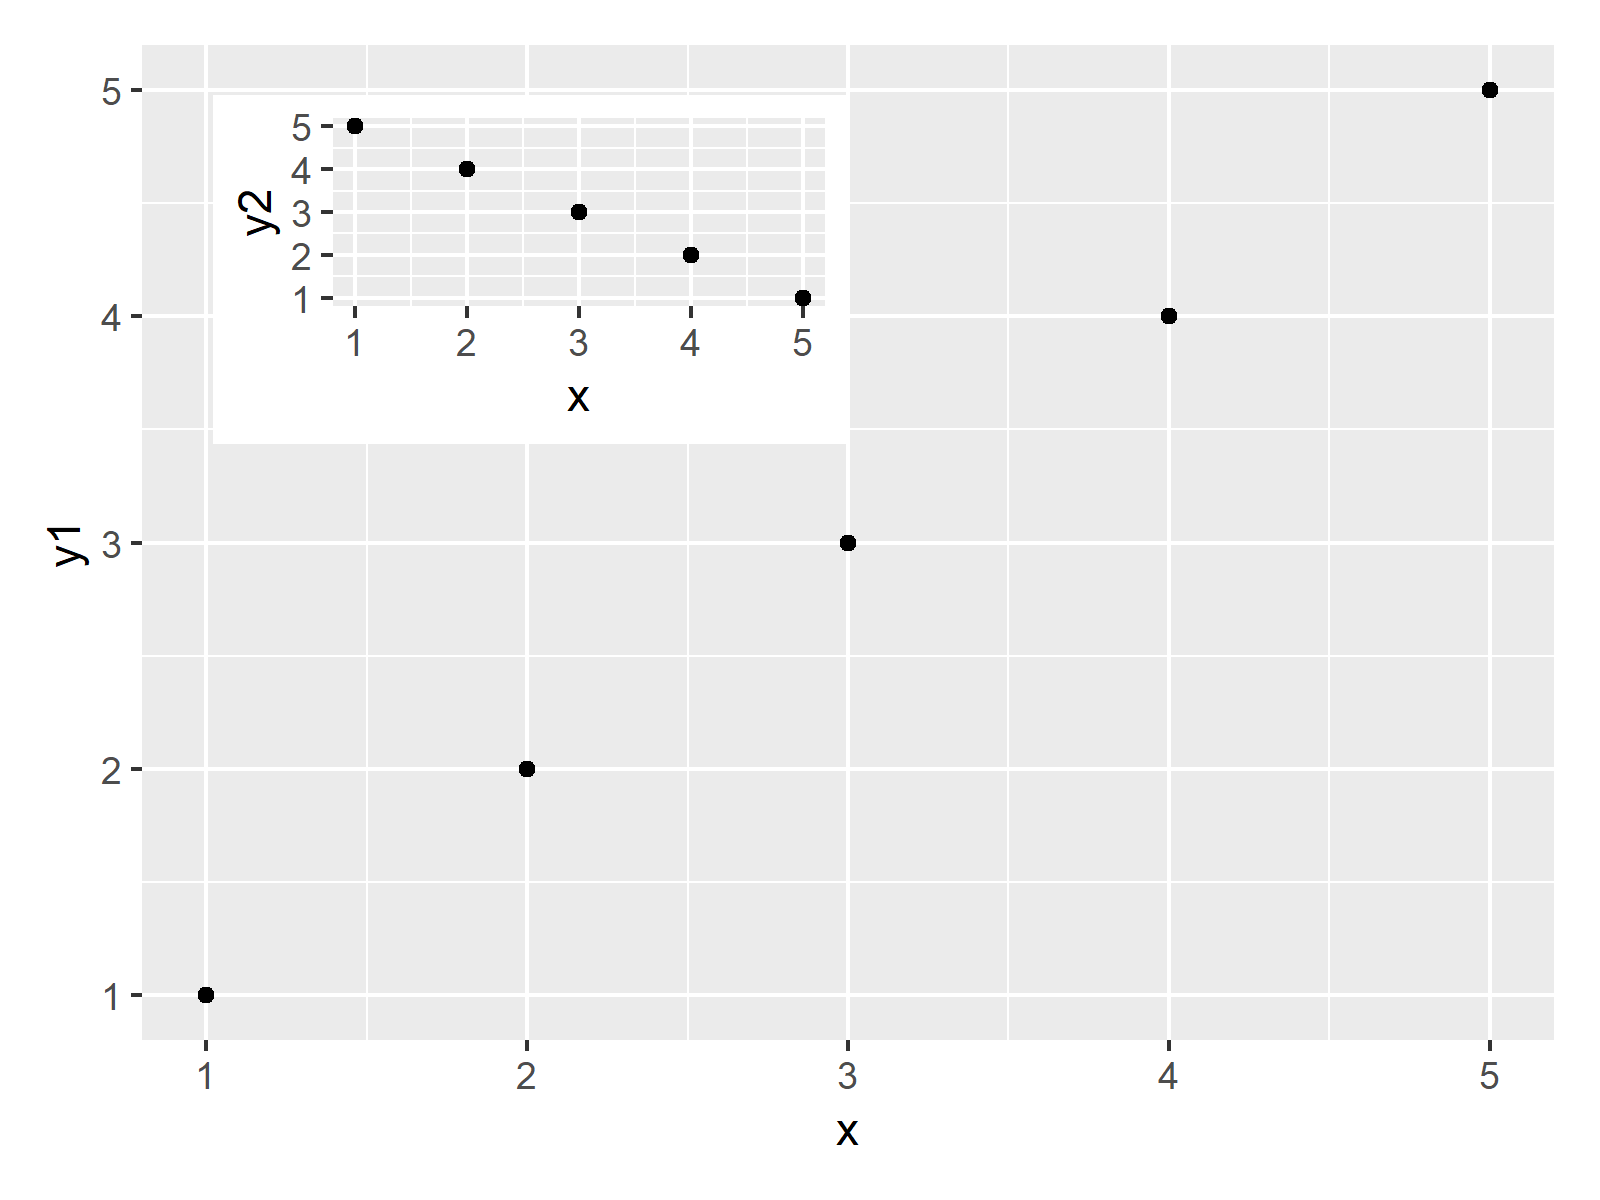
As shown in Figure 3, we drew two graphs on top of each other with the previous R code.
For this, we had to add the inset_element function to our first plot. Within the inset_element function we had to specify the second plot as well as the units giving the location of the outer bounds of our second plot.
Video, Further Resources & Summary
Do you want to learn more about drawing graphics in R? Then I can recommend to have a look at the following video of my YouTube channel. I illustrate the content of this tutorial in the video.
In addition, you may want to have a look at the other articles of www.statisticsglobe.com:
- Draw Composition of Plots Using the patchwork Package
- Plot Frequencies on Top of Stacked Bar Chart with ggplot2
- Add Color Between Two Points of Kernel Density Plot
- Add Greek Symbols to ggplot2 Plot in R
- Add Count Labels on Top of ggplot2 Barchart
- patchwork Package in R
- Graphics Overview in R
- R Programming Language
In this R tutorial you learned how to add a plot inset. In case you have further questions, tell me about it in the comments section. Besides that, please subscribe to my email newsletter to receive updates on new tutorials.


