Zoom & Navigate in R Plots (2 Examples)
In this tutorial, I’ll explain how to zoom and navigate in graphs in R.
The article contains the following:
You’re here for the answer, so let’s get straight to the examples…
Example 1: Zoom Into Plot Using zm() Function of zoom Package
The code below illustrates how to use the zm function of the zoom package to zoom into the plotting area of a graph within RStudio.
To be able to use the functions of the zoom package, we first need to install and load zoom:
install.packages("zoom")   # Install zoom package
library("zoom")            # Load zoom package
In the next step, we can draw a plot in R as we would usually do:
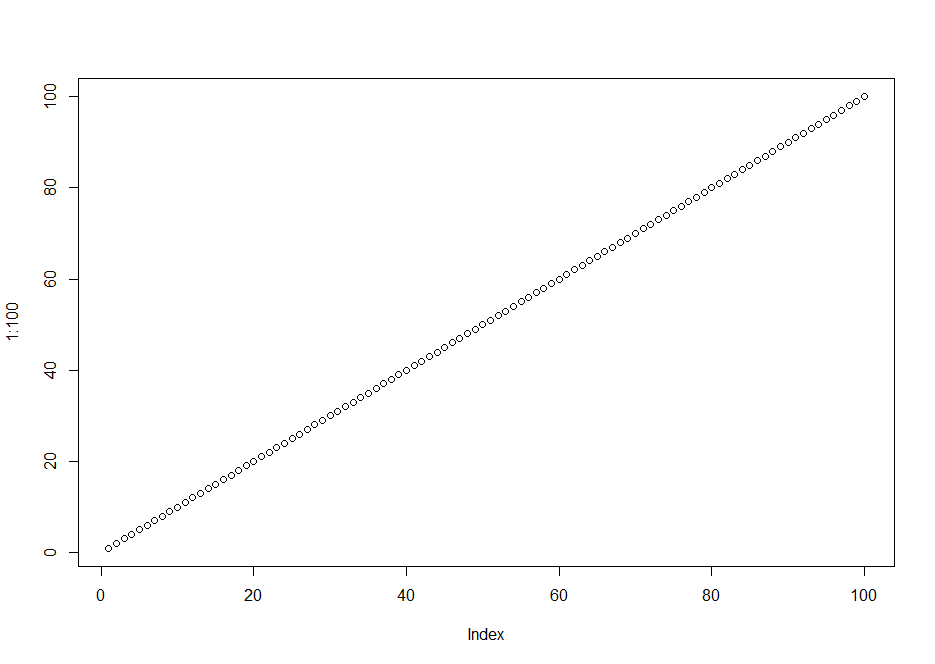
plot(1:100) # Draw plot

Now, we can use the zm function to open a new plot window in RStudio:
zm()
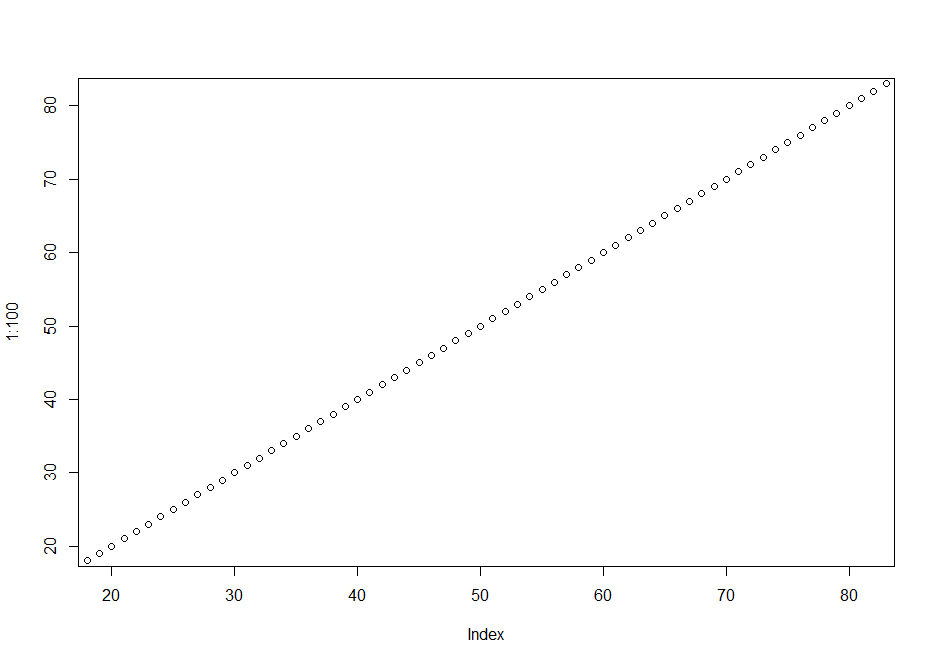
Now, you can zoom in or out by using the + and – signs on your keyboard. For instance, the following graph is created when we use five times the + symbol:

As you can see based on the y- and x-axes, we have zoomed into our plot.
Example 2: Move to the Right Side of Plot Using zm() Function of zoom Package
The zm function can also be used to move within our graphic. Let’s draw our plot once again:
plot(1:100) # Draw plot
Now, we have to open a new plot window as we already did in Example 1:
zm()
We can now use the arrows on our keyboard to move up, down, to the left, and to the right.
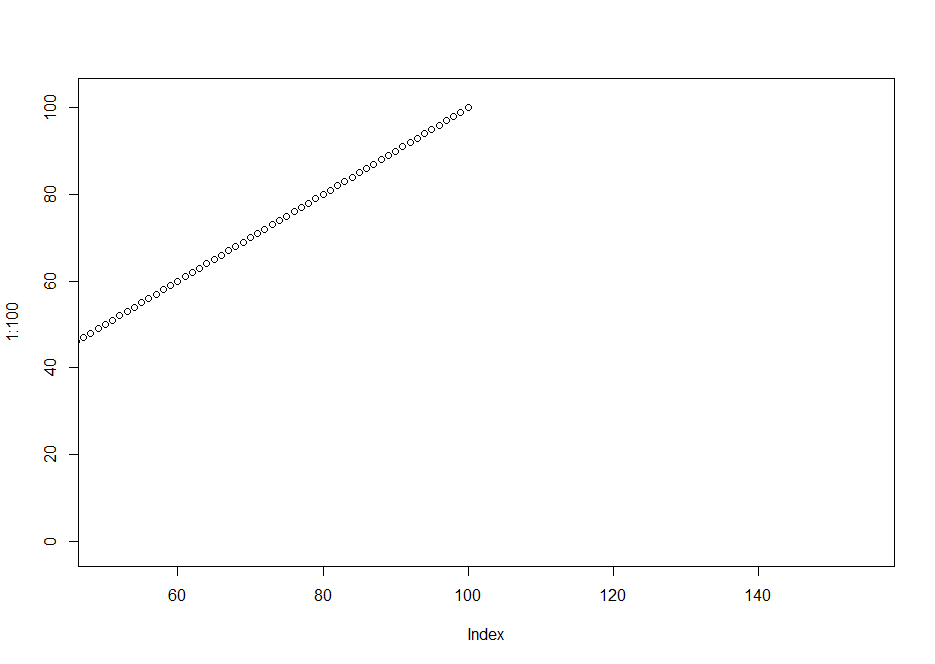
For instance, we may create the following plot by moving five times to the right side:

Note that we may also use the mouse to scroll through our plot.
Video, Further Resources & Summary
Have a look at the following video on my YouTube channel. In the video, I demonstrate the examples of this tutorial in a live session.
Furthermore, you might read the other tutorials on this homepage. A selection of other tutorials is shown below:
- ggplot2 Barplot with Axis Break & Zoom in R
- Zoom into ggplot2 Plot without Removing Data
- Break Axis of Plot in R
- Graphics Overview in R
- All R Programming Tutorials
In summary: At this point you should have learned how to zoom and move in graphs in the R programming language. Let me know in the comments, if you have any additional questions.


