Extract Frequency Counts from Histogram in R (Example)
This article illustrates how to return the frequencies of a histogram in R programming.
Table of contents:
Sound good? Let’s dive right into the example:
Creation of Exemplifying Data
Consider the following example data:
set.seed(5643879)                  # Create example data
x <- rnorm(200)
head(x)                            # Head of example data
# [1] -0.3918119  0.5390608 -0.8903291 -1.1244014  0.6944554  0.4649197
The previous output of the RStudio console shows the structure of our example data – We have created a simple numeric vector containing normally distributed random values.
Example: Get Frequency Counts of Histogram Using hist() Function
In this example, I’ll explain how to extract the frequencies of each bar of a histogram.
For this, we can use the hist function.
If we assign the output of the hist function to a data object, this data object contains a list with different information about our histogram.
Have a look at the following R code and its RStudio console output:
hist_info <- hist(x)               # Extract histogram information
hist_info                          # Print histogram information
# $breaks
#  [1] -3.0 -2.5 -2.0 -1.5 -1.0 -0.5  0.0  0.5  1.0  1.5  2.0  2.5  3.0  3.5
#
# $counts
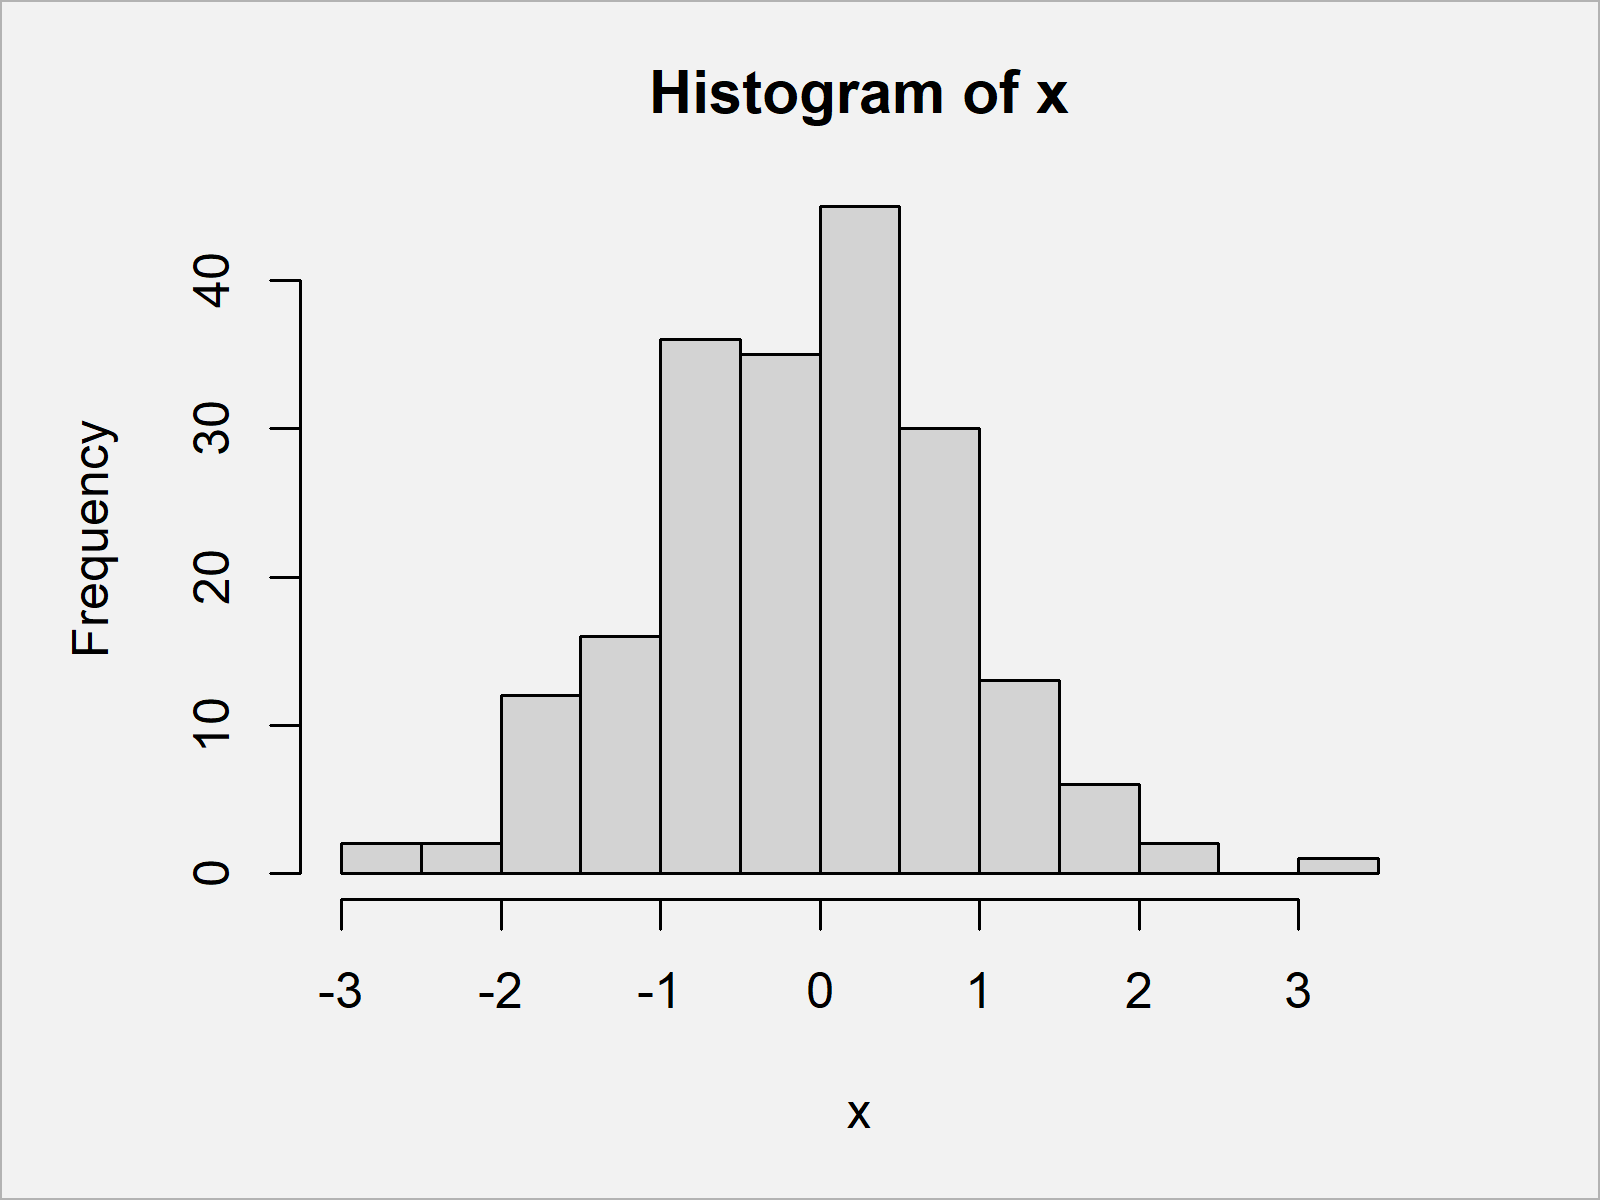
#  [1]  2  2 12 16 36 35 45 30 13  6  2  0  1
#
# $density
#  [1] 0.02 0.02 0.12 0.16 0.36 0.35 0.45 0.30 0.13 0.06 0.02 0.00 0.01
#
# $mids
#  [1] -2.75 -2.25 -1.75 -1.25 -0.75 -0.25  0.25  0.75  1.25  1.75  2.25  2.75  3.25
#
# $xname
# [1] "x"
#
# $equidist
# [1] TRUE
#
# attr(,"class")
# [1] "histogram"
Our list contains different information such as breaks, counts, density values, and so on…
Note that the previous R code also created a histogram:

However, in case you don’t want to see the histogram you may specify plot = FALSE within the hist function.
In case you want to extract only the frequency count values from our histogram, you may use the following R syntax:
hist_counts <- hist_info$counts    # Extract histogram counts
hist_counts                        # Print histogram counts
#  [1]  2  2 12 16 36 35 45 30 13  6  2  0  1
The previous output shows a vector containing the frequency counts of our histogram.
Note that these frequencies depend on the bins of the bars in our histogram. In this example, we have used the default breaks, however, in case we change these default bins the frequency counts change as well.
Video & Further Resources
If you need more information on the contents of this tutorial, I recommend watching the following video which I have published on my YouTube channel. In the video tutorial, I’m showing the R programming syntax of this tutorial in RStudio:
Furthermore, you may want to read the other tutorials on my website. Some interesting articles about histograms and other plots are shown below:
- Add Count & Percentage Labels on Top of Histogram Bars
- Draw Histogram with Percentages Instead of Frequency Counts
- Drawing Plots in R
- All R Programming Tutorials
In this tutorial, I have shown how to extract the frequency counts of all histogram bars using the hist() function in the R programming language. Let me know in the comments, in case you have further questions.


