What is Explained Variance in PCA? (Examples)
This article elaborate explained variance in principal component analysis (PCA) and general context. The article contains the following topics:
Let’s get started!
What is Explained Variance?
What is Variance?
In statistics, variance gives us an idea of how much individual data points differ from the average. In other words, it’s a measure of data variability.
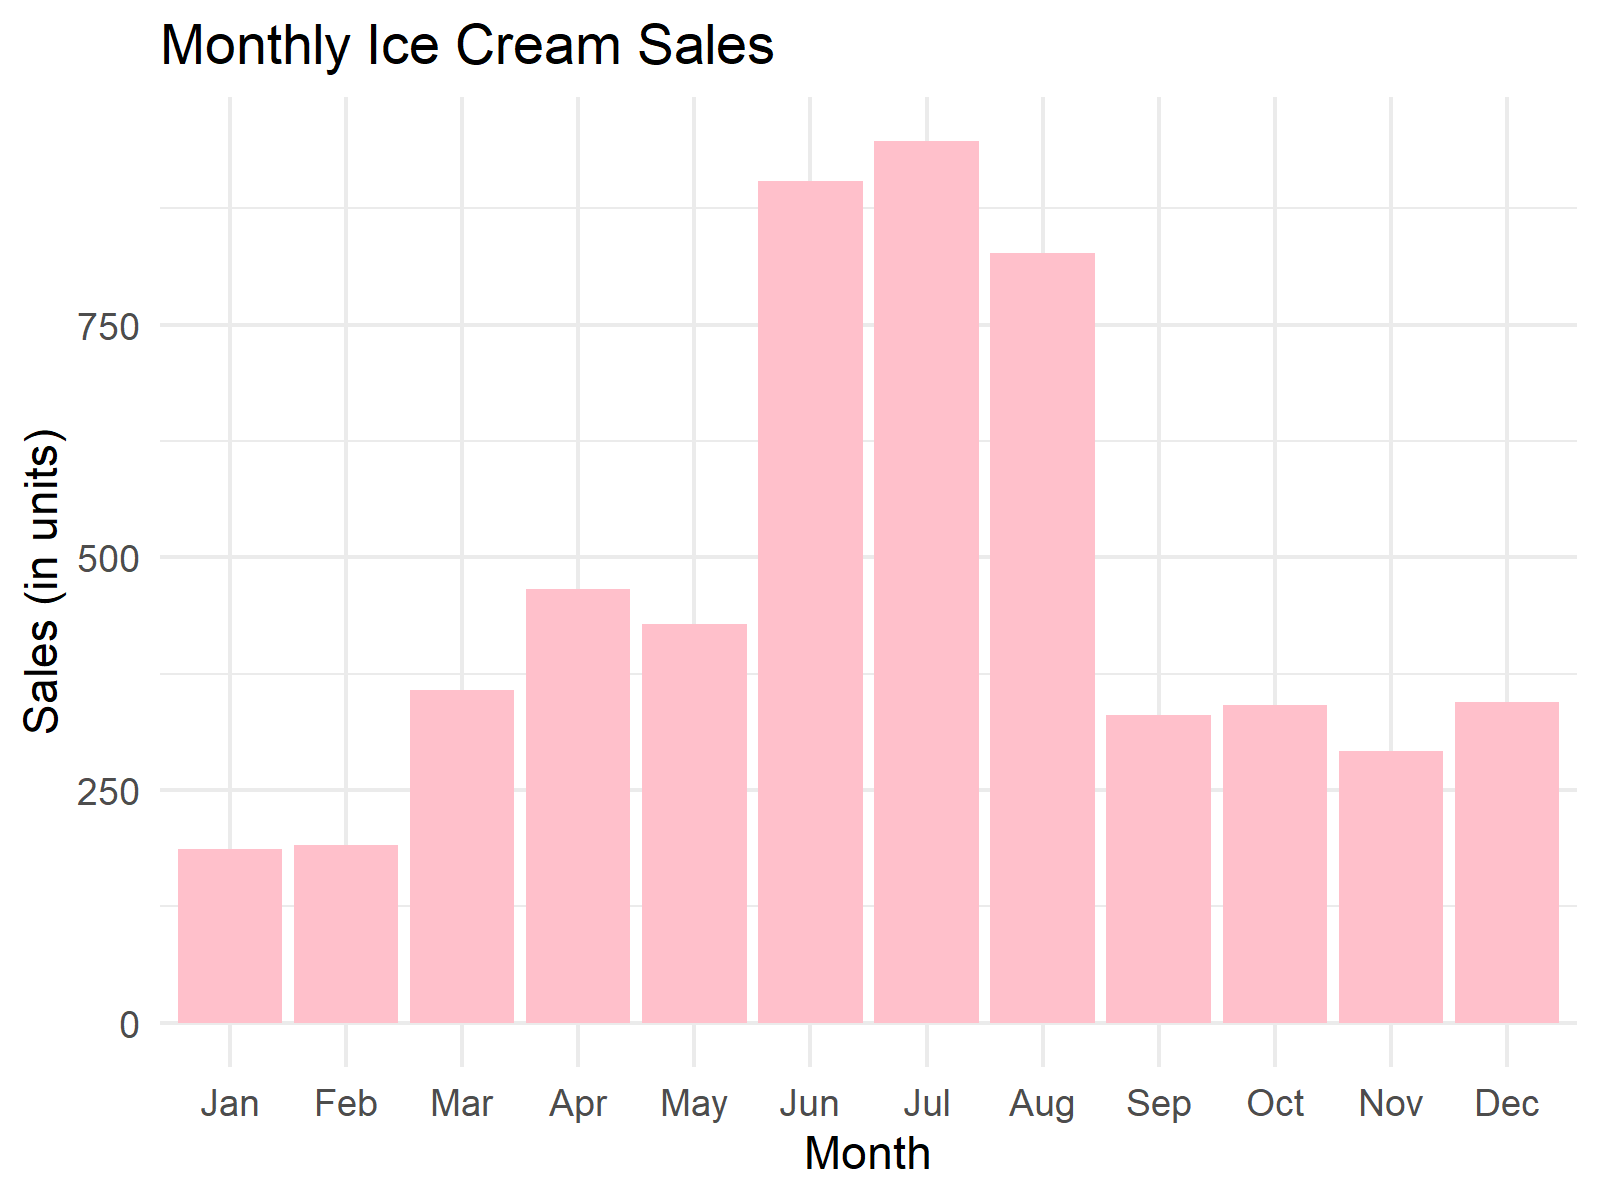
For instance, if we’re looking at monthly ice cream sales, the variance would tell us about the variability in sales over time.

What is Explained Variance?
When we say we’re trying to explain the variance, we mean that we’re trying to understand the reasons behind this variability. Why did ice cream sales go up in June but drop in September? What factors can describe or predict these changes? If we can identify and measure these factors, we’re on our way to explaining the variance.
Why do We Need It?
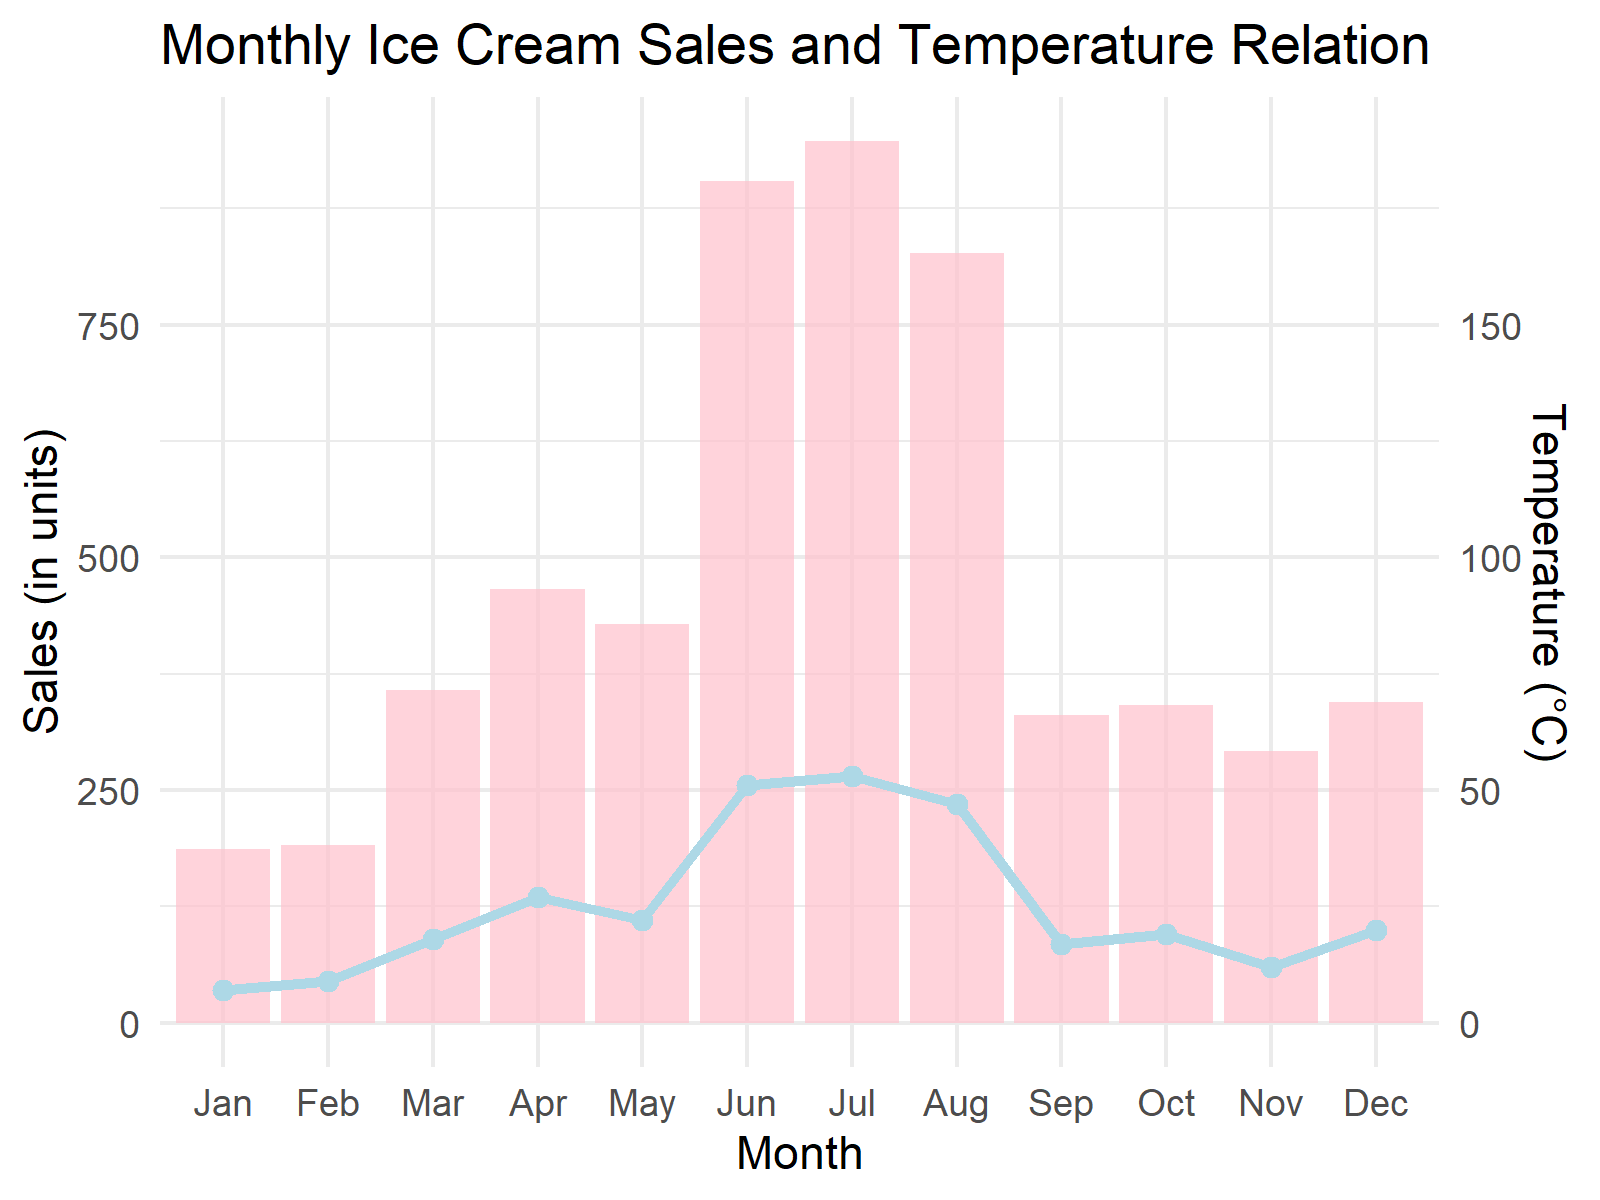
Understanding the reasons behind data variability helps us make predictions, decisions, and interpret data more meaningfully. If a factor/variable, like temperature, can explain a significant portion of the variability in our data, like ice cream sales, it’s probably an important one to consider.
Example
If we find out that temperature fluctuations explain most of the variance in ice cream sales, we have a strong clue that temperature is a key driver behind sales changes.

Now that we’ve understood the basics of explained variance using everyday examples, let’s see how this idea fits into the technique called Principal Component Analysis (PCA).
Explained Variance in PCA Context
What is PCA and How Does Explained Variance Come In?
PCA is a dimensionality reduction technique. It identifies new variables, known as principal components, which are designed to capture significant amounts of variance in the data. Consequently, PCA can distill the data features into fewer components that still capture the essence of the data.
For more in depth explanation, see What is Principal Component Analysis?
Why is This Useful in PCA?
Knowing the explained variance per component helps deciding how many principal components to retain. If a few components capture most of the variance, you can decide to retain only these components, simplifying your data analysis without sacrificing much information.
Example
Imagine you’re analyzing data from multiple ice cream stores, considering eight features, like store size and location type.
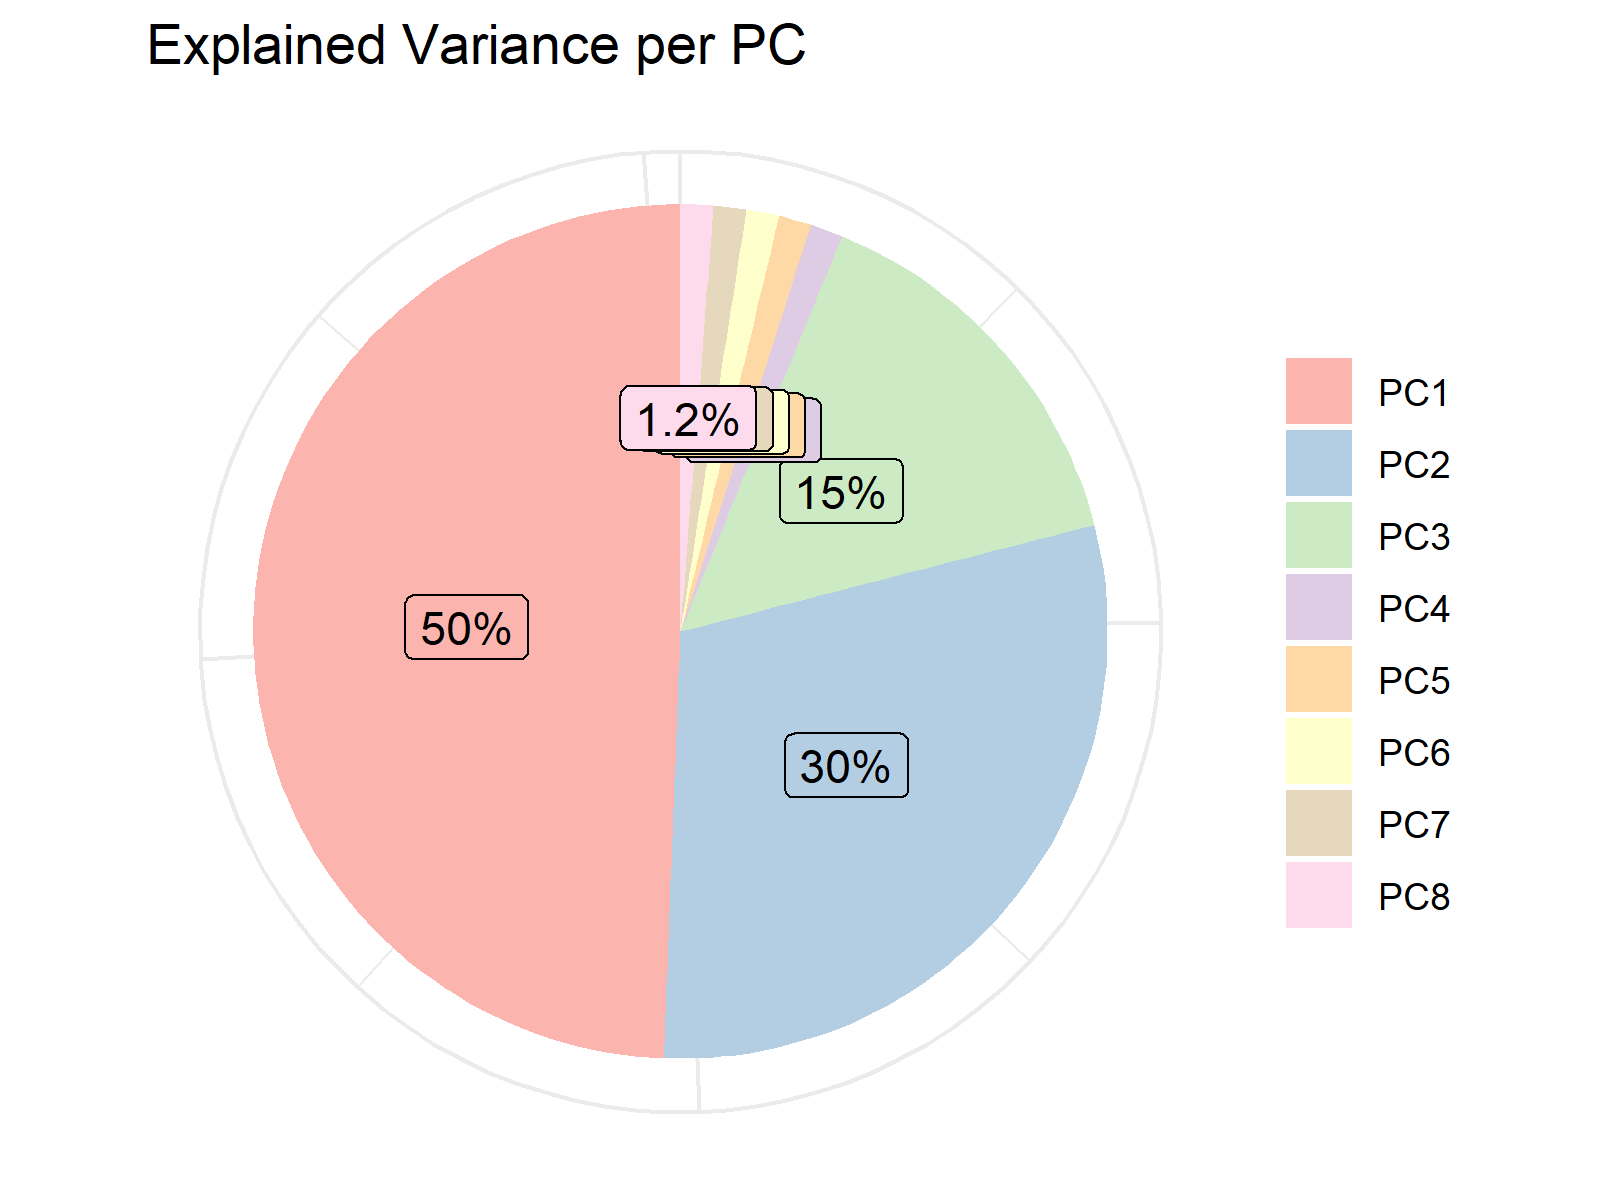
After running PCA on our ice cream store data, you find:
- PC1 explains 50% of variance.
- PC2 explains 30% of variance.
- PC3 explains 15% of variance.
- The remaining components together explain 5% of variance.
Based on this result, PC1, PC2, and PC3 capture 95% of the variance. This means that we can condense the eight features into three components.

Sweet Conclusion🍦
Variance provides insights into the dispersion and variability in our data. By trying to explain this variance, we aim to uncover the underlying reasons for these changes.
Whether it’s the general context or PCA, explained variance serves as a guide to identify and understand the key factors in our data’s narrative.
Video & Further Resources
Have a look at the following video on the Statistics Globe YouTube channel. In the video, I’m explaining the topics of this tutorial in a video tutorial.
Also, you might have a look at the related articles on my website.
- What is Principal Component Analysis?
- Choose Optimal Number of Components for PCA
- Scree Plot for PCA Explained
- Advantages & Disadvantages of Principal Component Analysis
Summary: In this article, you have dived into concept of explained variance. We saw how it plays a crucial role in deciding the number of components to reduce. If you want to learn about the following step: interpretation of principal components, I recommend you to visit Biplot for PCA Explained.
This page was created in collaboration with Cansu Kebabci. Have a look at Cansu’s author page to get more information about her professional background, a list of all his tutorials, as well as an overview on her other tasks on Statistics Globe.


