Table by Group in R (Example)
In this R programming tutorial you’ll learn how to make a table by group.
Table of contents:
Let’s take a look at some R codes in action:
Creation of Example Data
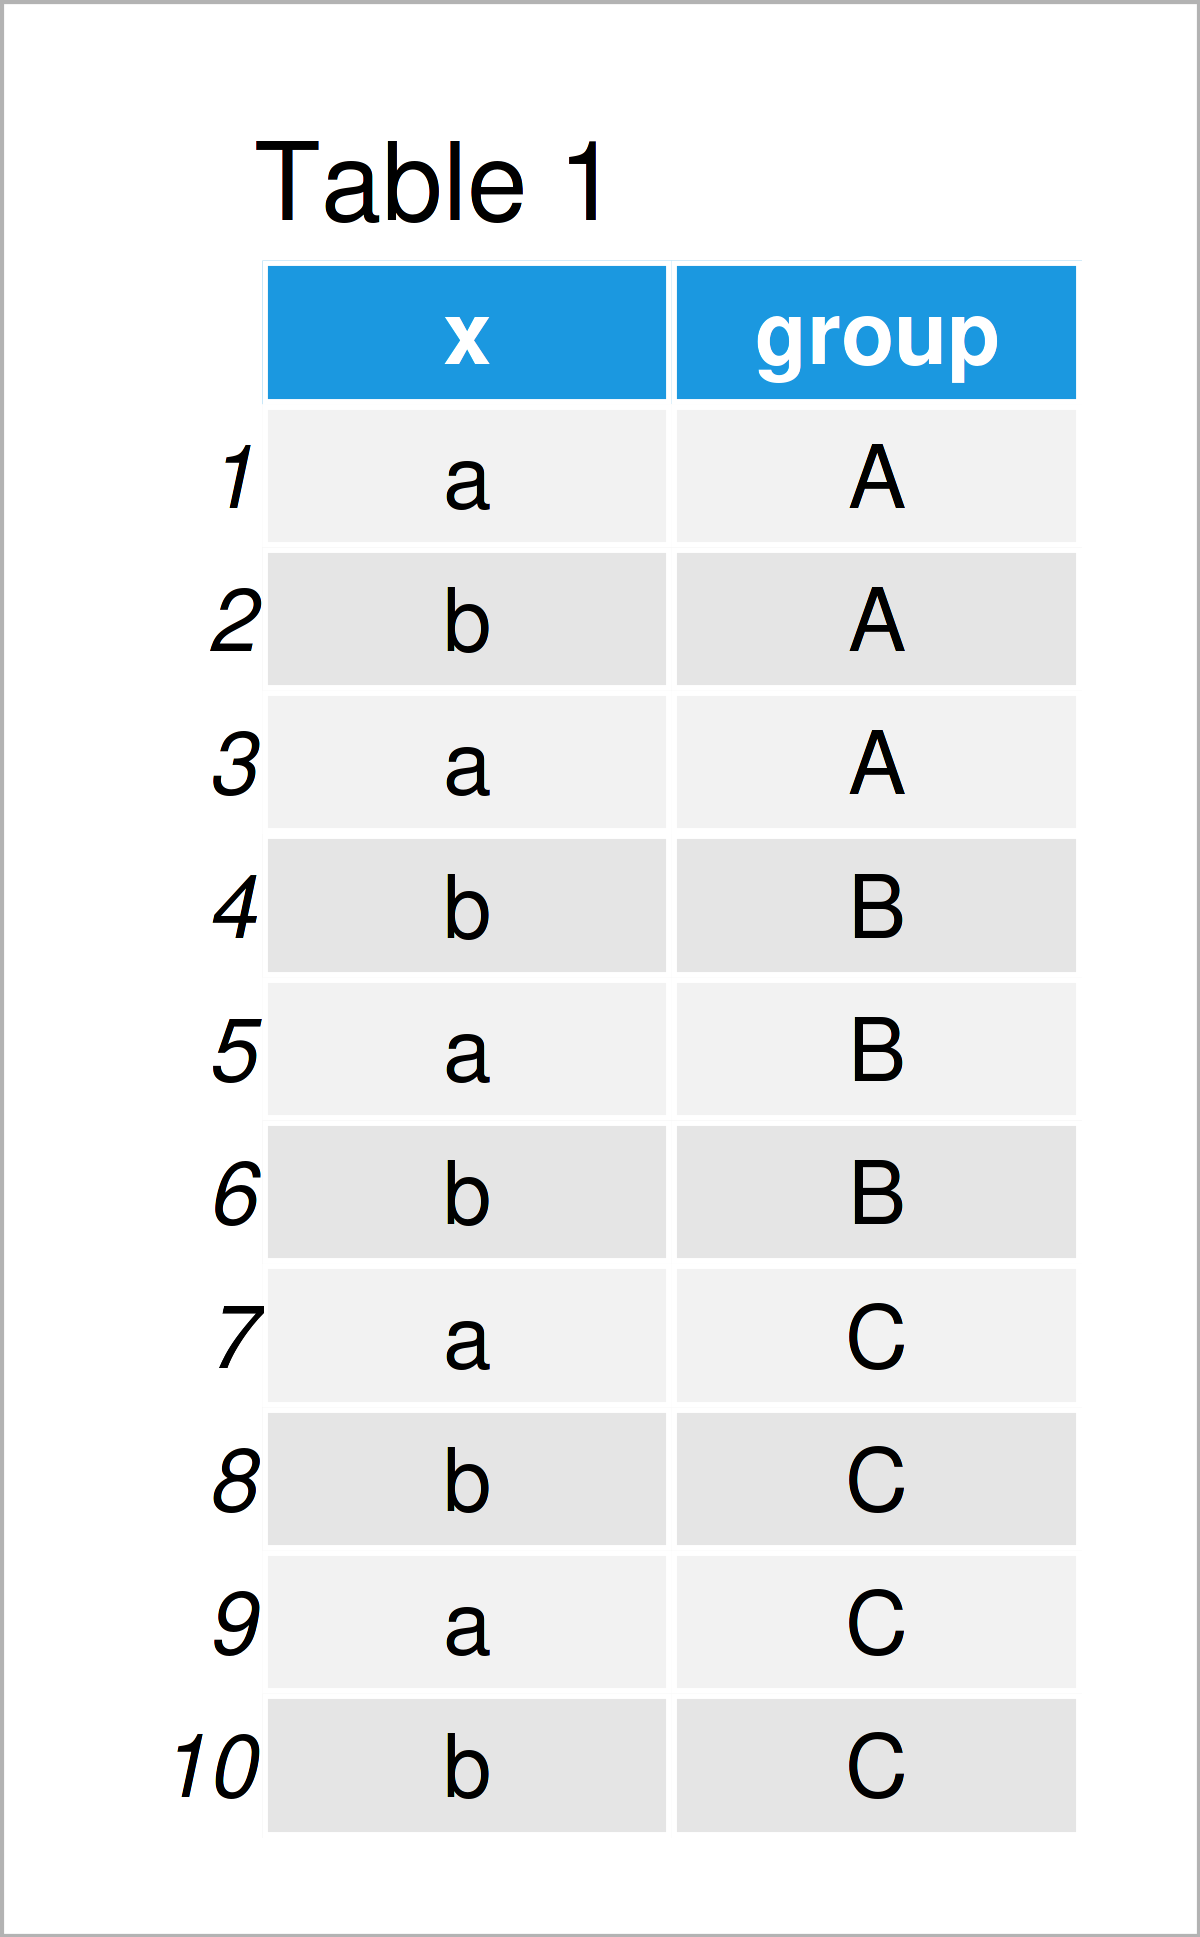
I’ll use the following data as basement for this R programming tutorial:
data <- data.frame(x = letters[1:2],           # Create example data frame
                   group = c(rep(LETTERS[1:3], each = 3), "C"))
data                                           # Print example data frame

Have a look at the table that has been returned after running the previous R programming syntax. It visualizes that our example data consists of ten lines and two columns.
Example: Make a Table by Group Using the table() Function
In this example, I’ll show how to create a table object by group using the table() function.
Let’s first illustrate how to apply the table function without groupings:
tab_no_group <- table(data$x)                  # Create table without groups
tab_no_group                                   # Print table without groups
# a b
# 5 5
As you can see in the previous output of the RStudio console, we have created a table object called table_no_group by executing the previous R code. This table shows the frequency counts of the elements in the column “x”.
If we want to create such a table object by our grouping variable “group”, we have to specify this variable within the table function as well:
tab_with_group <- table(data$group, data$x)    # Create table with groups
tab_with_group                                 # Print table with groups
#
#     a b
#   A 2 1
#   B 1 2
#   C 2 2
The previous output shows our final result: A table by group.
In this example, I have explained how to make a table with frequency counts by group. However, we could apply a similar syntax to create a table with other summary statistics or with probabilities and percentages instead of counts.
Video & Further Resources
Do you need more explanations on the R codes of this tutorial? Then I recommend having a look at the following video on my YouTube channel. I’m explaining the R programming code of this tutorial in the video instruction:
In addition, you could read the other tutorials on my website. Some articles that are related to the construction of a table by groups can be found below:
- Compute Summary Statistics by Group
- Calculate Multiple Descriptive Statistics by Group in One Call
- Calculate Percentage by Group
- Summarize Multiple Columns of data.table by Group
- All R Programming Examples
In this article you have learned how to create a table with groups in the R programming language. In case you have additional questions, please let me know in the comments section.


