ecdf in R (Example) | Compute & Plot the Empirical Cumulative Distribution Function
This tutorial shows how to compute and plot an Empirical Cumulative Distribution Function (ECDF) in the R programming language.
The article is mainly based on the ecdf() R function. So let’s have a look at the basic R syntax and the definition of the ecdf command first:
Basic R Syntax of ecdf():
ecdf(x)
Definition of ecdf():
The ecdf function computes the Empirical Cumulative Distribution Function of a numeric input vector.
In the following article, I’ll show an example code on how to use the ecdf function and on how to plot the output of this function in R.
Let’s move on to the example!
Example: Compute and Plot ECDF in R
Before we can start with the example, we need to create a numeric example vector in R:
set.seed(19191)     # Set seed for reproducibility
x <- rnorm(50)      # Normal distribution with 50 values
Now, we can apply the ecdf R function in order to calculate the ECDF values of our example data:
ecdf(x)             # Compute ecdf values
# Empirical CDF
# Call: ecdf(x)
# x[1:50] = -2.5138, -2.0871, -1.8105,  ...,  2.033, 2.2279
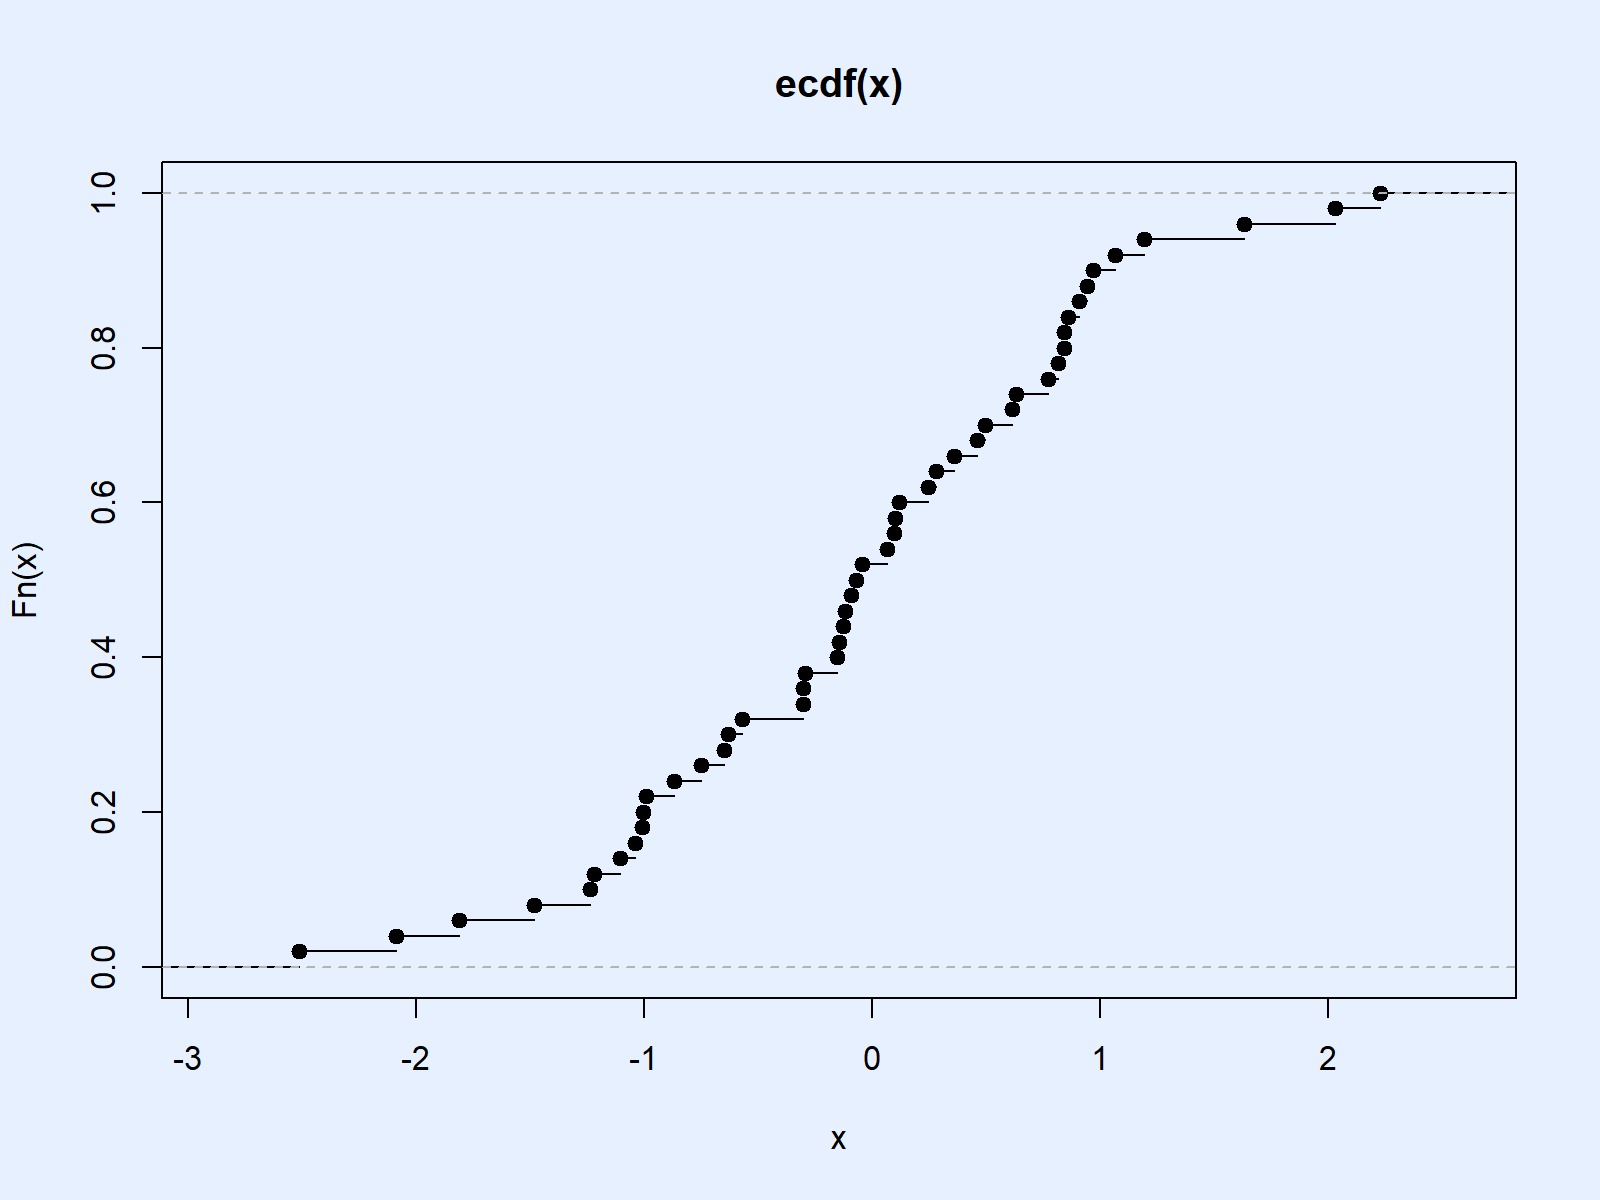
The RStudio output of the ecdf function is not really helpful, but however, we can also use this output to plot the ECDF:
plot(ecdf(x)) # Create ecdf plot in R

Table 1: The Empirical Cumulative Distribution Function in R.
That’s the R programming part. Now you can start to interpret this graphic…
Video, Further Resources & Summary
If there are any questions left concerning the topic of this article, please check out the video below where I explain the content in detail:
If you want to learn more about the statistical research concept of the ECDF, you could have a look at the following YouTube tutorial of the Data Talks channel. The speaker explains how to draw statistical inference from empirical distributions:
If you want to learn more about R programming in general, I can recommend to have a look at the other R tutorials on my website. Some interesting tutorials can be found below:
- Compute Quantiles (Quartile, Decile, Percentile etc.) in R
- Normal Distribution in R
- R Functions List (+ Examples)
- The R Programming Language
At this point, I hope you know how to compute the Empirical CDF in R. However, if you have any comments or questions, don’t hesitate to let me know. Also, don’t forget to subscribe to the Statistics Globe Email Newsletter below.


