Calculate Price Return in R (2 Examples)
In this tutorial, I’ll show how to calculate the return of prices in the R programming language.
The post consists of the following content:
Let’s dive into it:
Introducing Example Data
The first step is to create some data that we can use in the examples later on:
my_prices <- c(57, 63, 71, 68, 75, 71, 79)                       # Create example vector
my_prices                                                        # Print example vector
# [1] 57 63 71 68 75 71 79
The previous output of the RStudio console shows that our example data is a numeric vector containing seven elements. For the sake of this tutorial, we’ll assume that these values are prices.
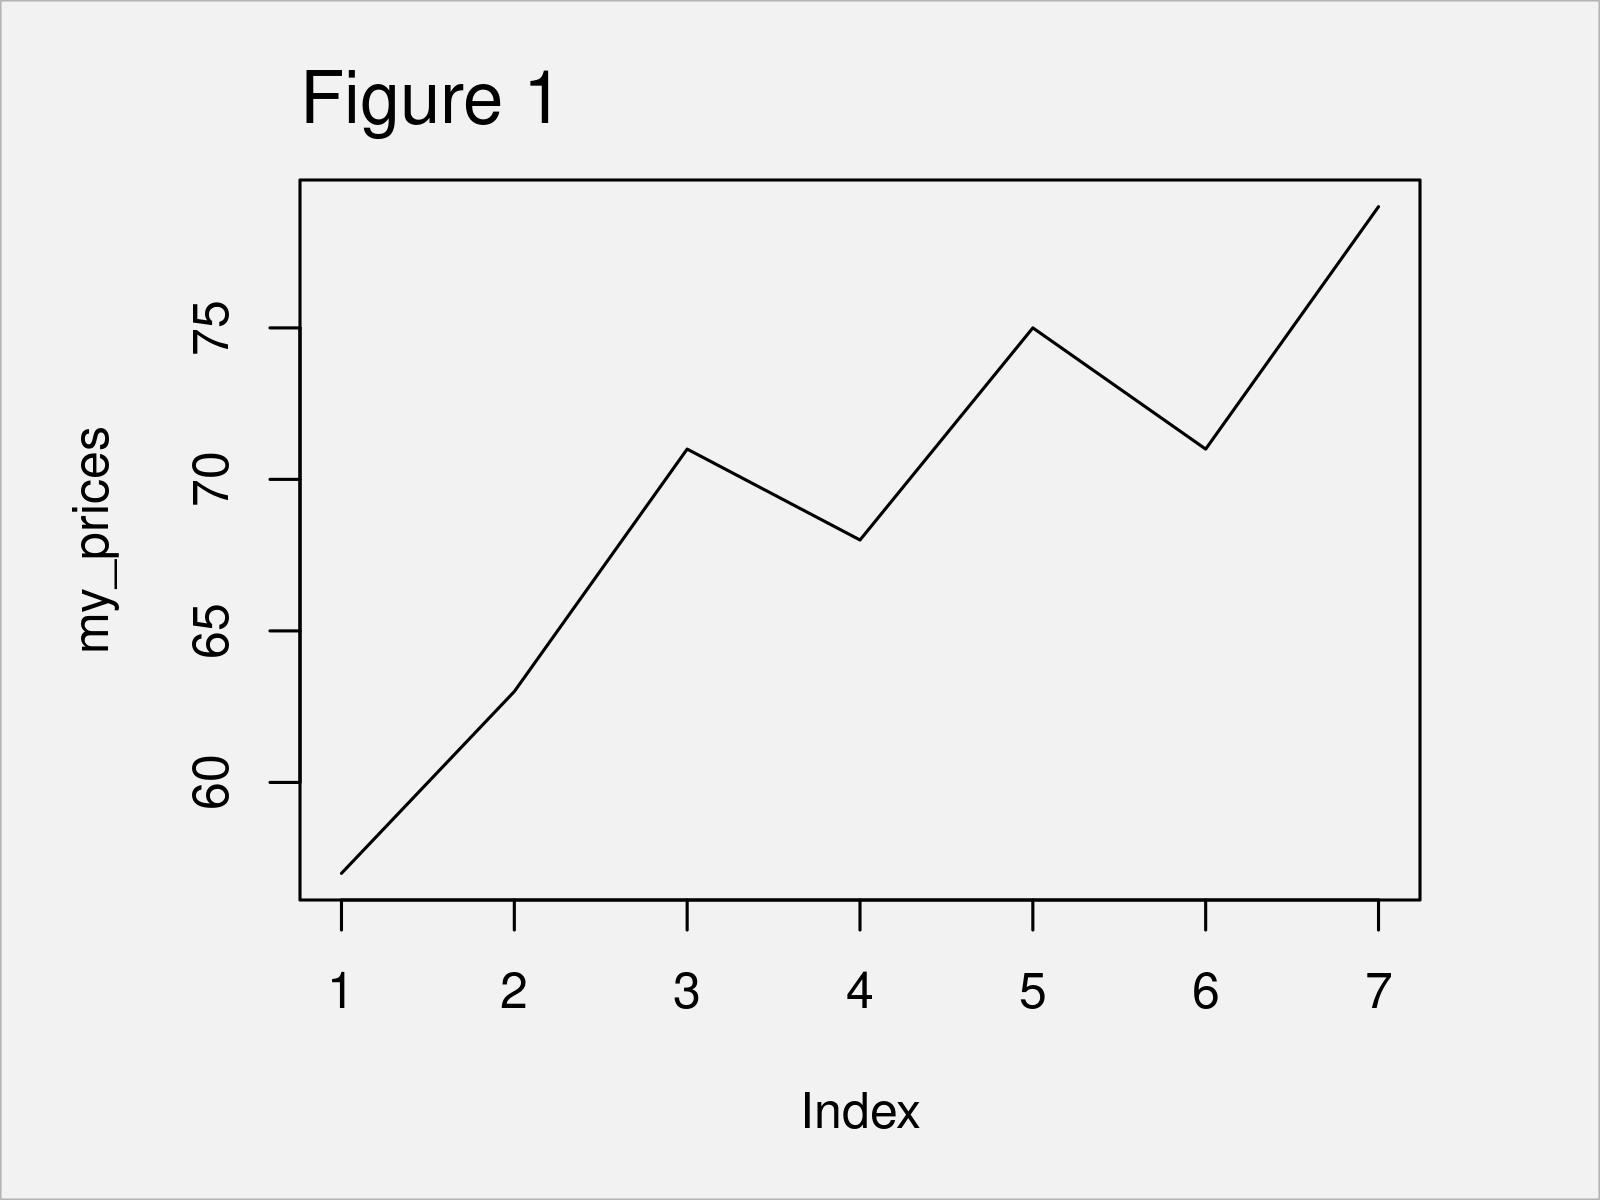
As a next step, we can plot these data points in a line plot to visualize our prices:
plot(my_prices, type = "l") # Draw data

The output of the previous code is shown in Figure 1 – A line plot showing the development of our prices.
In the following examples, I’ll explain how to calculate the price returns of these prices.
Example 1: Compute Price Returns Using diff() & length() Functions
In Example 1, I’ll demonstrate how to use the basic installation of the R programming language to calculate price returns.
For this, we can apply the diff and length functions as shown below:
vec_return1 <- diff(my_prices) / my_prices[- length(my_prices)]  # Calculate returns
vec_return1                                                      # Print returns
# [1]  0.10526316  0.12698413 -0.04225352  0.10294118 -0.05333333  0.11267606
The previous output of the RStudio console shows the price returns corresponding to our input vector of prices.
Example 2: Compute Price Returns Using Delt() Function of quantmod Package
Alternatively to the Base R functions shown in Example 1, we can also use the Delt function of the quantmod package to compute price returns.
We first need to install and load the quantmod package, in order to use the corresponding functions:
install.packages("quantmod")                                     # Install quantmod package
library("quantmod")                                              # Load quantmod
Next, we can apply the Delt function as shown below:
vec_return2 <- Delt(my_prices)                                   # Calculate returns
vec_return2                                                      # Print returns
#      Delt.1.arithmetic
# [1,]                NA
# [2,]        0.10526316
# [3,]        0.12698413
# [4,]       -0.04225352
# [5,]        0.10294118
# [6,]       -0.05333333
# [7,]        0.11267606
As you can see, the Delt function has returned a matrix containing the same price return values as Example 1. However, the Delt function provides additional arguments that can be used to modify our calculation.
In this example, we have used the Delt function to calculate the percent change from one period to another of a given series. Alternatively, we could use the Delt function to compute the percent difference between two series over a full series. Furthermore, the type argument of the Delt function enables the user to specify log or arithmetic calculations.
You may have a look at the help documentation of the Delt function for more details.
Video & Further Resources
Some time ago I have published a video on my YouTube channel, which demonstrates the content of this article. You can find the video below.
Furthermore, you might want to read the related R programming articles that I have published on this homepage. Some articles are shown below:
- diff Function in R
- Calculate Moving Average, Maximum, Median & Sum of Time Series
- All R Programming Tutorials
At this point you should have learned how to calculate the return of a vector of prices (e.g. stock returns) in the R programming language. Let me know in the comments section, if you have any additional questions.


