Calculate Percentage by Group in R (2 Examples)
In this article, I’ll demonstrate how to get the percentage by group in R programming.
The post will consist of this:
Here’s the step-by-step process…
Creating Example Data
Have a look at the following example data:
data <- data.frame(group = rep(LETTERS[1:3], each = 4),  # Create example data
                   subgroup = letters[1:4],
                   value = 1:12)
data                                                     # Print example data

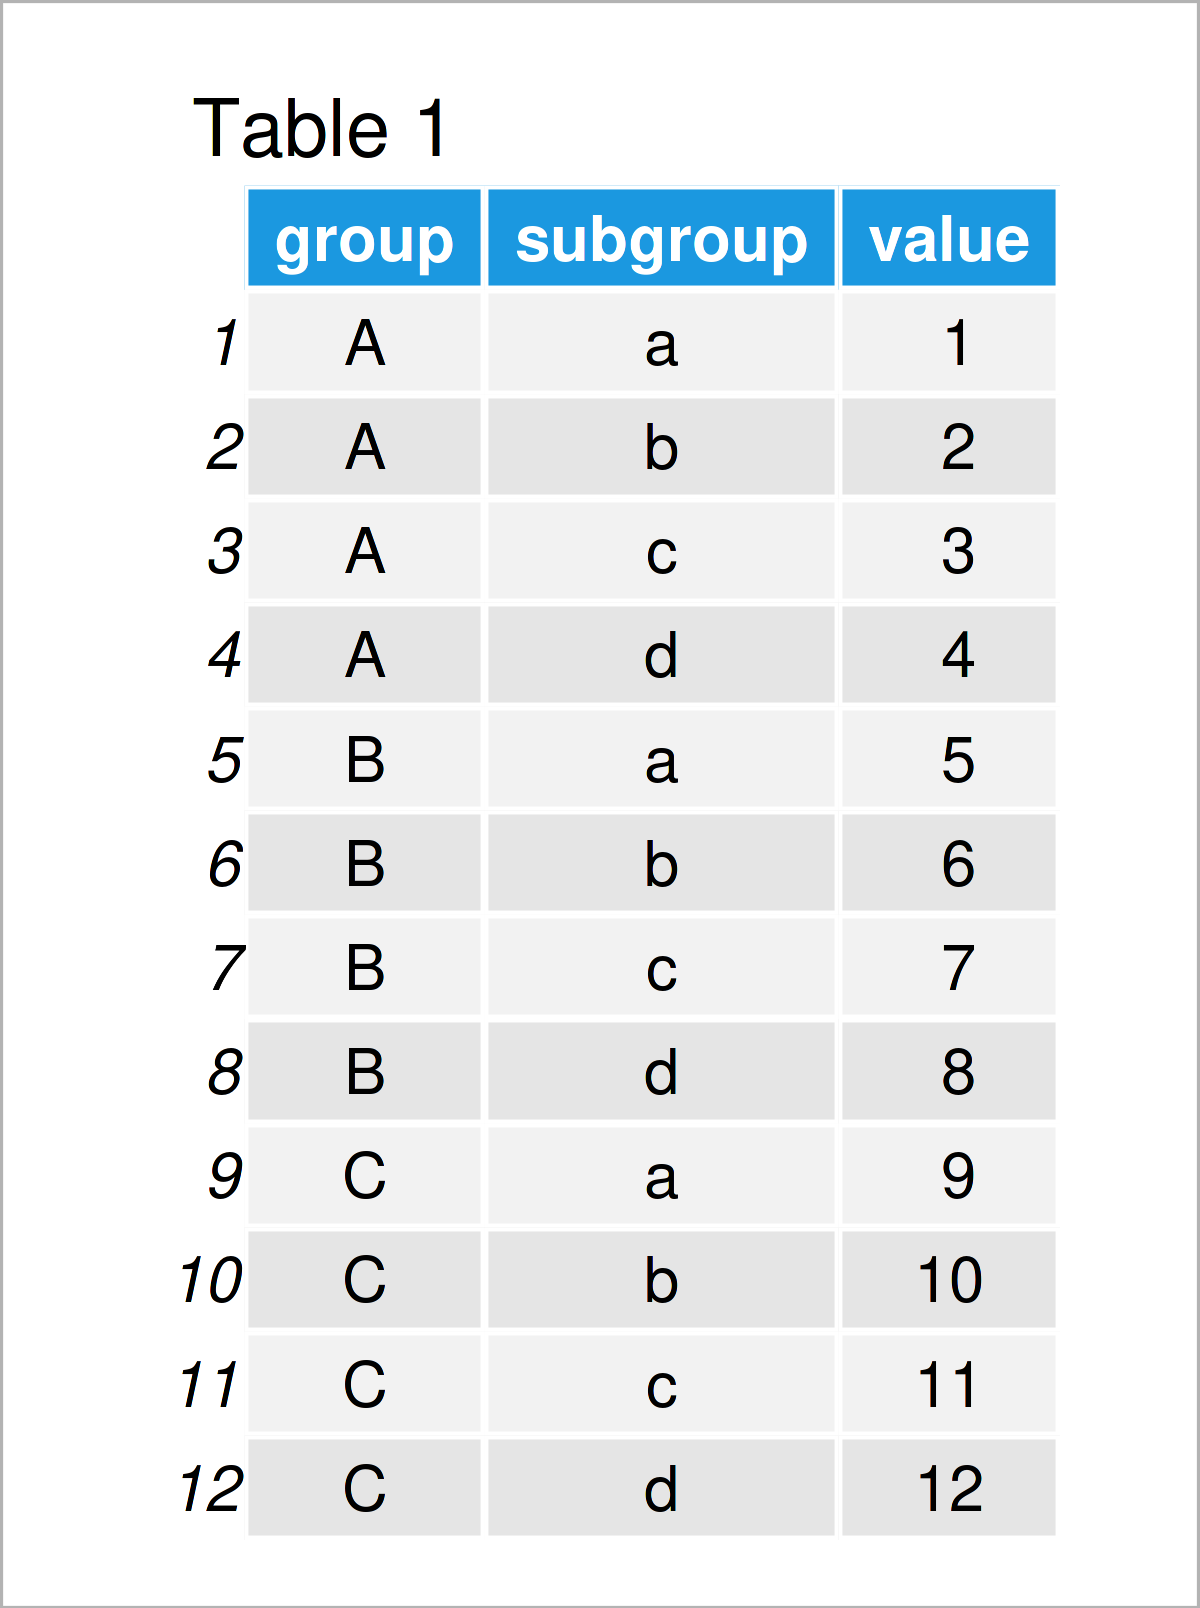
As you can see based on Table 1, our example data is a data frame containing twelve rows and three columns called “group”, “subgroup”, and “value”.
Example 1: Calculate Percentage by Group Using transform() Function
In Example 1, I’ll show how to compute the percentage by group using the transform function provided by the basic installation of R programming.
Have a look at the following R code:
data_new1 <- transform(data,                             # Calculate percentage by group
                       perc = ave(value,
                                  group,
                                  FUN = prop.table))
data_new1                                                # Print updated data

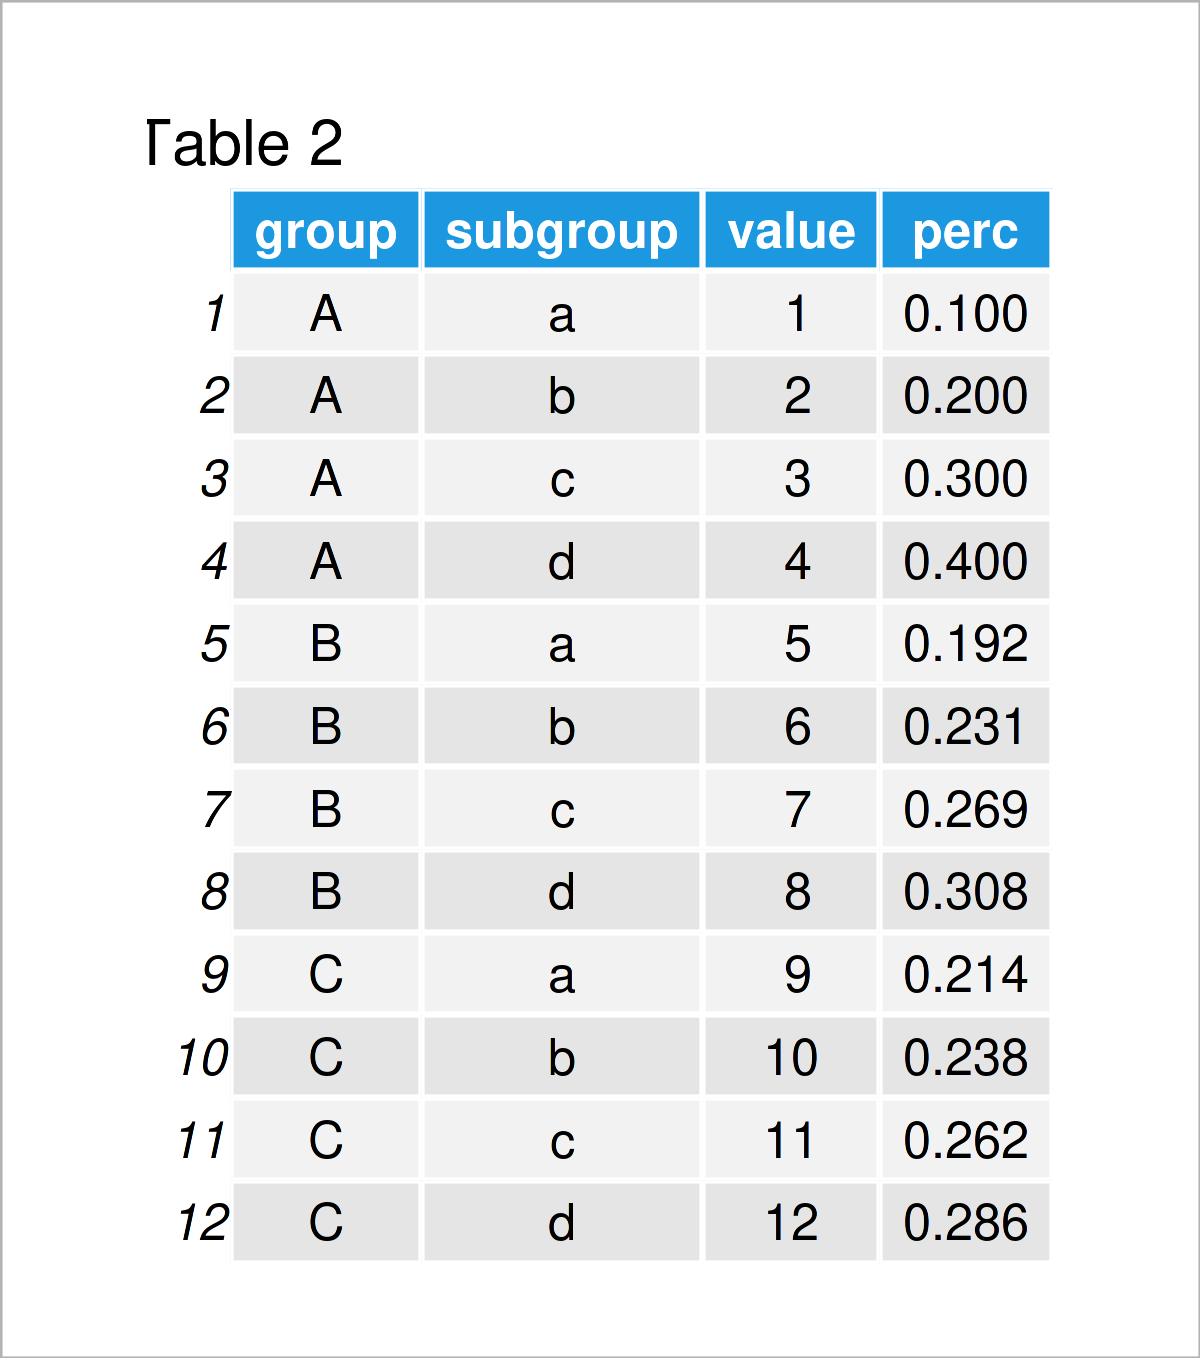
As shown in Table 2, we have created a new data frame with a new column called perc. This column contains the percentages for each subgroup based on the value column.
Example 2: Calculate Percentage by Group Using group_by() & mutate() Functions of dplyr Package
Alternatively to Base R (as shown in Example 1), we can also use the functions of the dplyr package to calculate the percentages for each group.
To be able to use the functions of the dplyr package, we first need to install and load dplyr:
install.packages("dplyr")                                # Install & load dplyr package
library("dplyr")
Next, we can apply the group_by, mutate, and sum functions to create a new data frame variable containing the percentages by group:
data_new2 <- data %>%                                    # Calculate percentage by group
  group_by(group) %>%
  mutate(perc = value / sum(value)) %>%
  as.data.frame()
data_new2                                                # Print updated data
The previous R code has created the same output as in Example 1. However, this time we have used the functions of the dplyr package.
Video, Further Resources & Summary
I have recently released a video on my YouTube channel, which illustrates the R programming codes of this article. You can find the video below.
In addition, you may want to have a look at the other articles on this website.
- Select Top N Highest Values by Group
- Count Unique Values by Group in R
- Compute Summary Statistics by Group
- Count Number of Rows by Group Using dplyr Package
- R Programming Language
In summary: You have learned in this tutorial how to calculate the percentage by group in R. In case you have additional questions, let me know in the comments section.


8 Comments. Leave new
I need to go look for an answer on this, but as I’ve been learning R over the last year, I’ll see how people used to do something before the tidyverse came along, doing something with {base} R. I’ve been learning to do R with the tidyverse primarily, but I see here (and elsewhere) examples with both, and I wonder if there’s situations or why I would go and do something the way it is done in {base} R rather than tidyverse. It’s good to know both ways (knowledge is power), but if I never learn the {base} R version, is that okay?
Hey Scott,
In my opinion, using Base R vs. tidyverse is often a matter of taste. As long as you don’t experience any limitations of using tidyverse exclusively, I don’t see why you shouldn’t continue like that.
Regards,
Joachim
Hi Joachim,
Thanks for the examples.
I am trying to do something similar with my data, I tried your dplyr code and looks like it’s not working the way it should. if you run “sum(data_new2$perc)”, the result should be 3, and it is 1.
Hey,
The present tutorial shows how to calculate the percentages within each group. Since we have three groups in our data, the sum of all percentages is equal to 3.
What exactly do you want to calculate in your data?
Regards,
Joachim
No worries,
Your “transform” code “data_new1” works fine.
The “dplyr” code “data_new2” is doing the wrong thing. (I went directly to dplyr the first time)
Thanks again!
Cheers!!!
Hi again,
Thanks for the follow-up comment.
I’m not sure what you mean with “wrong thing”, the dplyr code returns exactly the same output as the Base R code. Anyway, I’m glad you found a solution!! 🙂
Regards,
Joachim
Dear Joachim,
as AG I also jumped directly to the dplyr part, but I found the same result. The percentages actually are not correct. Im still trying to figure out where the problem lies, but the results are definitly not correct.
BR
Manuel
Hello Manuel,
Could you please share your code? Also, you can run your code for the given sample in the tutorial and compare the result given and yours. Also, what do you mean by “founding the same results”?
Regards,
Cansu