Split Image into Raster Grid in R (Example)
In this R tutorial you’ll learn how to divide an image file into a raster.
Table of contents:
You’re here for the answer, so let’s get straight to the exemplifying R syntax:
Example Data, Packages & Default Graph
First, we’ll have to create some example data:
set.seed(85658)                          # Create example data
data <- data.frame(x = rnorm(1000),
                   y = rnorm(1000))
head(data)                               # Head of example data
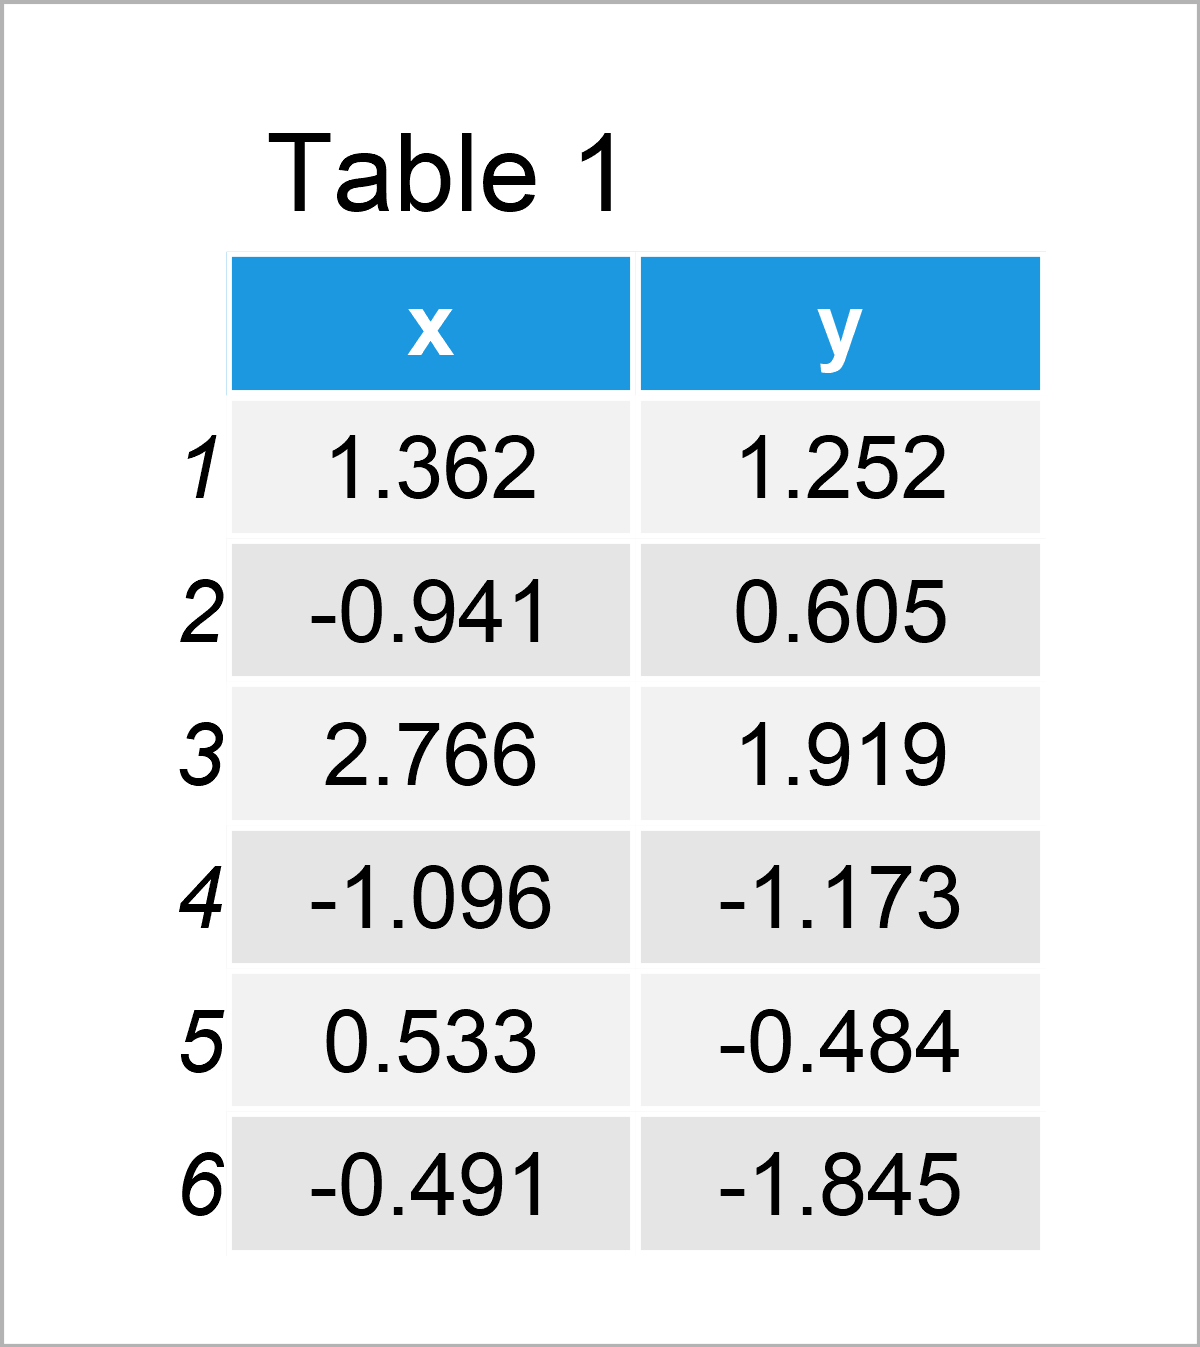
The previous table shows that our example data consists of two numerical variables.
Next, let’s create a ggplot2 plot of these data. For this, we need to install and load the ggplot2 package:
install.packages("ggplot2")              # Install & load ggplot2 package
library("ggplot2")
Furthermore, we have to set the working directory to which we want to write our graphic as an image file:
setwd("C:/Users/Joach/Desktop/my_directory/")
Now, we can draw and export our plot to a PNG file in our working directory as shown below:
png("my_image.png")                      # Export example image

ggplot(data, aes(x, y)) +
  geom_point()

dev.off()
After executing the previous code, our working directory contains a ggplot2 scatterplot looking like this:
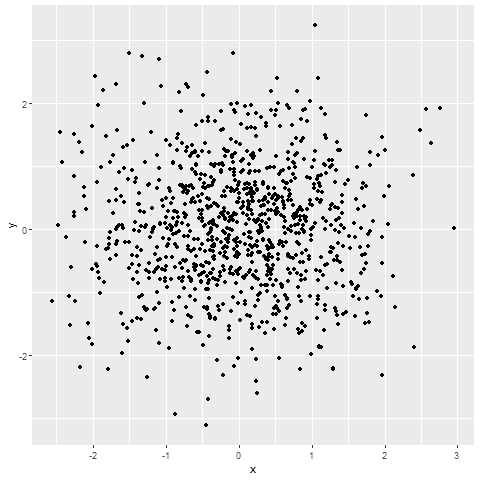
In the following example, I’ll explain how to divide this image into a raster grid, and how to draw certain parts of this grid in new graphs.
Let’s do this!
Example: Split Image into Raster Grid Using magick Package
The following syntax demonstrates how to split an image file into a grid using the R programming language.
For this task, we will use the magick package. To be able to use the functions of the magick software package, we first need to install and load magick to R:
install.packages("magick")               # Install magick package
library("magick")                        # Load magick
In the next step, we can apply the image_read function to import our example PNG file into R:
my_image <- image_read("my_image.png") # Load image
Next, we can use the as.raster function to convert this image file to a raster object:
my_raster <- as.raster(my_image) # Convert image to raster object
If we want to split this raster object into separate parts, we have to know the dimensions of the raster object. To get this, we can use the dim function as shown below:
dim(my_raster)                           # Dimensions of raster
# [1] 480 480
As you can see, the dimensions of our raster object are 480 x 480.
We’re now able to export certain parts of our raster object to new PNG files on our computer.
For this, we may apply the png function as shown in the following R code.
Note that we are also avoiding additional space around the new graphics by setting the plot options using the the par function and the mar argument.
png("my_image_1.png")                    # Export upper left part

par(mar = c(0, 0, 0, 0))

plot(my_raster[1:240, 1:240])

dev.off()

png("my_image_2.png")                    # Export upper right part

par(mar = c(0, 0, 0, 0))

plot(my_raster[1:240, 241:480])

dev.off()

png("my_image_3.png")                    # Export lower left part

par(mar = c(0, 0, 0, 0))

plot(my_raster[241:480, 1:240])

dev.off()

png("my_image_4.png")                    # Export lower right part

par(mar = c(0, 0, 0, 0))

plot(my_raster[241:480, 241:480])

dev.off()
After executing the previous R syntax, our working directory contains four new files that look like this:
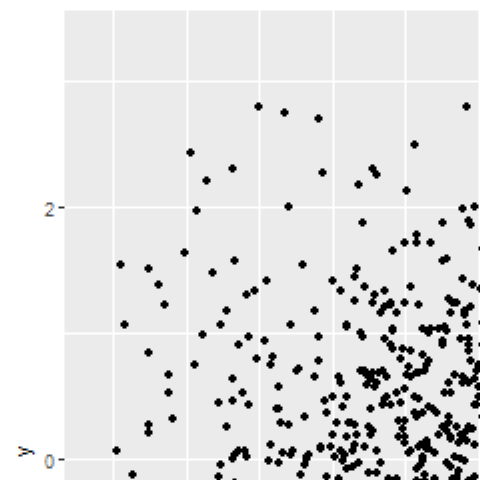
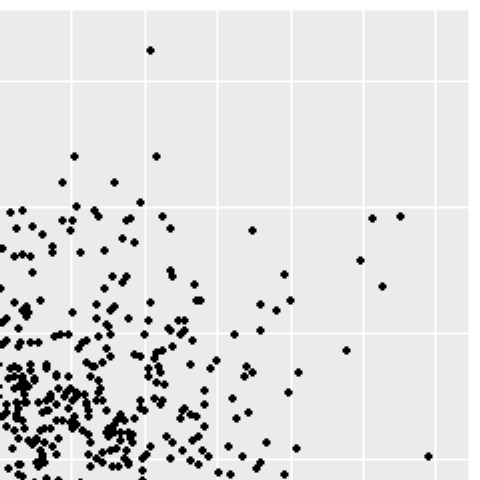
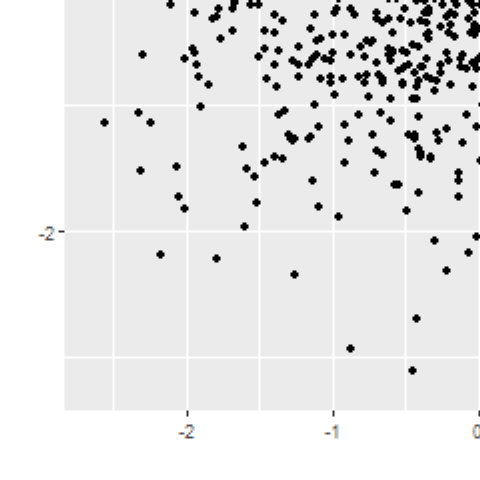
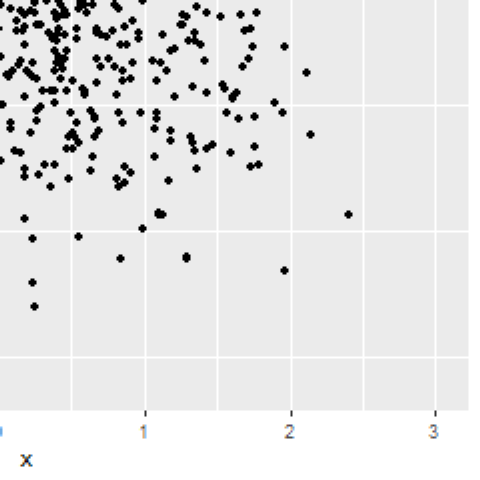
As you can see, we have created one file for the upper left, upper right, lower left, and lower right part of our graphic.
Video & Further Resources
Do you need further explanations on image processing and the examples of this tutorial? Then I recommend watching the following video on my YouTube channel. I illustrate the R code of this article in the video:
Furthermore, you might want to have a look at the other articles that I have published on Statistics Globe. You can find a selection of articles below.
- Insert PNG Image Between Certain ggplot2 Axis Positions
- Add Image to Plot in R
- Split Vector into Chunks in R
- Split Data Frame into Custom Bins in R
- R Programming Examples
In summary: At this point you should have learned how to split an image file into multiple files in a raster grid in the R programming language. In case you have additional questions or comments, please tell me about it in the comments.


