Reduce Space Around Plot in R (Examples)
This article shows how to set the area margins of graphics in the basic installation of R.
The page contains two examples for the reduction of space around plots. More precisely, the content of the post is structured as follows:
You’re here for the answer, so let’s get straight to the examples:
Example 1: Set Area Margins of Plot
In Example 1, I’ll show how to remove white space around a Base R plot.
For comparison, let’s first create a graph with default specifications:
plot(1:10) # Draw plot with default space

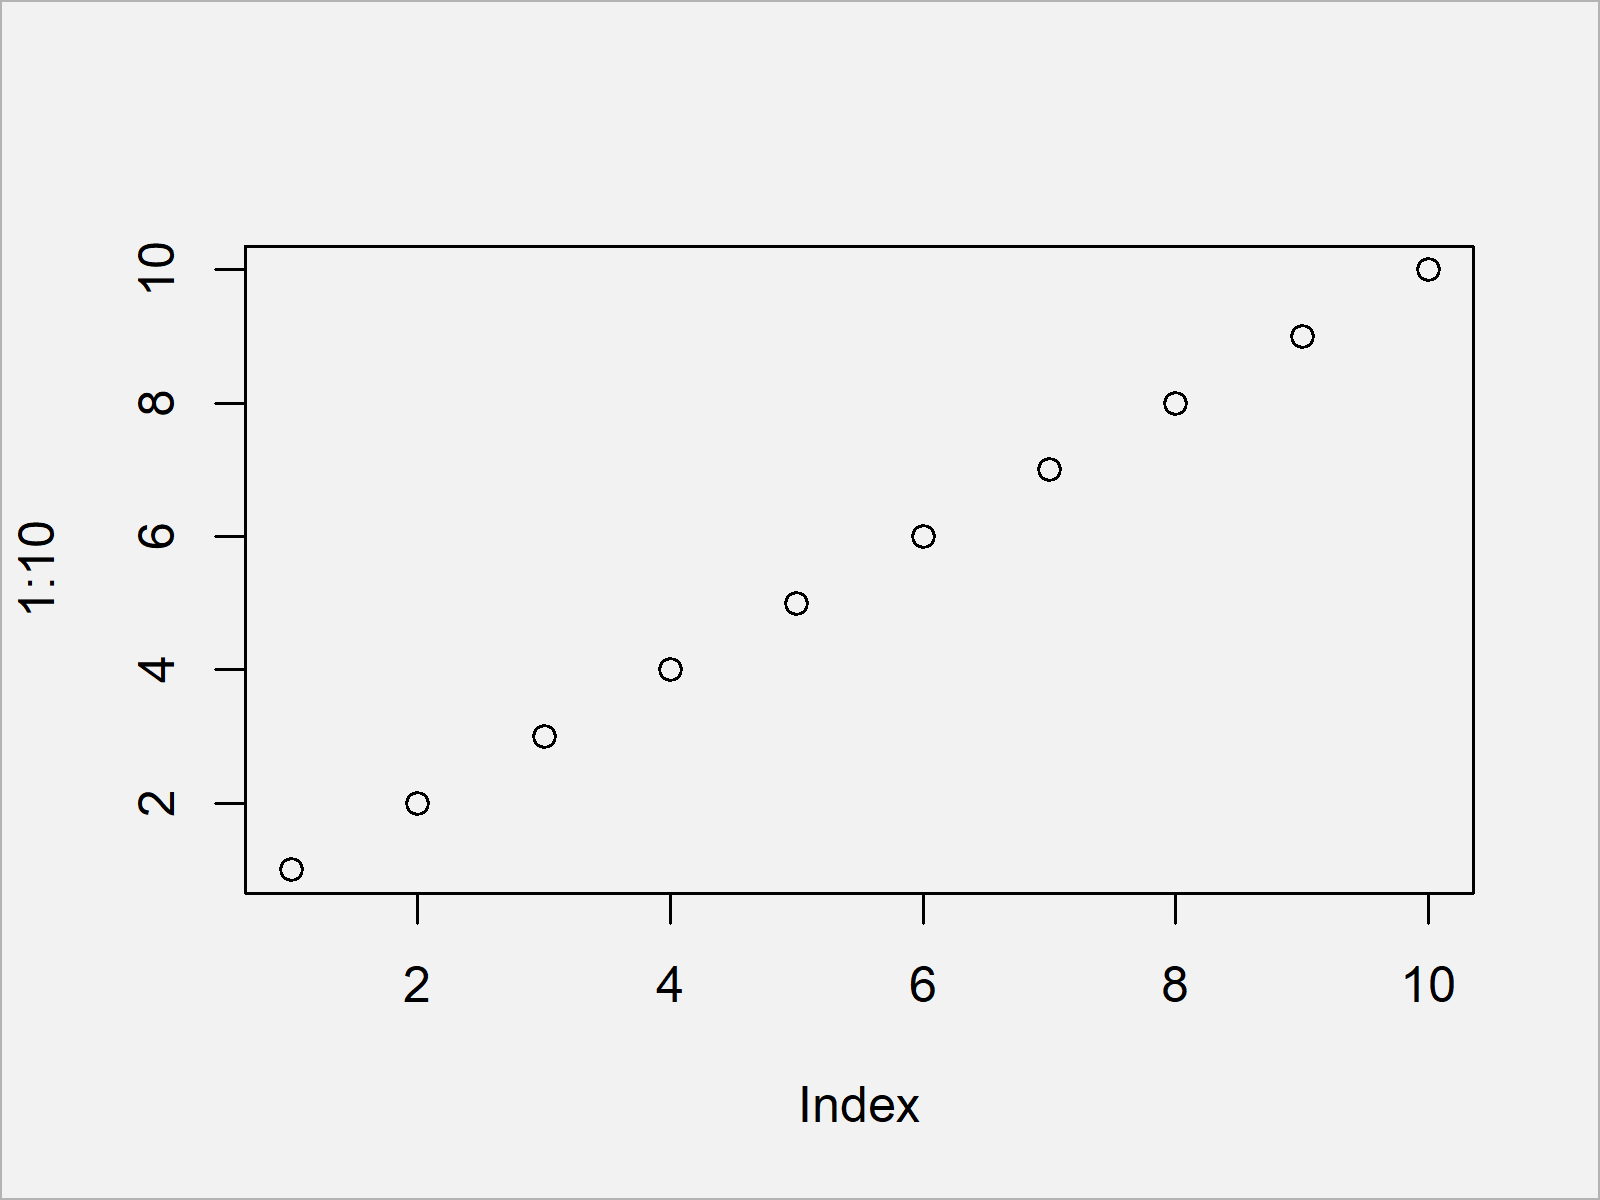
By running the previous R syntax we have created Figure 1, i.e. a Base R scatterplot with default area margins.
We can now use the par function and the mar argument to change the area margins of our plot.
Note that these specifications will be kept in your R session as long as you don’t specify something else or in case you restart your RStudio session entirely:
par(mar = c(4, 4, 0.1, 0.1)) # Reduce space around plots
Now, we can draw our plot again:
plot(1:10) # Draw plot with less space

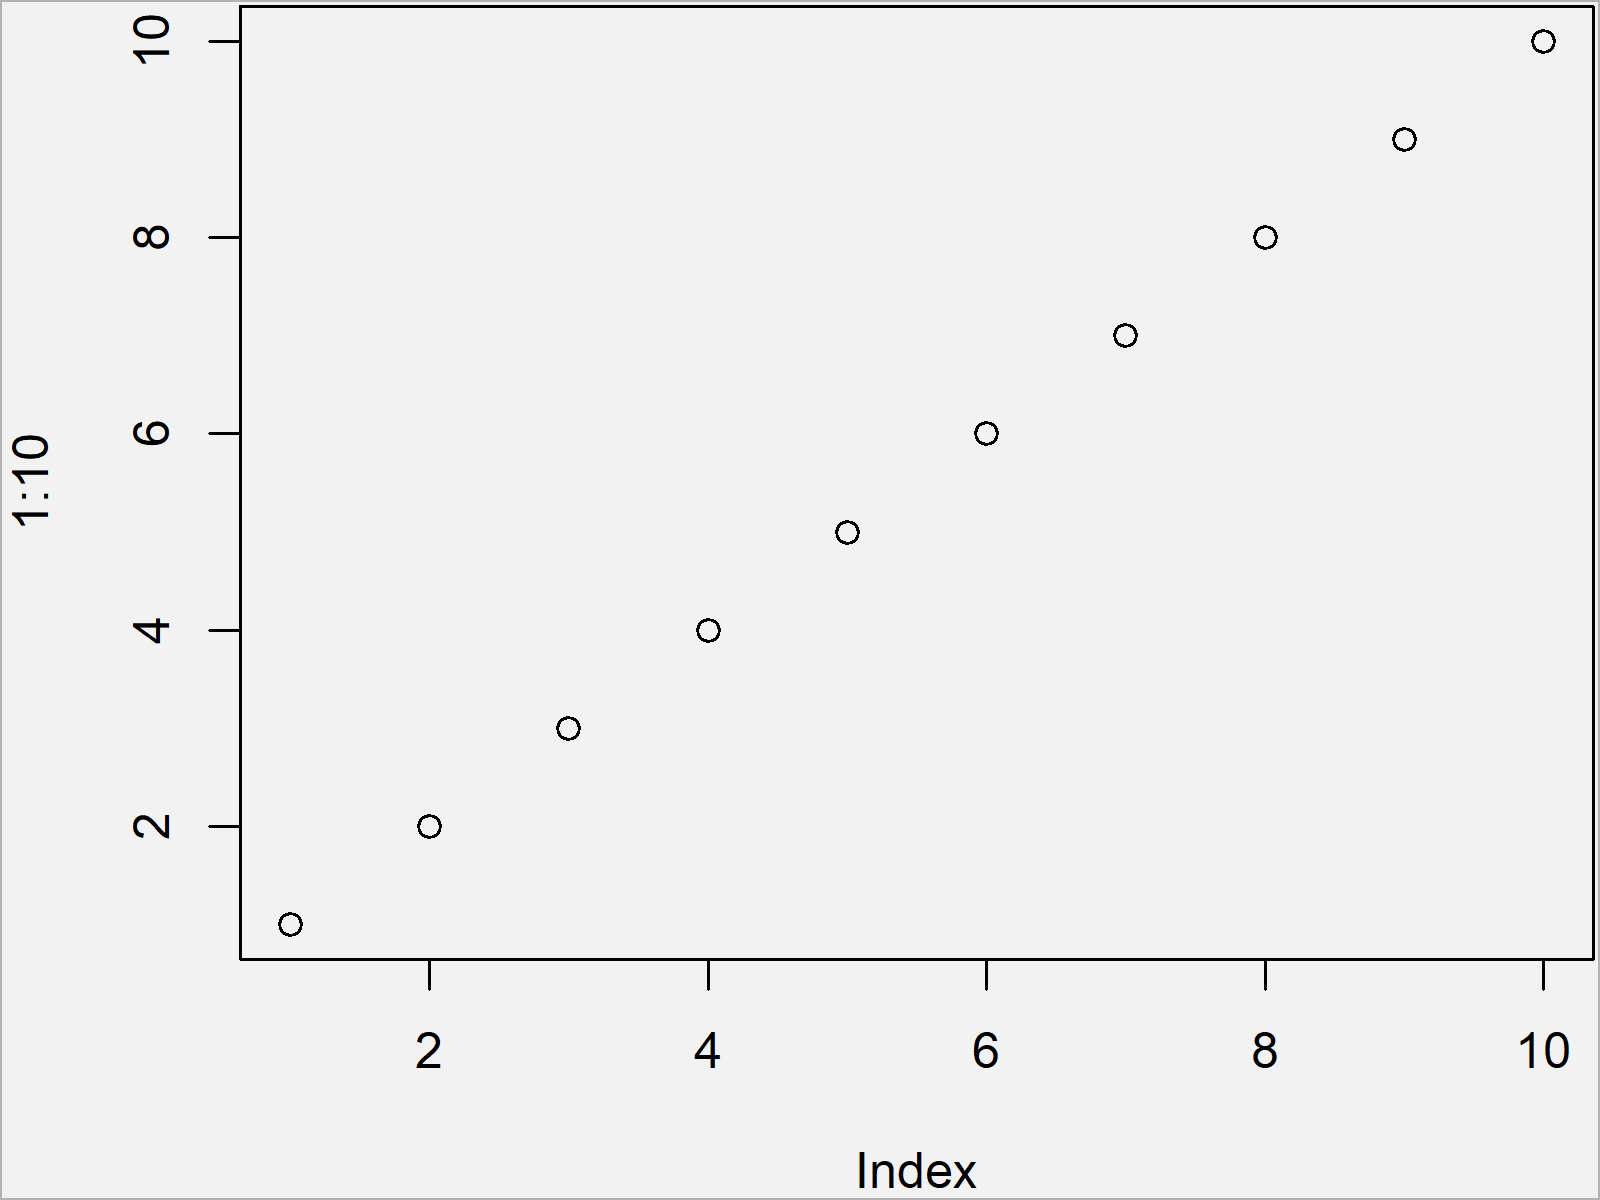
As shown in Figure 2, the previous R programming syntax has plotted the same data in a scatterplot, but this time with less white space around the plot.
Example 2: Set Area Margins of Grid of Plots
Example 2 shows how to use the par function to create a graphic containing multiple plots on the same page without wasting too much space between the plot windows.
For comparison, let’s set the area margins back to default first:
par(mar = c(5.1, 4.1, 4.1, 2.1)) # Default space
Furthermore, we have to use the mfrow argument of the par function to specify a grid of several plots:
par(mfrow = c(2, 2)) # Define grid of plots
Next, we can draw our plot four times to create our grid of plots:
plot(1:10)                          # Draw grid of plots with default space
plot(1:10)
plot(1:10)
plot(1:10)

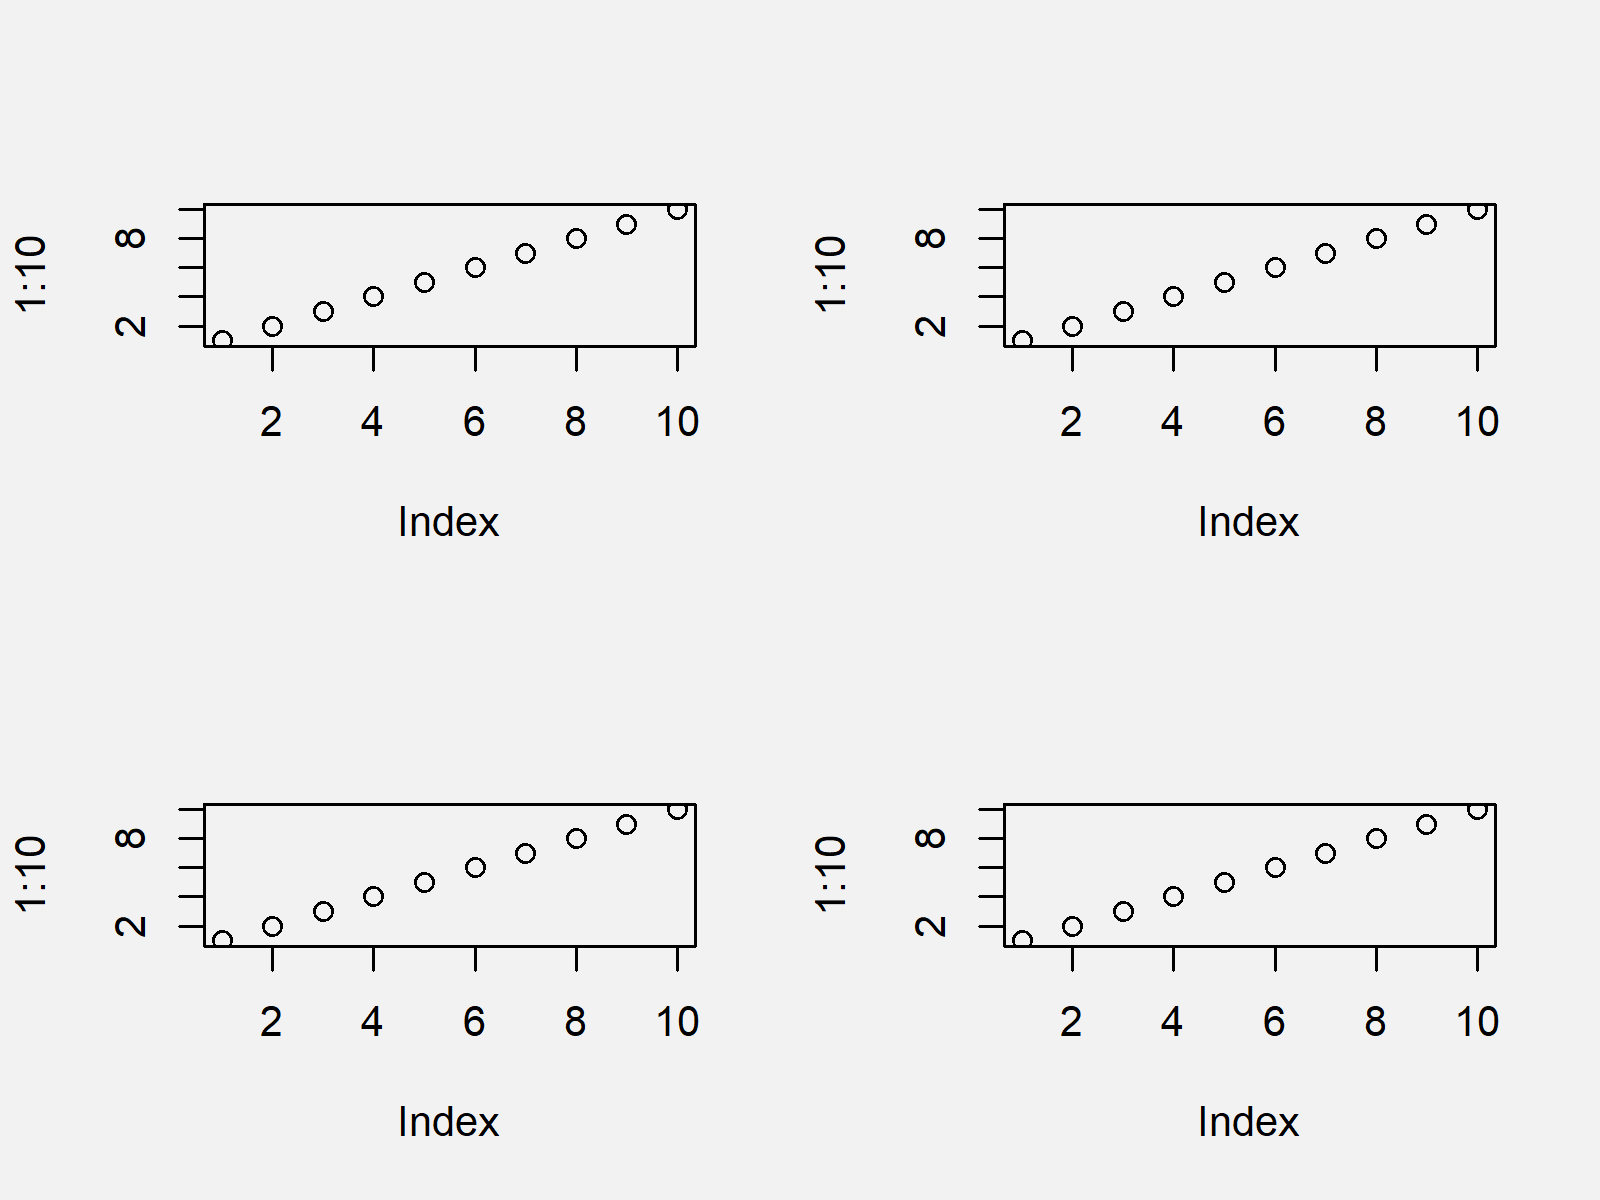
By executing the previous R programming code we have drawn Figure 3, i.e. a grid of plots with relatively much space between the plots.
Let’s reduce this white space!
First, we have to change the global options again using the par function:
par(mar = c(4, 4, 0.1, 0.1)) # Reduce space around plots
Now, we can draw our four plots again:
plot(1:10)                          # Draw grid of plots with less space
plot(1:10)
plot(1:10)
plot(1:10)

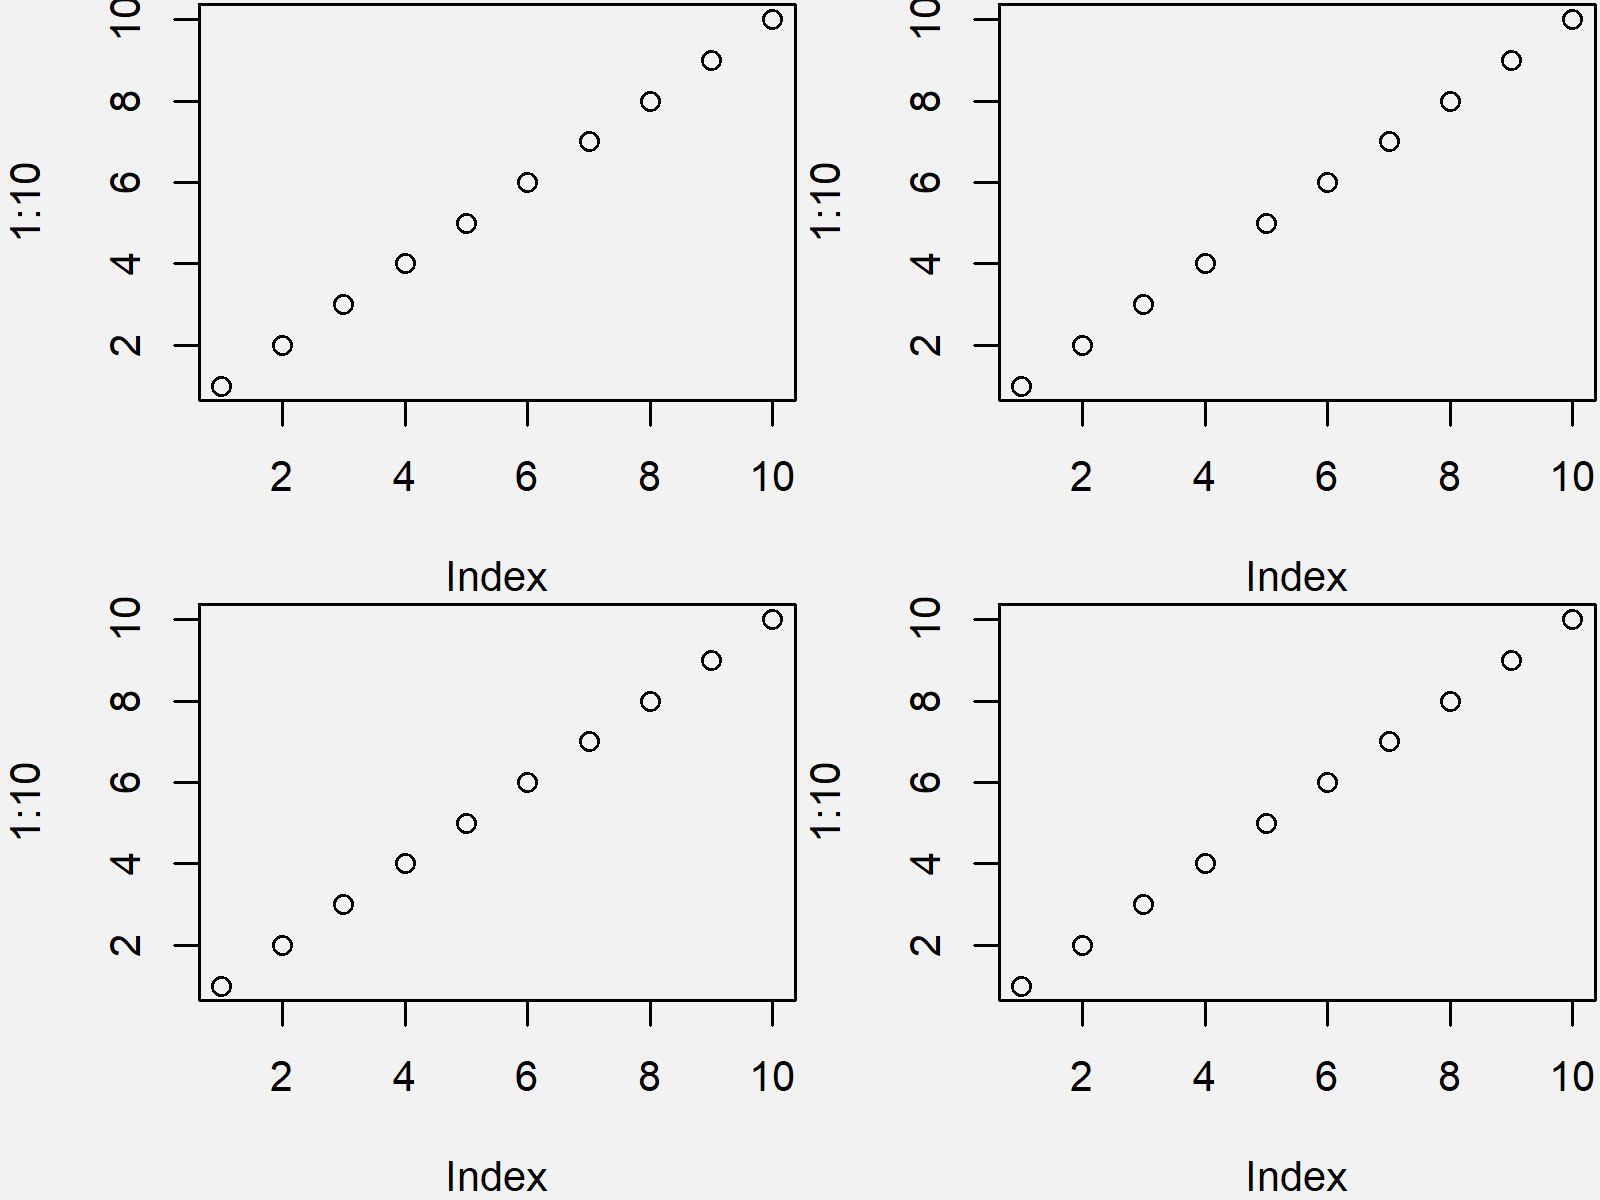
After running the previous R syntax the grid of plots shown in Figure 4 has been drawn. As you can see, the space between the plots was heavily reduced.
Video & Further Resources
Do you need further info on the R programming syntax of this article? Then I recommend having a look at the following video of my YouTube channel. I’m explaining the R programming syntax of this article in the video:
In addition, you could have a look at the other articles of my homepage.
- Set Area Margins of ggplot2 Plot
- Move Axis Label Closer to Plot in Base R
- Change Spacing of Axis Tick Marks in Base R Plot
- Drawing Plots in R
- R Programming Tutorials
In summary: In this post, I have illustrated how to not waste space around graphs in the R programming language. Tell me about it in the comments section below, if you have any further questions.


4 Comments. Leave new
It was not what I was looking for
Hi Luis,
Could you explain? For what have you been looking for?
Regards
Joachim
How would you reduce the space around 1 graph?
Hello Kate,
Doesn’t the first example show how to do it? Did you mean something else?
Regards,
Cansu