Sort Table in R (3 Examples)
In this tutorial you’ll learn how to order a table by frequency in R.
Table of contents:
Let’s dive right into the examples…
Creating Example Data
We’ll use the following data as basement for this R programming tutorial:
x <- c(letters[1:4], letters[2:5], "d")    # Create example vector
x                                          # Print example vector
# [1] "a" "b" "c" "d" "b" "c" "d" "e" "d"
Have a look at the previous output of the RStudio console. It shows that our example data is a character vector containing different letters.
Next, we can create a frequency table of this vector using the table() function:
my_tab <- table(x)                         # Create example table
my_tab                                     # Print example table
# x
# a b c d e
# 1 2 2 3 1
The previous output shows the frequency counts of our vector in a table object called my_tab.
As you can see, the previous table is sorted by alphabetical order. Let’s order our table by frequency counts!
Example 1: Sort Table in Increasing Order Using Base R
Example 1 illustrates how to sort a table object by frequency counts in increasing order.
For this task, we can apply the order function as shown below:
my_tab_sort1 <- my_tab[order(my_tab)]      # Order table
my_tab_sort1                               # Print ordered table
# x
# a e b c d
# 1 1 2 2 3
The previous output shows our updated table, which is sorted by the number of occurrences of each vector element.
Example 2: Sort Table in Decreasing Order Using Base R
In Example 1, I have explained how to use the order function to sort a table from the least appearances to the most appearances of a certain value.
In Example 2, I’ll show how to sort a table the other way around, i.e. in decreasing order.
To do this, we have to specify the decreasing argument within the order function to be equal to the logical indicator TRUE.
Have a look at the following R syntax and its output:
my_tab_sort2 <- my_tab[order(my_tab,       # Decreasing order of table
                             decreasing = TRUE)]
my_tab_sort2                               # Print ordered table
# x
# d b c a e
# 3 2 2 1 1
As you can see, we have arranged our table from the most occurrences to the least occurrences.
Example 3: Sort Table in Decreasing Order Using dplyr Package
So far, we have used the order function of Base R to sort our data.
In this example, I’ll show how to apply the functions of the dplyr package to order a table object.
If we want to use the functions of the dplyr package, we first have to install and load dplyr:
install.packages("dplyr")                  # Install & load dplyr package
library("dplyr")
Next, we can apply the as.data.frame, arrange, and desc functions to order our data in decreasing order:
my_tab_sort3 <- my_tab %>%                 # Order table with dplyr
  as.data.frame() %>%
  arrange(desc(Freq))
my_tab_sort3                               # Print ordered table as data frame

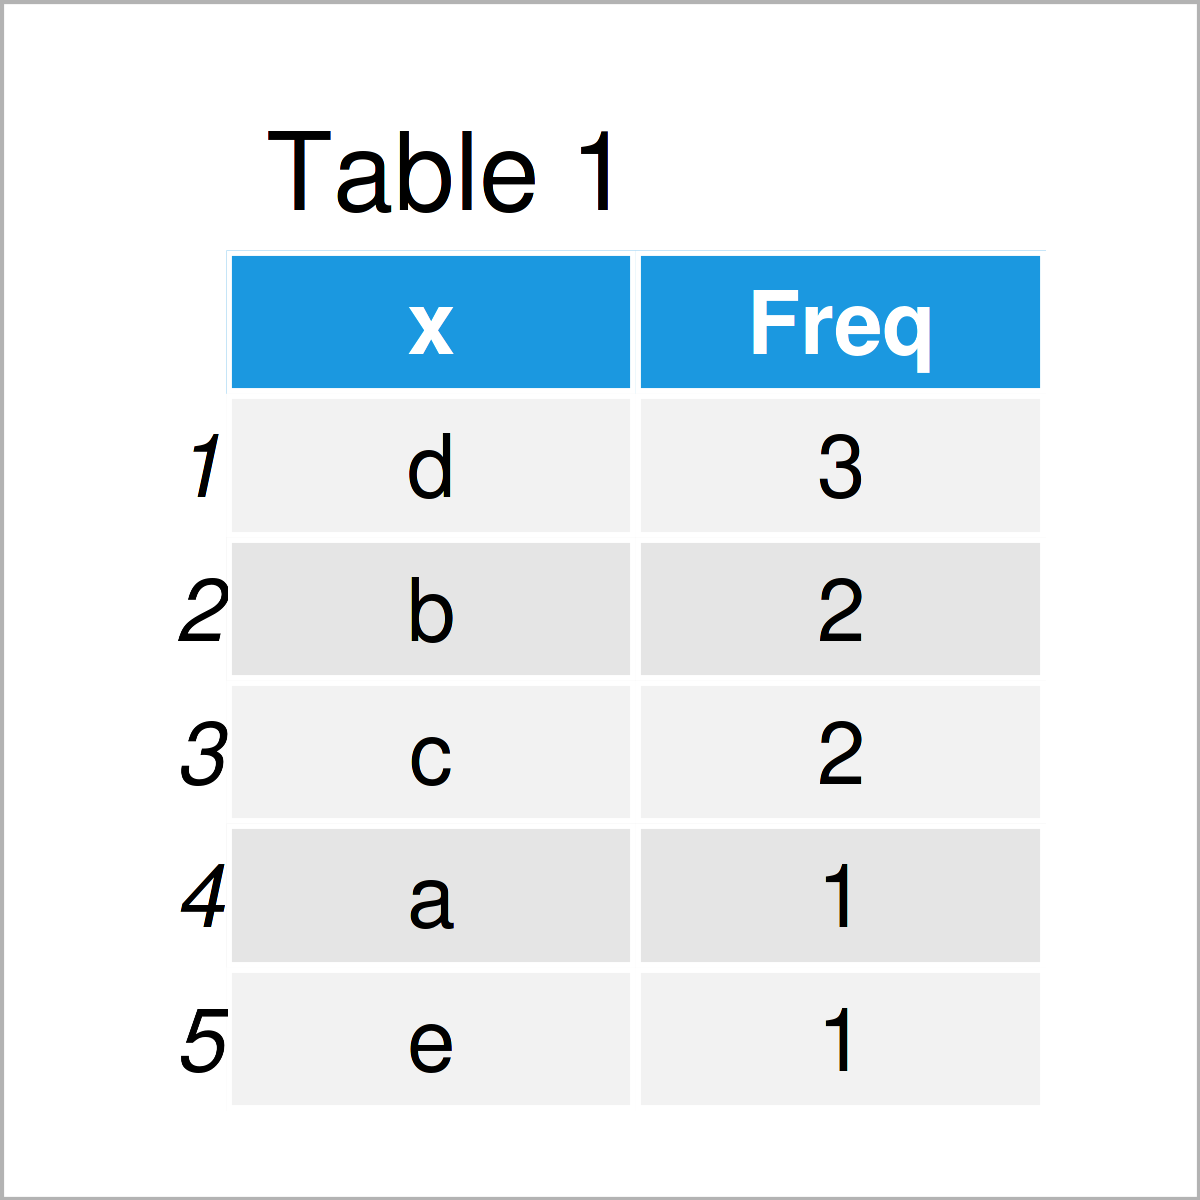
Table 1 illustrates the RStudio console output of the previous R code. We have created a data frame that indicates the frequency counts of each item in our table sorted by decreasing order.
Video & Further Resources
In case you need more info on the R programming syntax of this post, I can recommend having a look at the following video on my YouTube channel. In the video instruction, I demonstrate the contents of the present tutorial:
Furthermore, you might read the related articles on my website. I have released numerous tutorials already.
- Sort Data Frame in R
- Sort Variables of Data Frame by Column Names
- Sort Matrix According to First Column
- Sort Vector Based on Values of Another
- Sort Data Frame by Multiple Columns
- str_order & str_sort Functions in R
- Introduction to R Programming
In summary: You have learned in this tutorial how to sort the columns of a table object by frequency in R programming. If you have any additional questions or comments, don’t hesitate to let me know in the comments section below.


