Set Number of Bins for Histogram in R (2 Examples)
In this article you’ll learn how to change the width of bins of a histogram in the R programming language.
The content of the tutorial is structured as follows:
Let’s dive right in!
Creation of Exemplifying Data
First of all, we’ll need to create some data that we can use in the example syntax below:
set.seed(8273456)                 # Create example data
data <- data.frame(x = rnorm(100))
head(data)                        # Print head example data
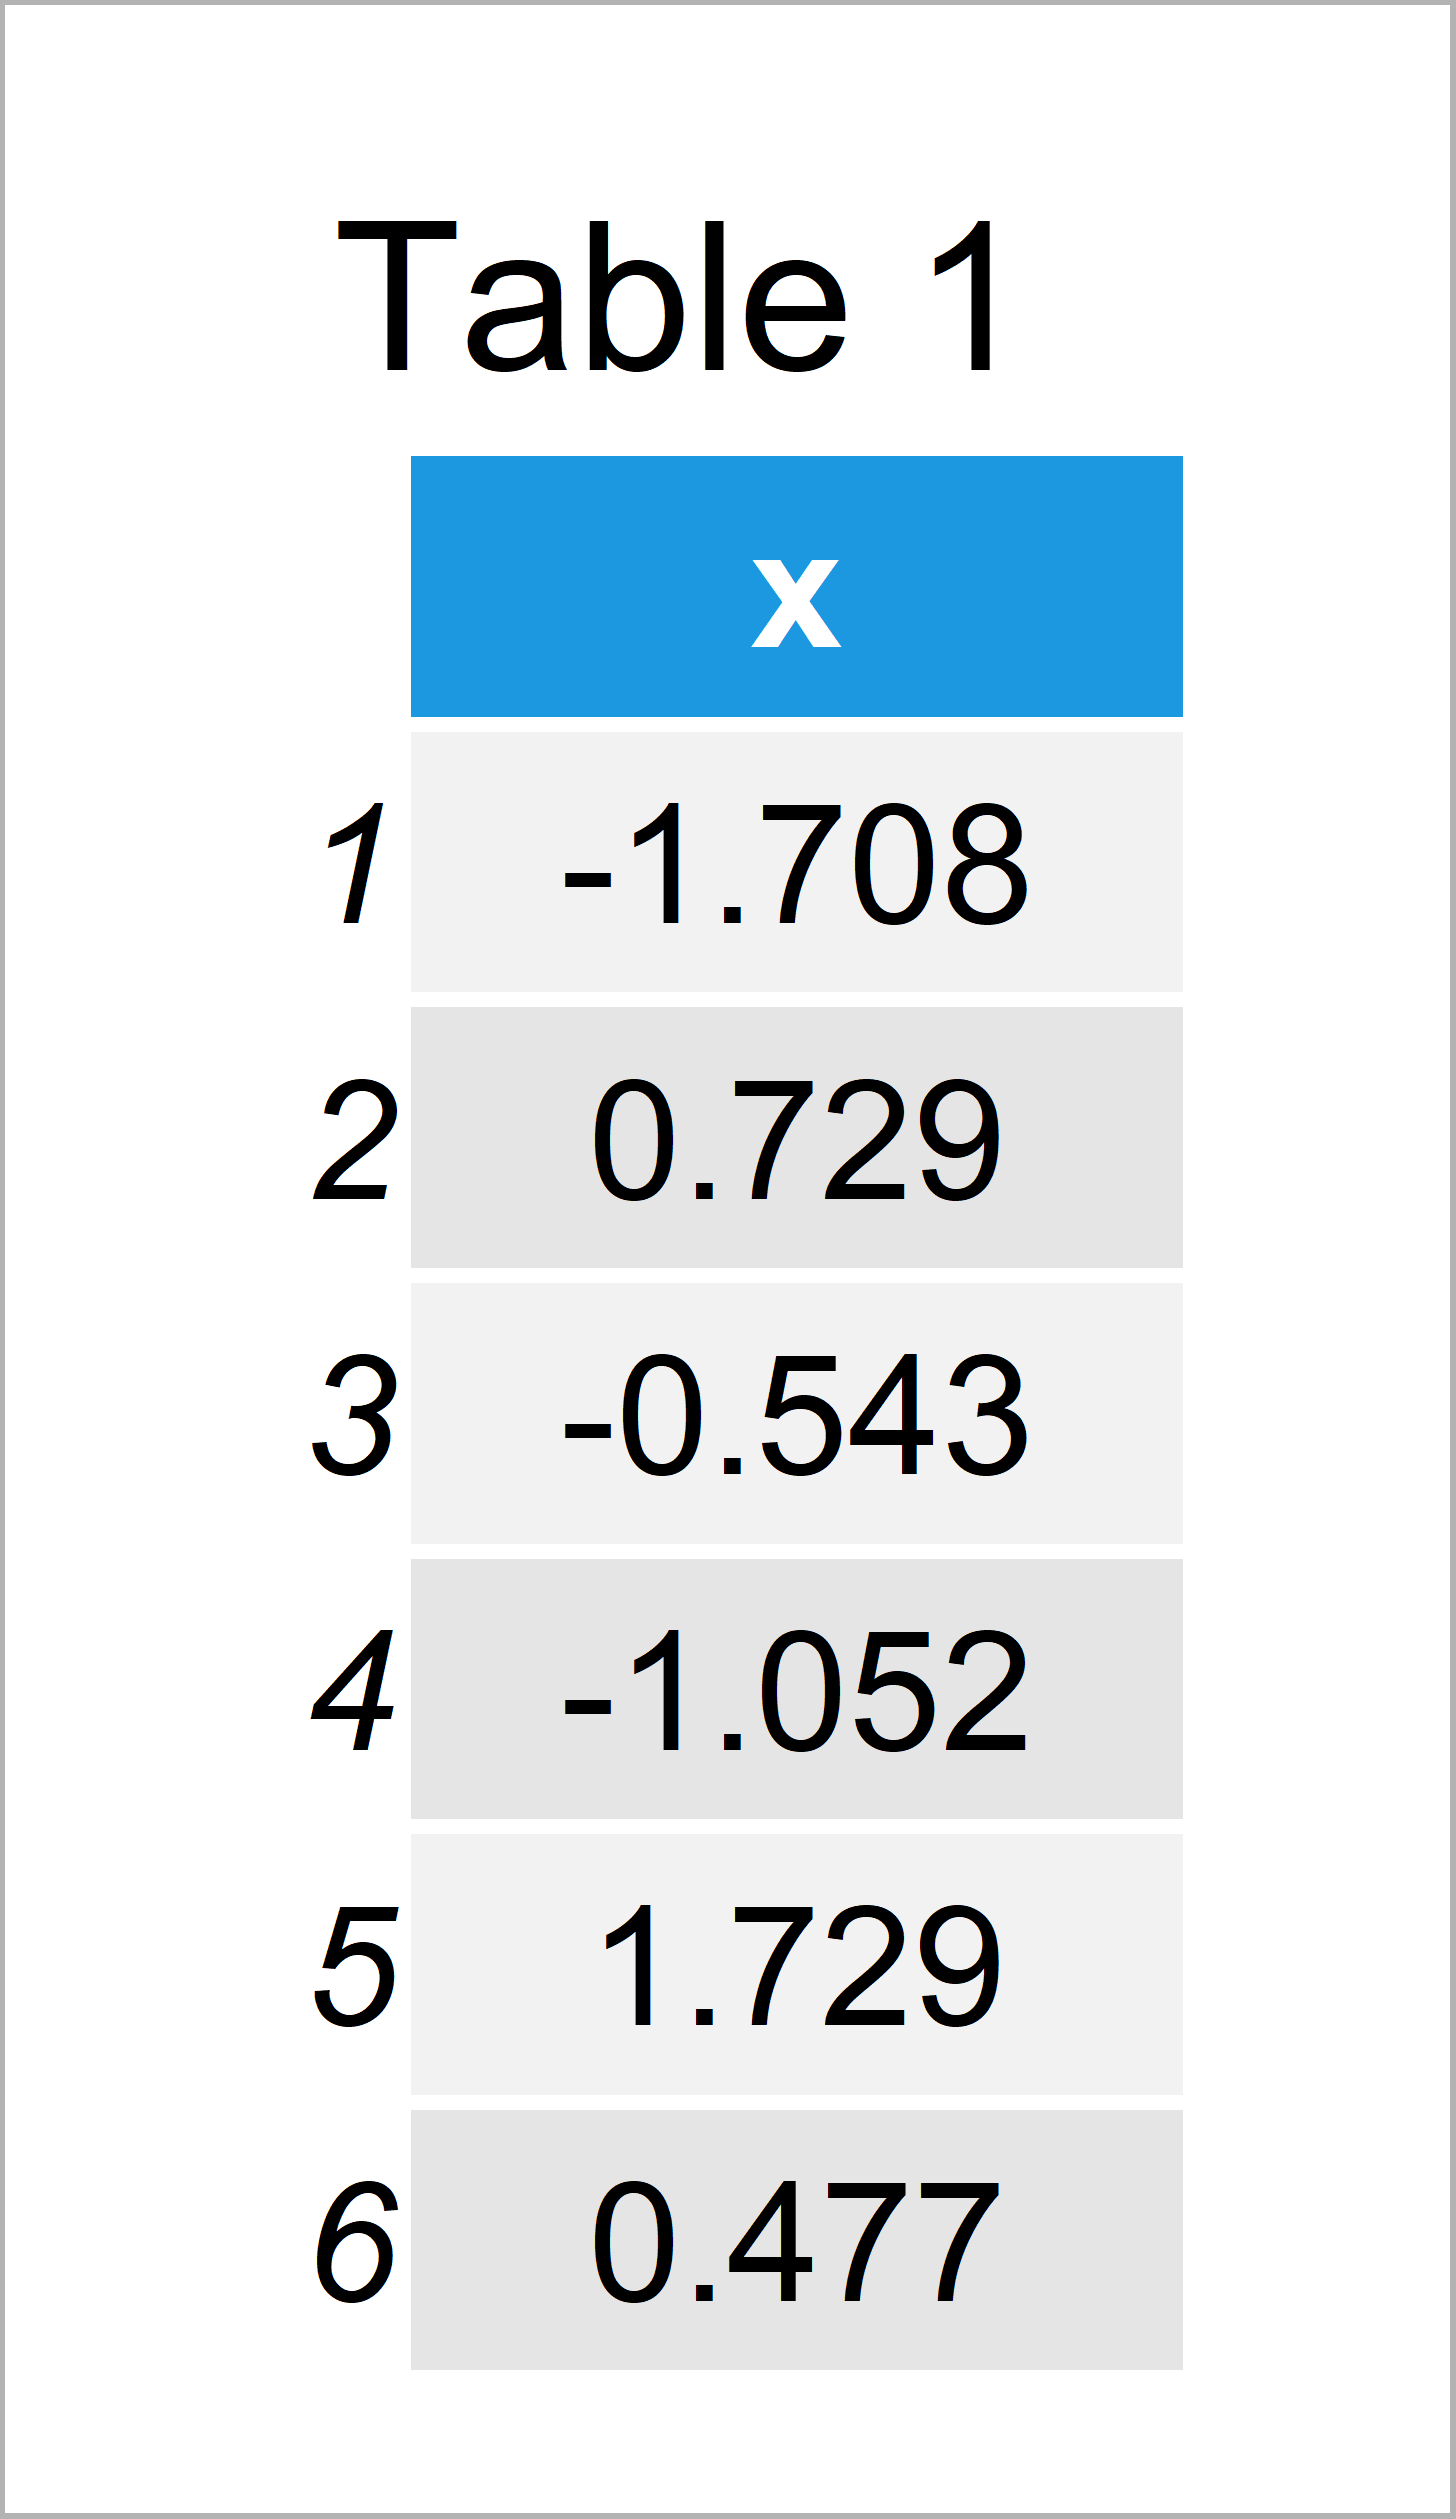
Table 1 illustrates the RStudio console output and shows the first six data points of our example data: Furthermore, you can see that our example data has only one column called “x”.
Example 1: Modify Bins of Base R Histogram
Example 1 shows how to change the width of bins in a Base R histogram.
First, let’s create a histogram with default bin intervals:
hist(data$x) # Base R histogram with default bins
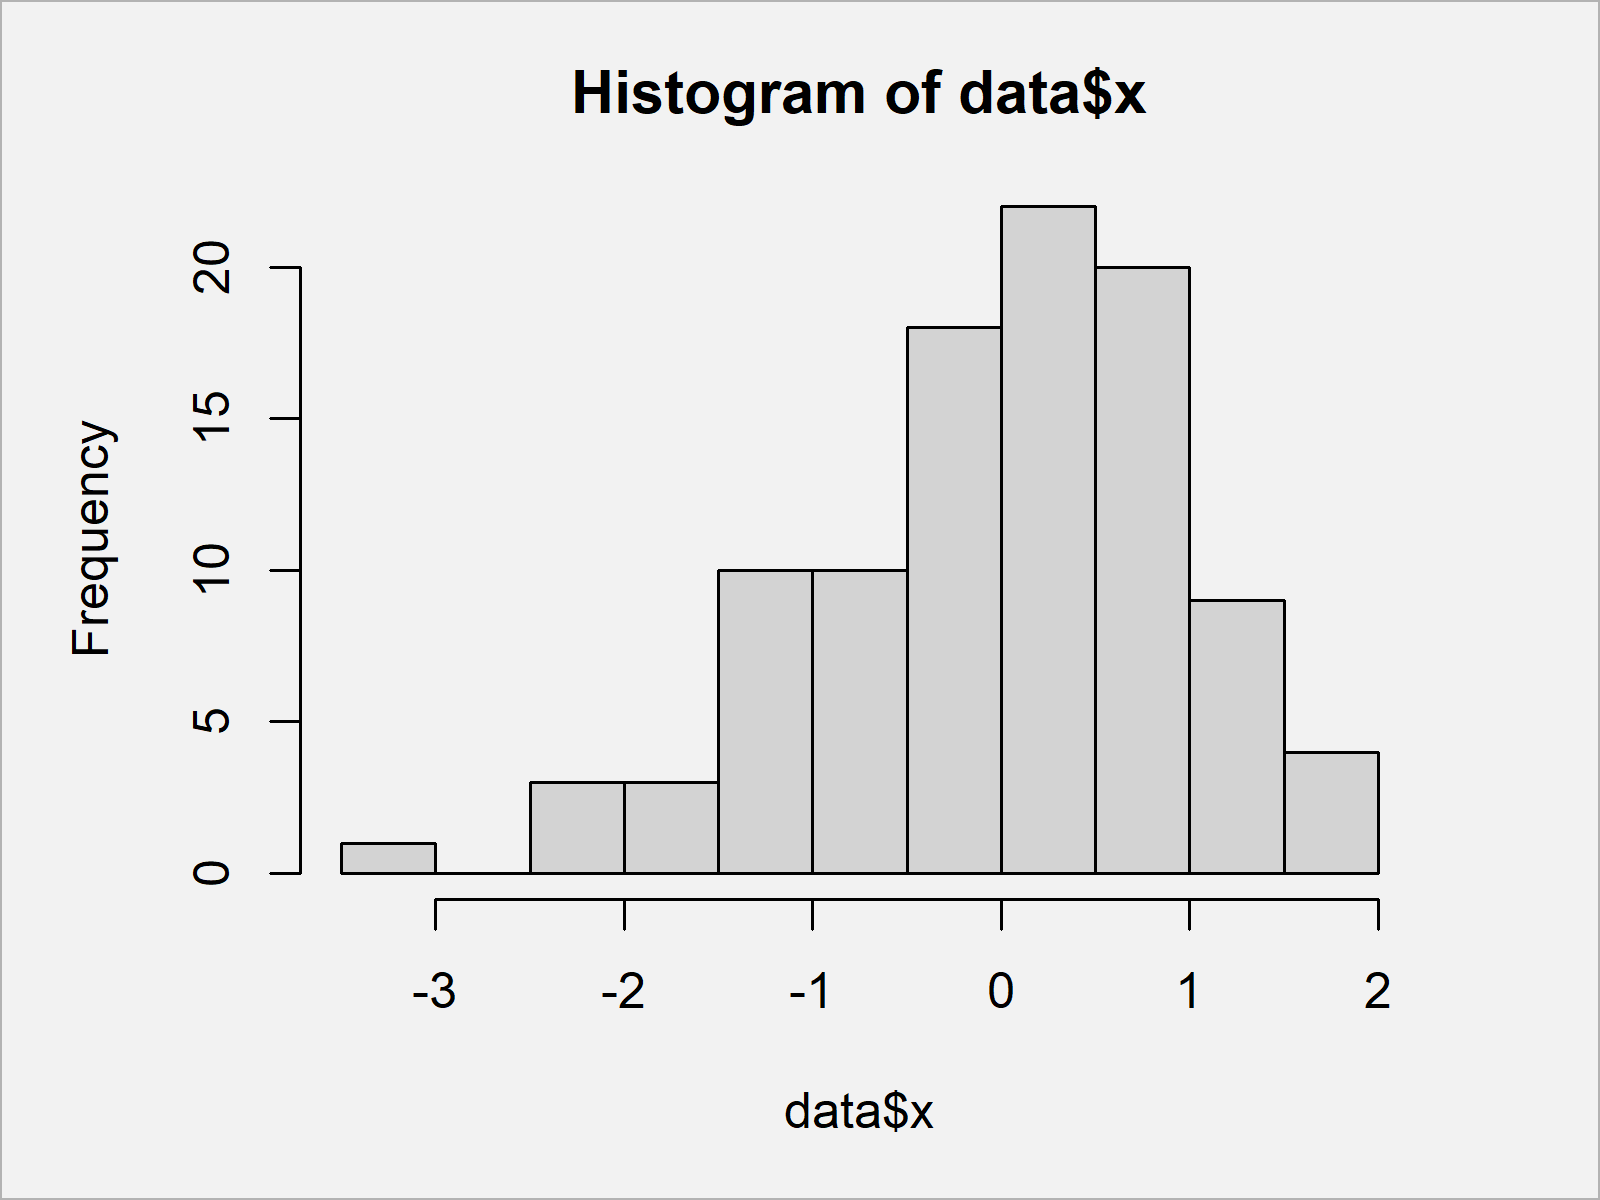
In Figure 1 you can see that we have created a Base R histogram with default bin width.
Now, we can use the breaks argument of the hist function to increase or decrease the width of our bars. In this example, we use a number of 100 bins:
hist(data$x, breaks = 100) # Base R histogram with manual bins
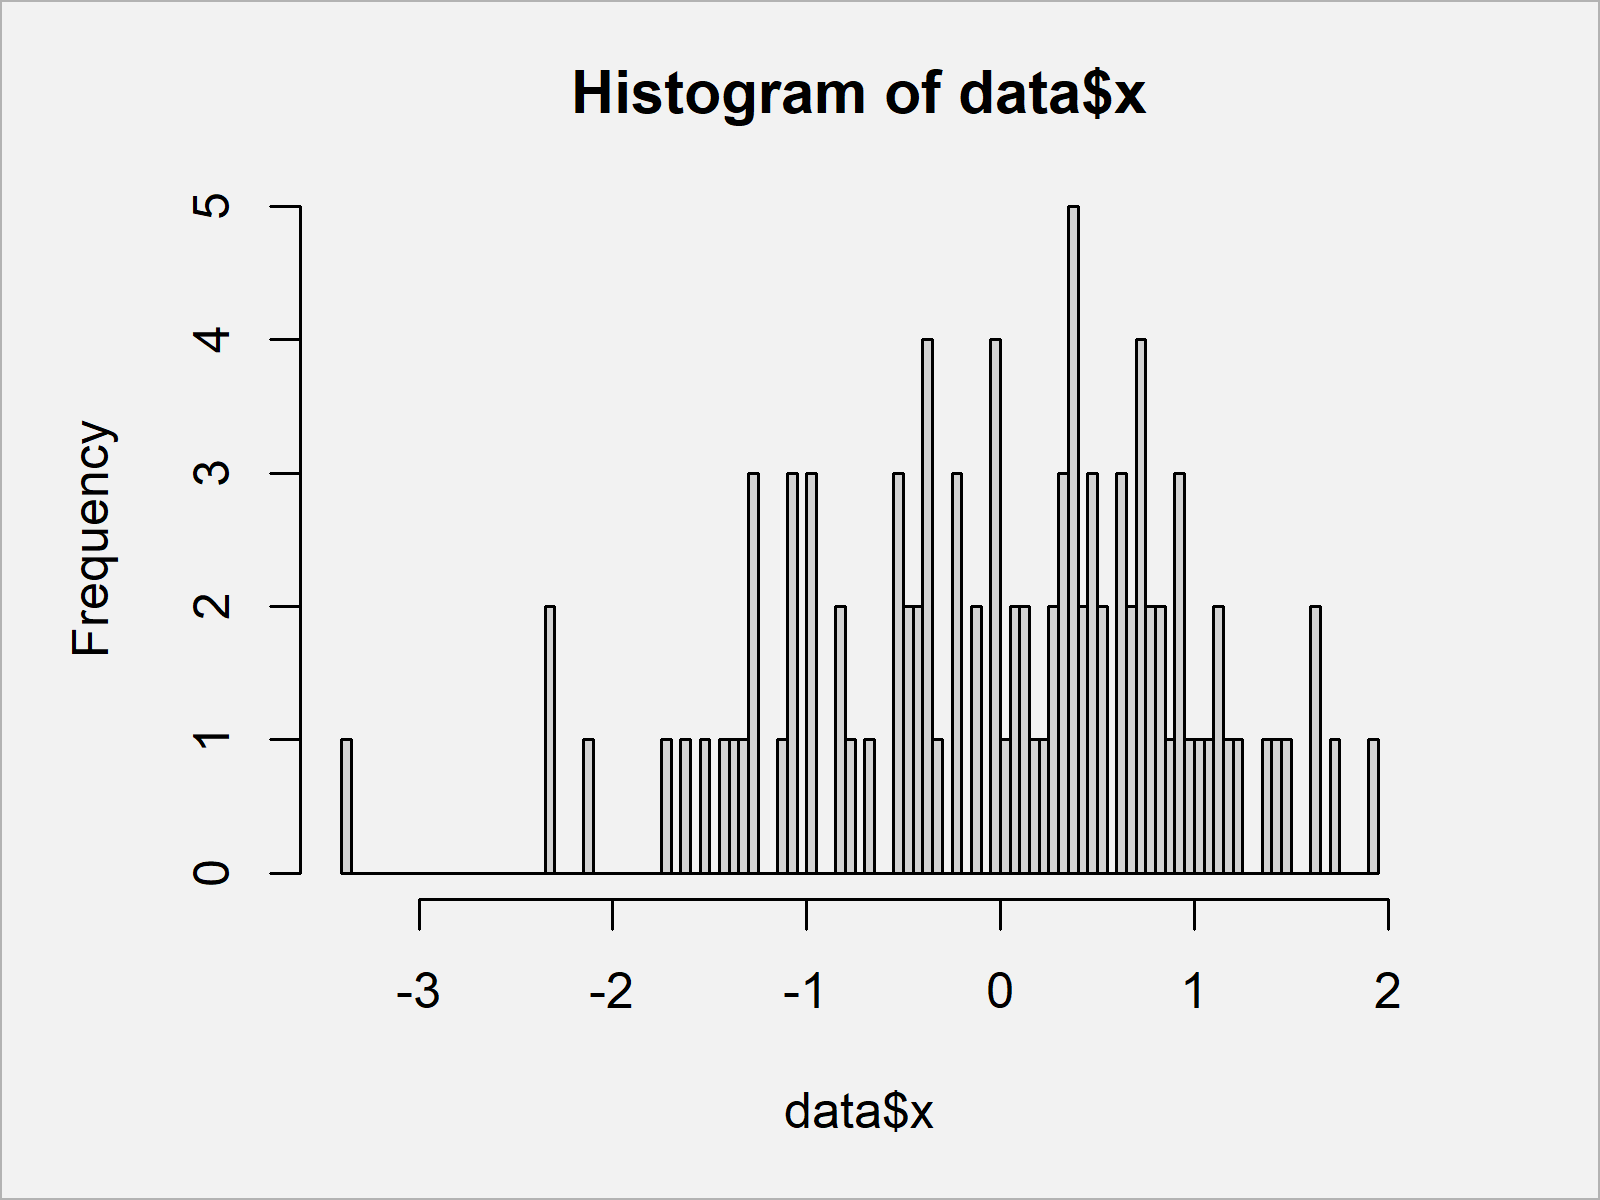
In Figure 2 it is shown that we have managed to create a Base R histogram with thinner bars.
Example 2: Modify Bins of ggplot2 Histogram
In Example 1, I have explained how to modify the bin width of a Base R histogram.
This example illustrates how to change the bar size of histograms using the ggplot2 package.
First, we need to install and load the ggplot2 package:
install.packages("ggplot2")       # Install & load ggplot2 package
library("ggplot2")
Now, we can use the ggplot and geom_histogram functions to create a ggplot2 histogram with default bin sizes:
ggplot(data, aes(x)) +            # ggplot2 histogram with default bins
  geom_histogram()
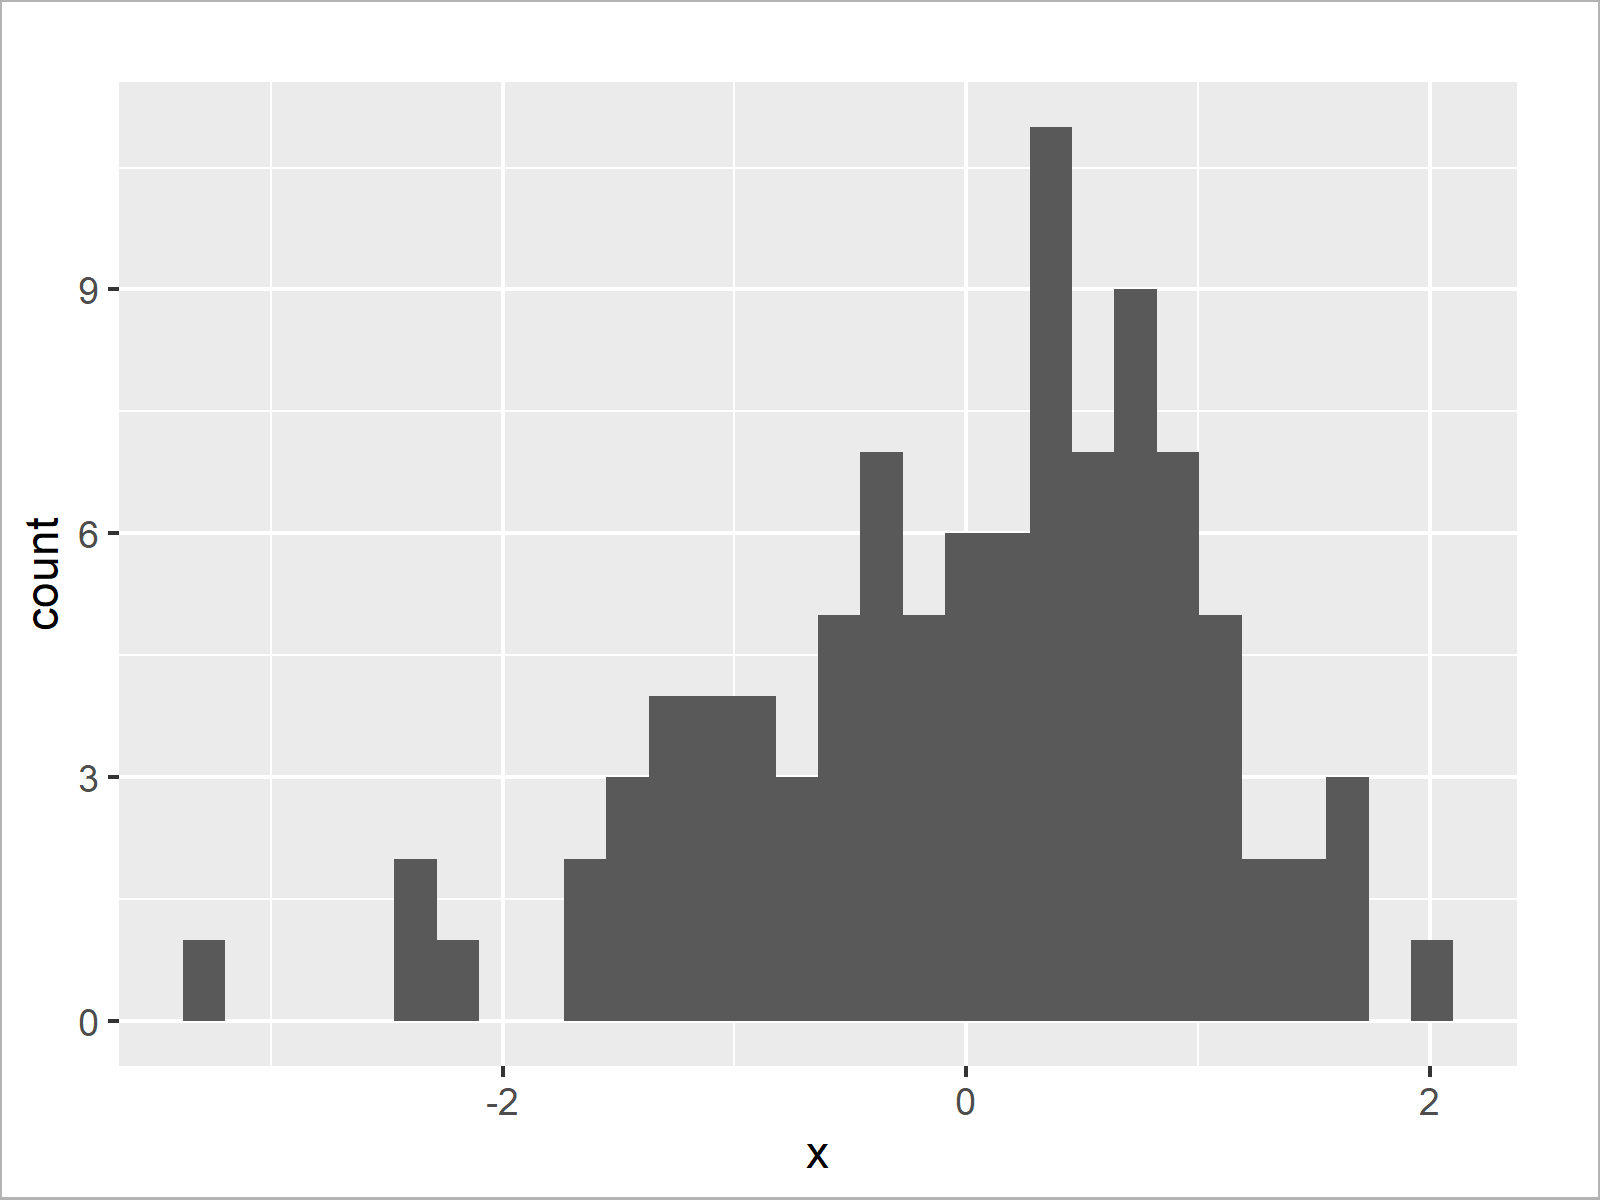
After running the previous R code the ggplot2 histogram with default bins shown in Figure 3 has been drawn.
Next, we can use the bins argument within the geom_histogram command to replace the default bin intervals:
ggplot(data, aes(x)) +            # ggplot2 histogram with manual bins
  geom_histogram(bins = 100)
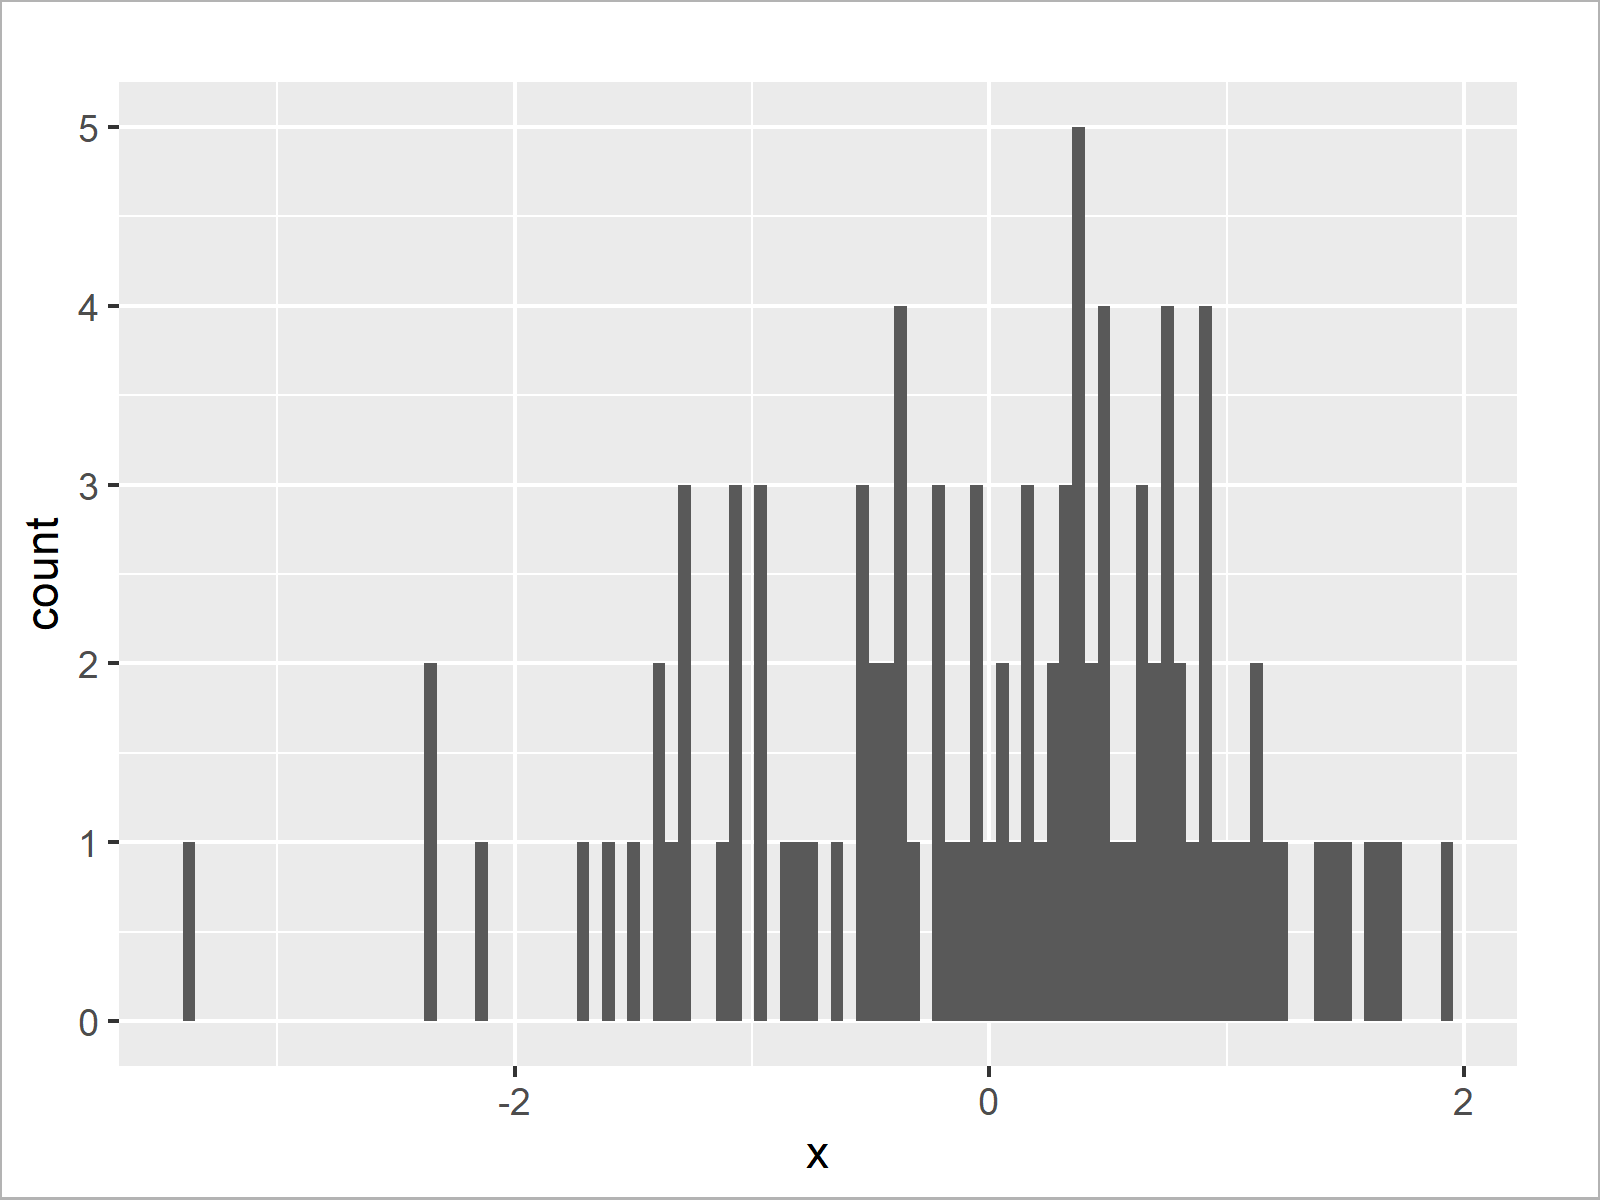
Figure 4 shows the output of the previous syntax – A ggplot2 histogram with more bars.
Video, Further Resources & Summary
Some time ago I have published a video instruction on my YouTube channel, which illustrates the R codes of this article. Please find the video below.
In addition, you might read the other tutorials on my website. Some articles are shown below.
- Extract Frequency Counts from Histogram in R
- Add Mean & Median to Histogram in R
- Plotting Data in R
- R Programming Overview
This article has shown how to set the number of bins in a histogram in the R programming language. Don’t hesitate to let me know in the comments section, if you have additional questions.


