Change Space Between Boxplots in R (2 Examples)
In this article you’ll learn how to increase or decrease the space between boxplots in R programming.
Table of contents:
Let’s dive right in:
Example Data
First and foremost, we’ll have to construct some data that we can use in the exemplifying code later on:
set.seed(3455433)             # Create example data
data <- data.frame(group = letters[1:5],
                   value = rnorm(100))
head(data)                    # Print head of example data
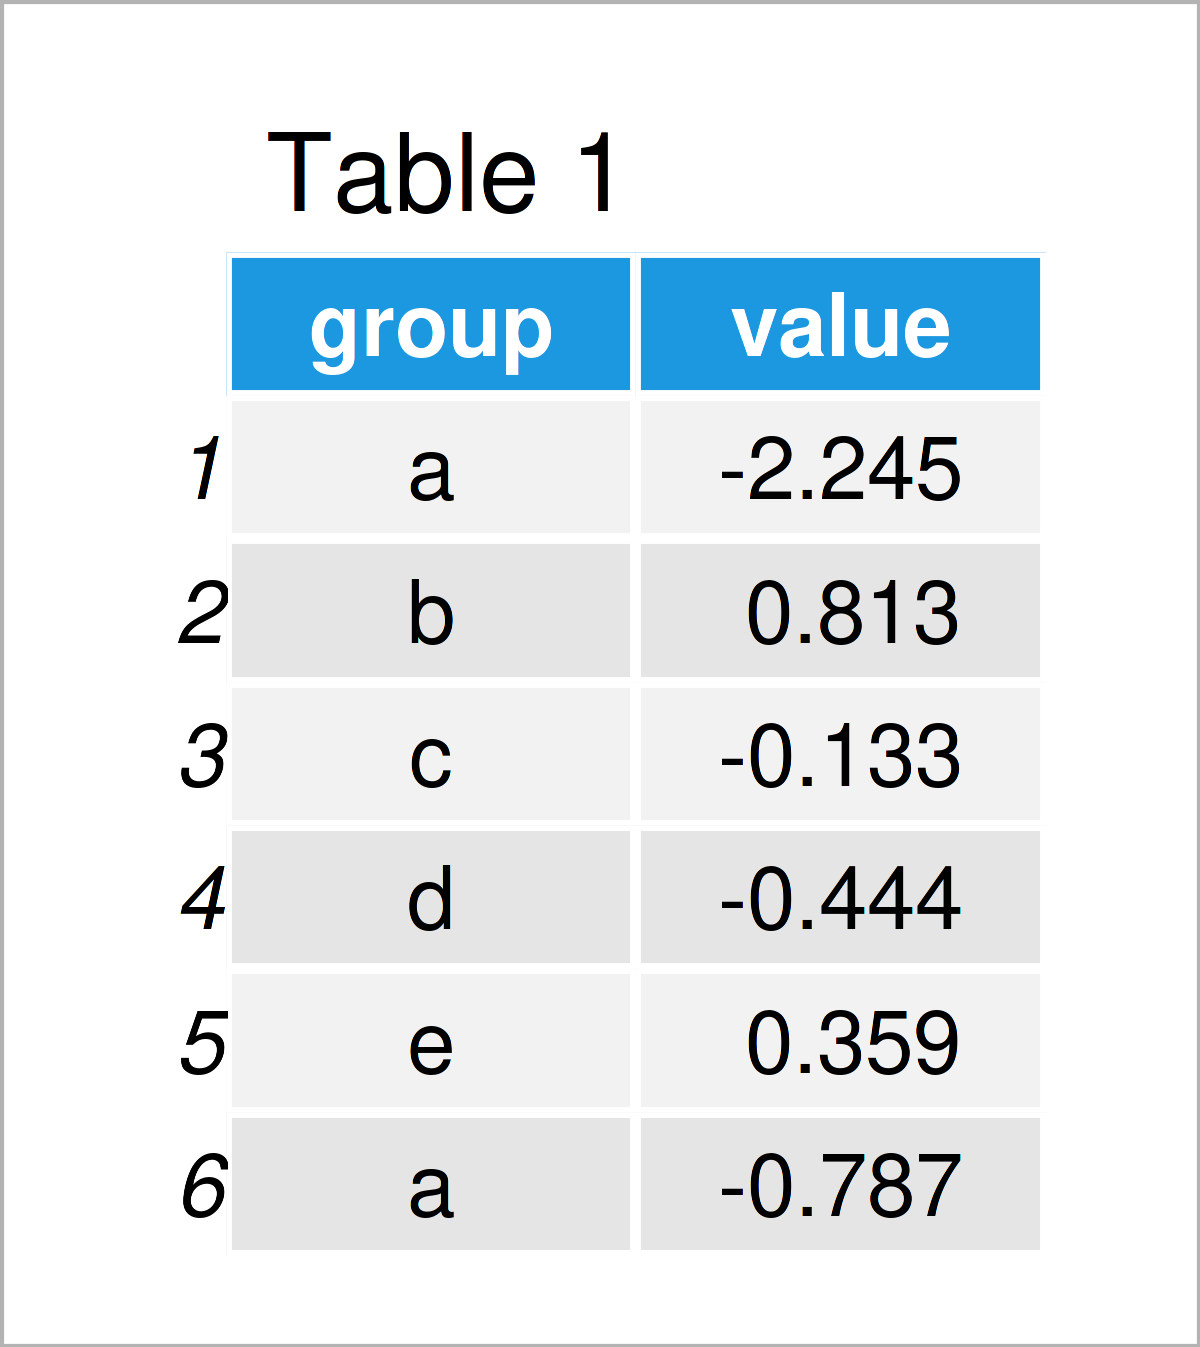
Table 1 shows the first six cases of our example data: it is also visualized that our data comprises two columns. The variable group has the character data type and the variable value has the numeric class.
Example 1: Modify Space Between Boxplots Using Base R
The following R code illustrates how to adjust the space between boxplots in a Base R graphic.
Let’s first create a Base R boxplot with default specifications:
boxplot(value ~ group,        # Draw default boxplot
        data)
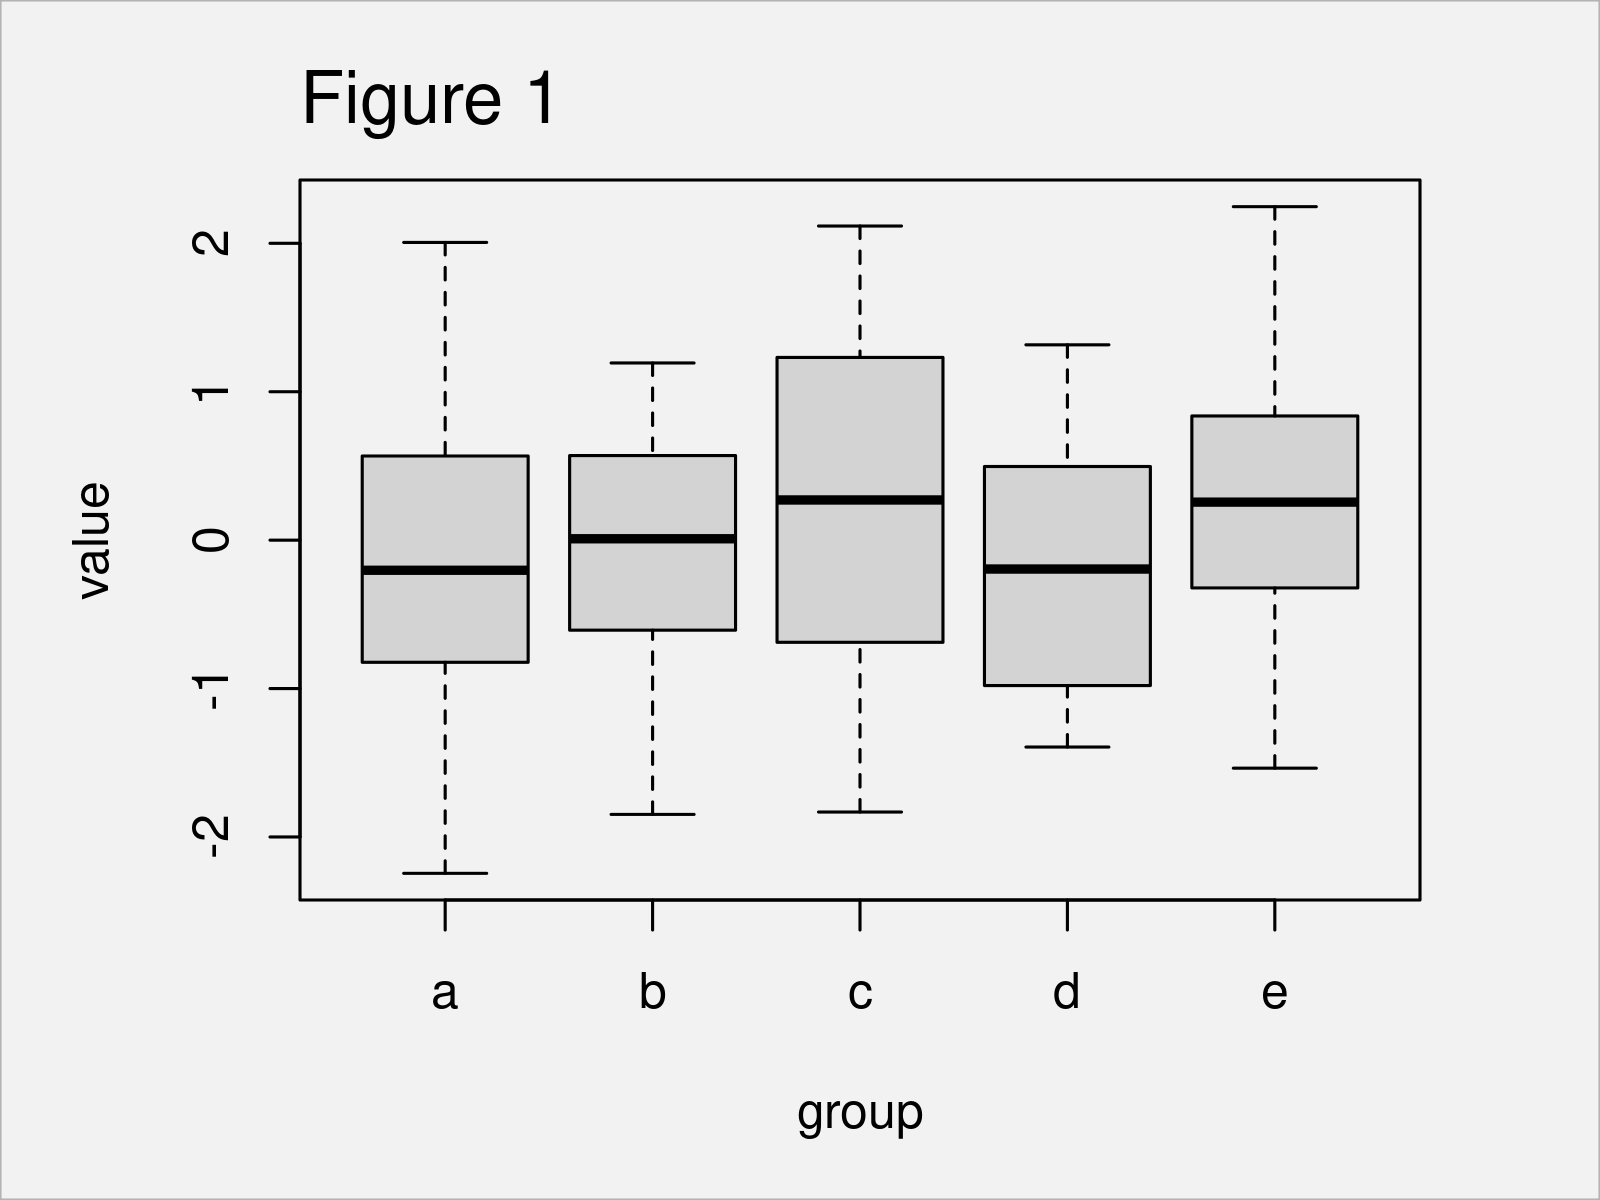
The output of the previous syntax is shown in Figure 1: We have created a boxplot graph with five boxplots. The spaces between these boxes are relatively thin.
We can use the following syntax to increase the space between our boxplots. Note that the value 3 in the following code defines the space. The larger this value gets, the more space will be added:
boxplot(value ~ group,        # Draw boxplot with increased space
        data,
        at = seq(1, length(table(data$group)) * 3, by = 3))
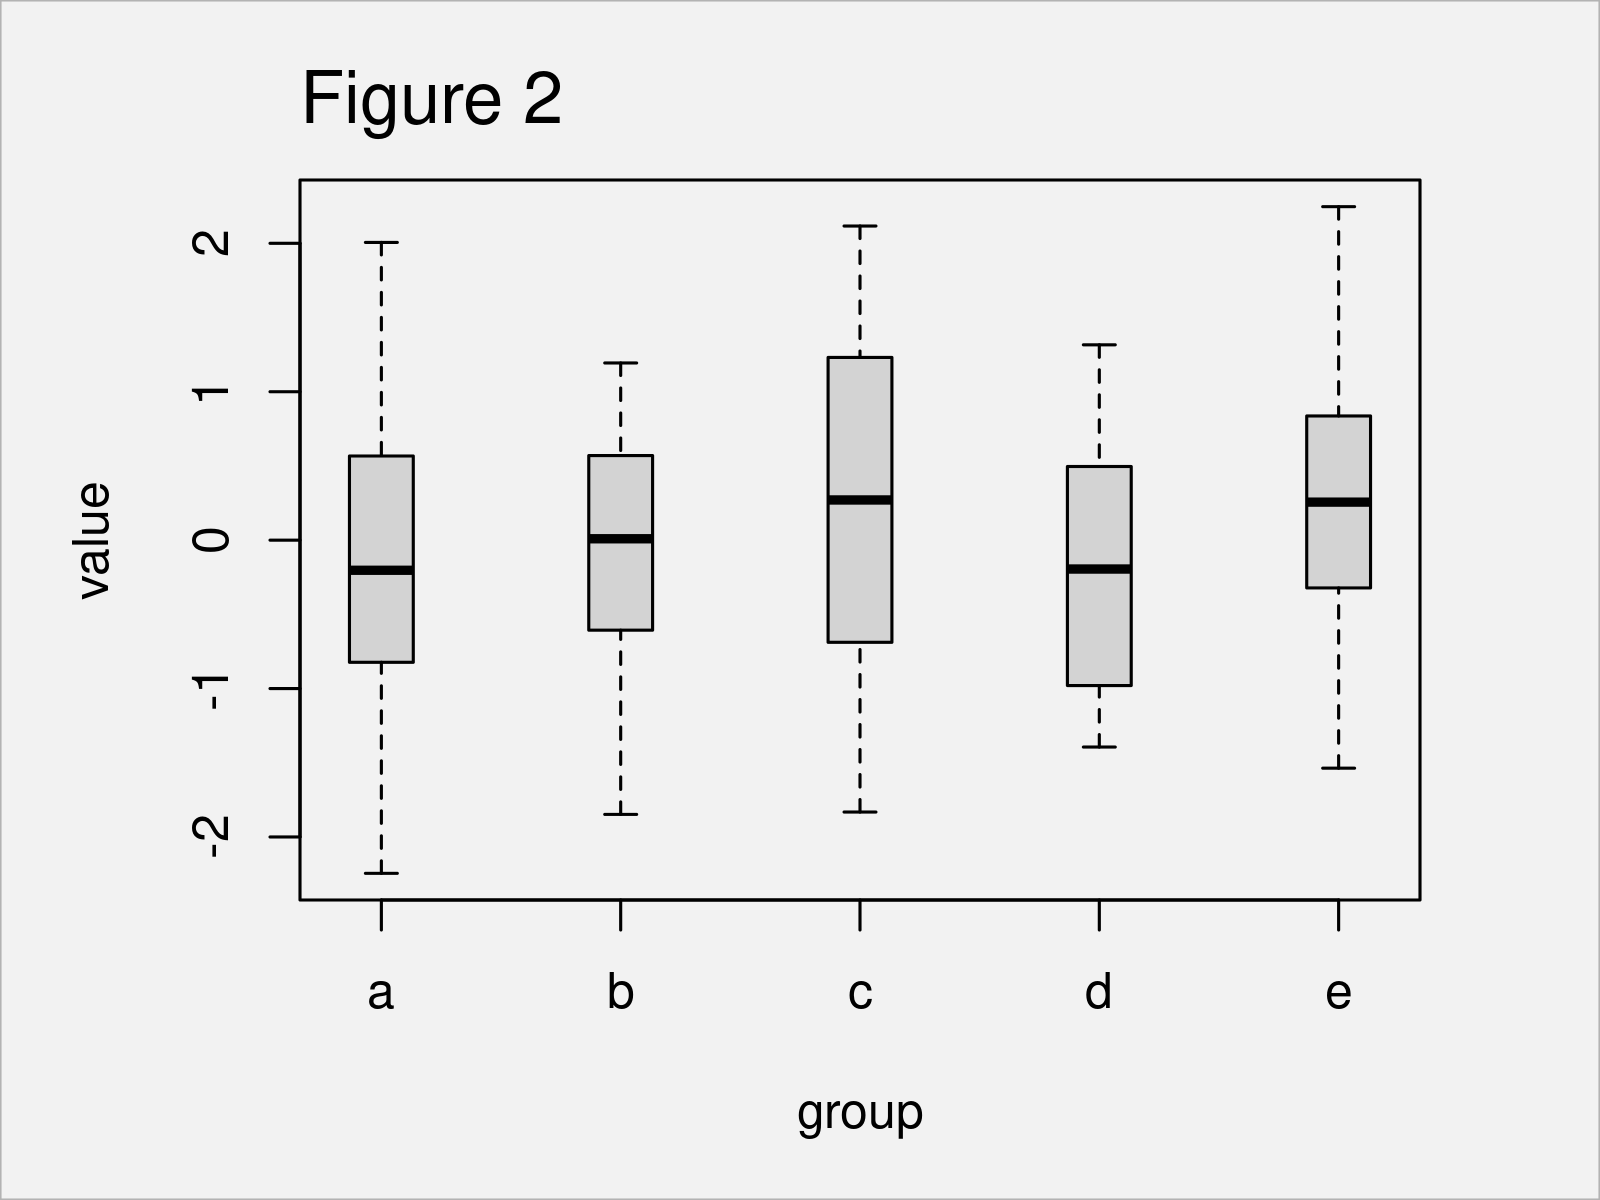
The output of the previous R programming code is shown in Figure 2 – A boxplot with increased space. Note that all spaces have the same width.
In the next part, I’ll explain how to set the axis positions of each boxplot manually.
Consider the following R code:
boxplot(value ~ group,        # Draw boxes at manual positions
        data,
        at = c(0, 2, 6, 8, 9))
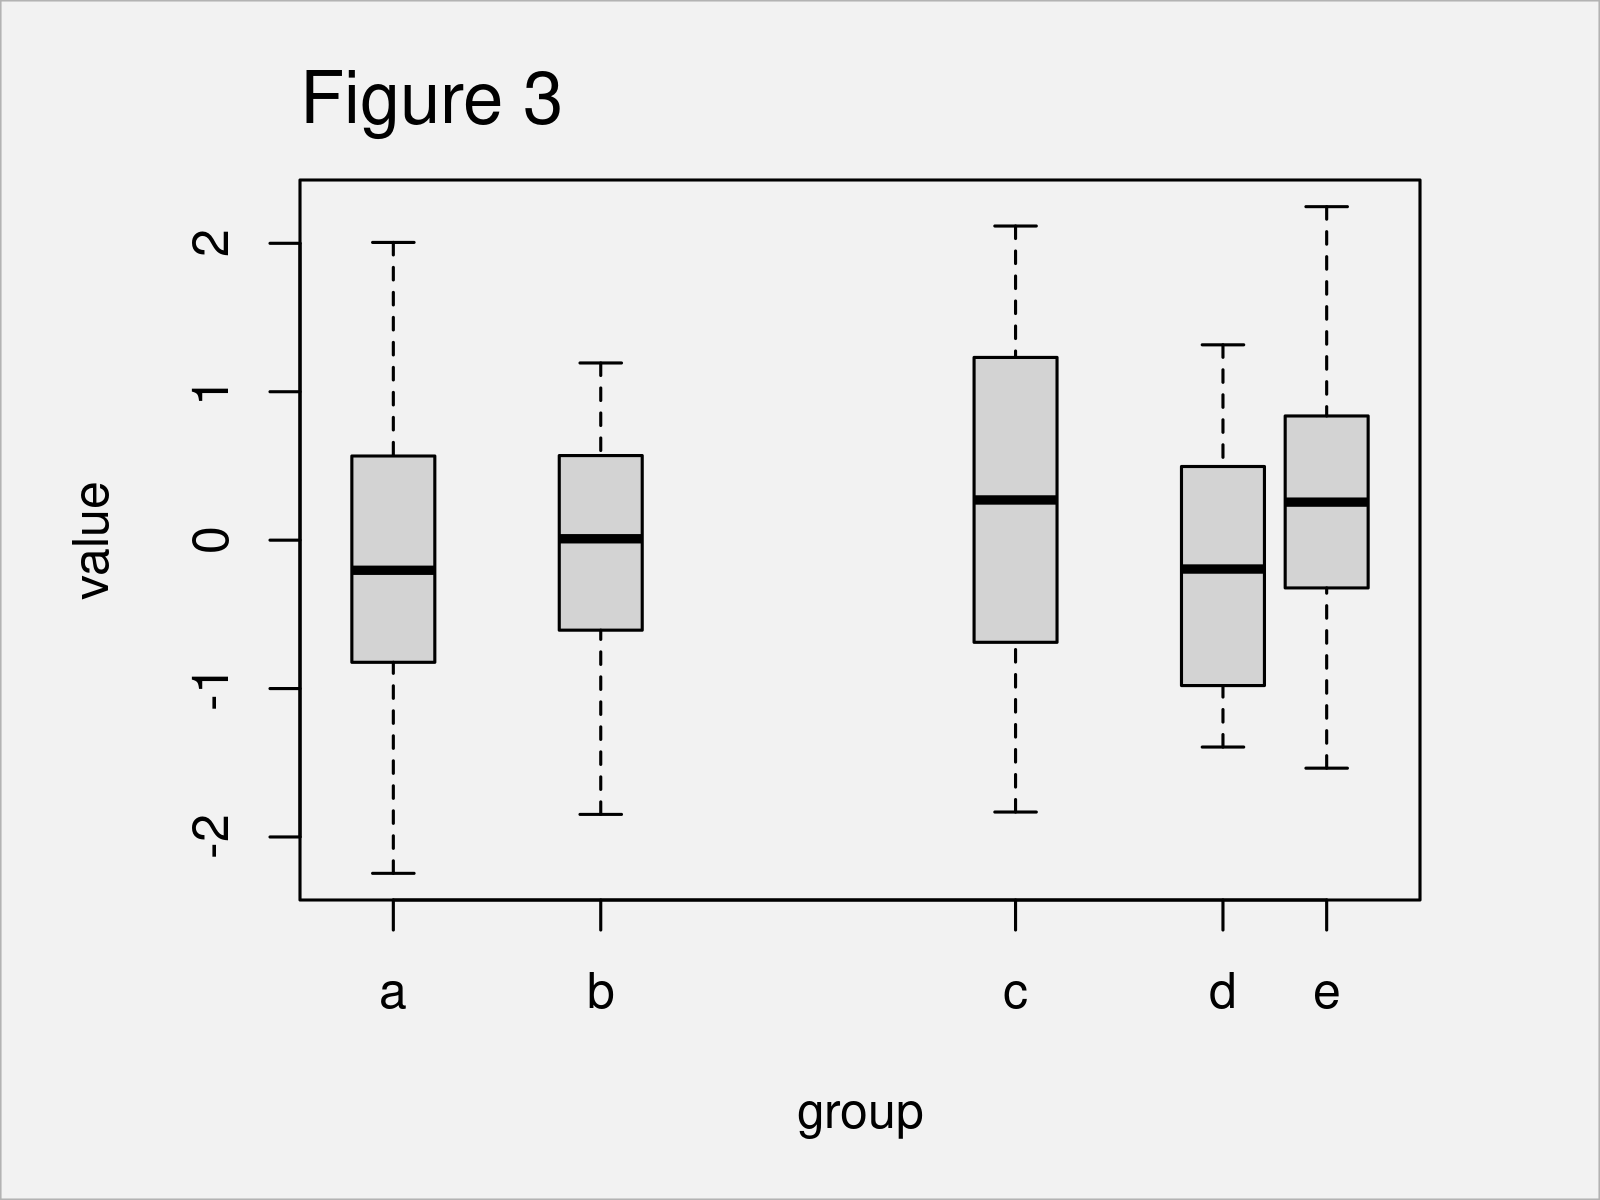
After running the previous R syntax the boxplot graph visualized in Figure 3 has been created. As you can see, the spaces between each of the boxplots have been defined manually.
Example 2: Modify Space Between Boxplots Using ggplot2 Package
Example 2 illustrates how to change the spaces between boxplots using the ggplot2 package.
First, we need to install and load the ggplot2 package:
install.packages("ggplot2")   # Install ggplot2 package
library("ggplot2")            # Load ggplot2
Next, we can draw a ggplot2 boxplot graph with default spaces as shown below:
ggplot(data,                  # Draw default boxplot
       aes(x = group,
           y = value)) +
  geom_boxplot()
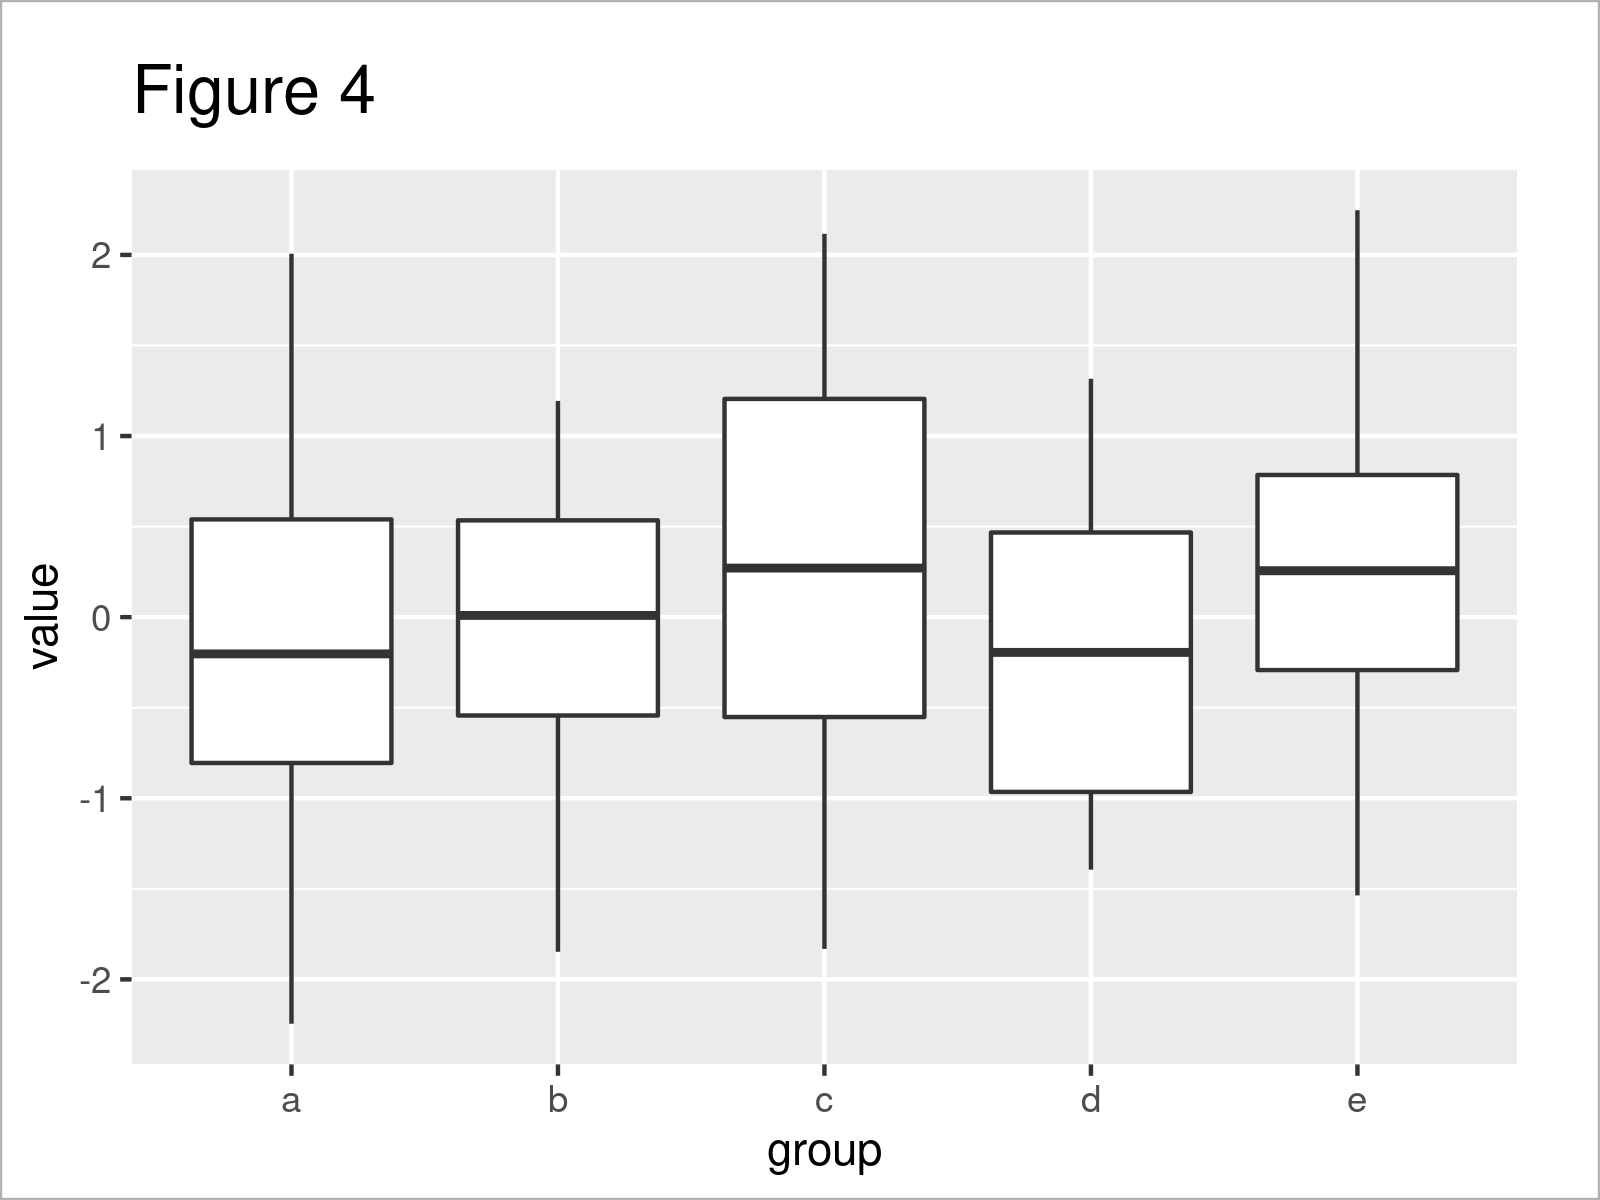
After executing the previous code the plot shown in Figure 4 has been created.
If we want to increase the space between the boxes, we can specify the width argument within the geom_boxplot function. In the following code, we decrease the width of the boxes to 0.3:
ggplot(data,                  # Change width between boxes
       aes(x = group,
           y = value)) +
  geom_boxplot(width = 0.3)
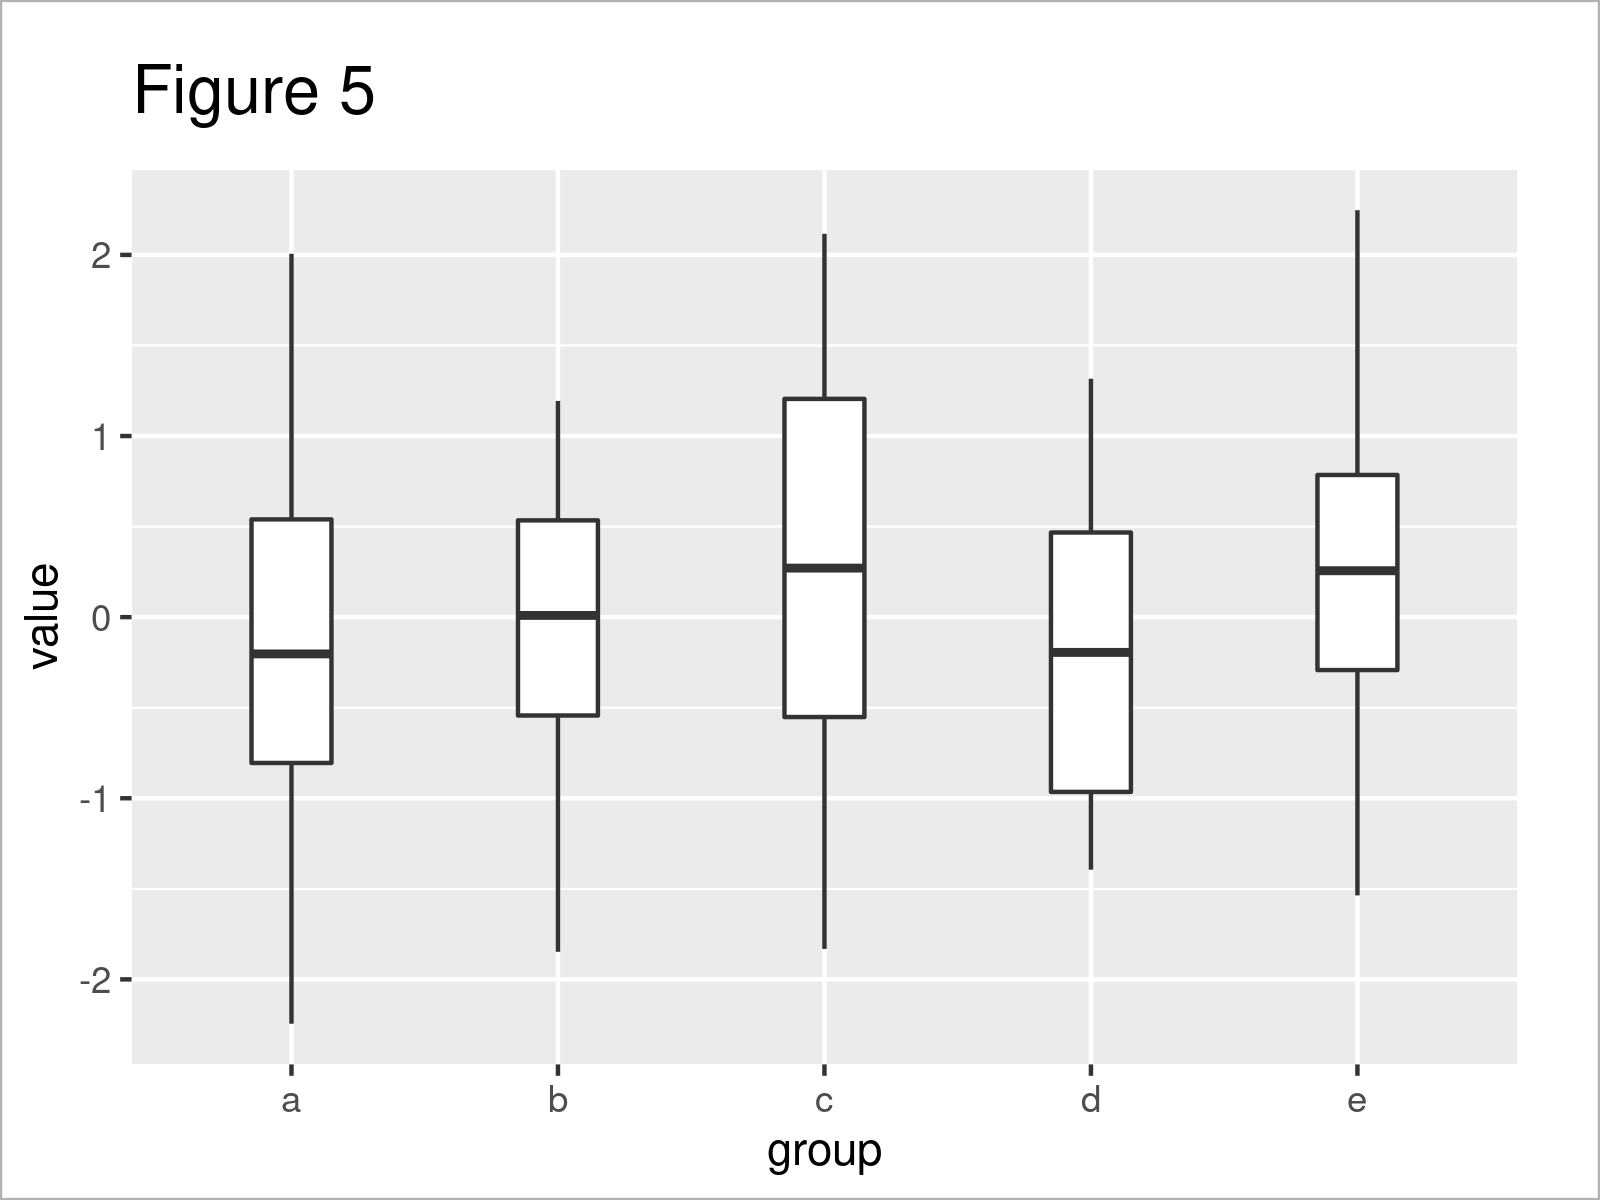
By executing the previous R syntax we have drawn Figure 5, i.e. a ggplot2 boxplot graphic with thinner boxes.
Please note that I have not found a way to specify the location of each ggplot2 boxplot manually. I’m sure this must be possible somehow, so please let me know in the comments section, in case you know how to do this.
Video & Further Resources
Would you like to learn more about the modification of the space between boxplots? Then you may watch the following video on my YouTube channel. I demonstrate the examples of this page in the video.
In addition, you could have a look at some of the other tutorials on statisticsglobe.com. Some tutorials on similar topics such as labels, plot legends, and ggplot2 can be found below.
- Increase Space Between ggplot2 Facet Plot Panels
- Change Space & Width of Bars in ggplot2 Barplot
- Change Spacing Between Horizontal Legend Items of ggplot2 Plot
- Adjust Space Between ggplot2 Axis Labels and Plot Area
- Drawing Plots in R
- The R Programming Language
In summary: On this page, I have demonstrated how to change the space between discrete values in boxplots in the R programming language. If you have additional questions, let me know in the comments below.


2 Comments. Leave new
Hi, Have you found a way to specify the location of each ggplot2 boxplot manually? Thanks in advance.
Hello Eli,
Please check this solution:
Here, The first two boxplots are closer to each other and the third one is far apart from them.
Best,
Cansu