Set Column Names when Using cbind Function in R (2 Examples)
In this R tutorial you’ll learn how to rename columns when using the cbind function.
The article consists of these content blocks:
Let’s get started!
Creation of Example Data
The following data will be used as basement for this R tutorial. Let’s create a character vector…
vec1 <- letters[3:7]                    # Create first example vector
vec1                                    # Print first example vector
# [1] "c" "d" "e" "f" "g"
…and a numeric vector:
vec2 <- 8:4                             # Create second example vector
vec2                                    # Print second example vector
# [1] 8 7 6 5 4
Next, we’ll merge these data!
Example 1: Rename Column Names After Column-Binding Using colnames() Function
This example shows how to rename the columns after binding the data. First, let’s apply the cbind function to join our vectors:
data1 <- cbind(vec1, vec2)              # Applying cbind
data1                                   # Print updated data

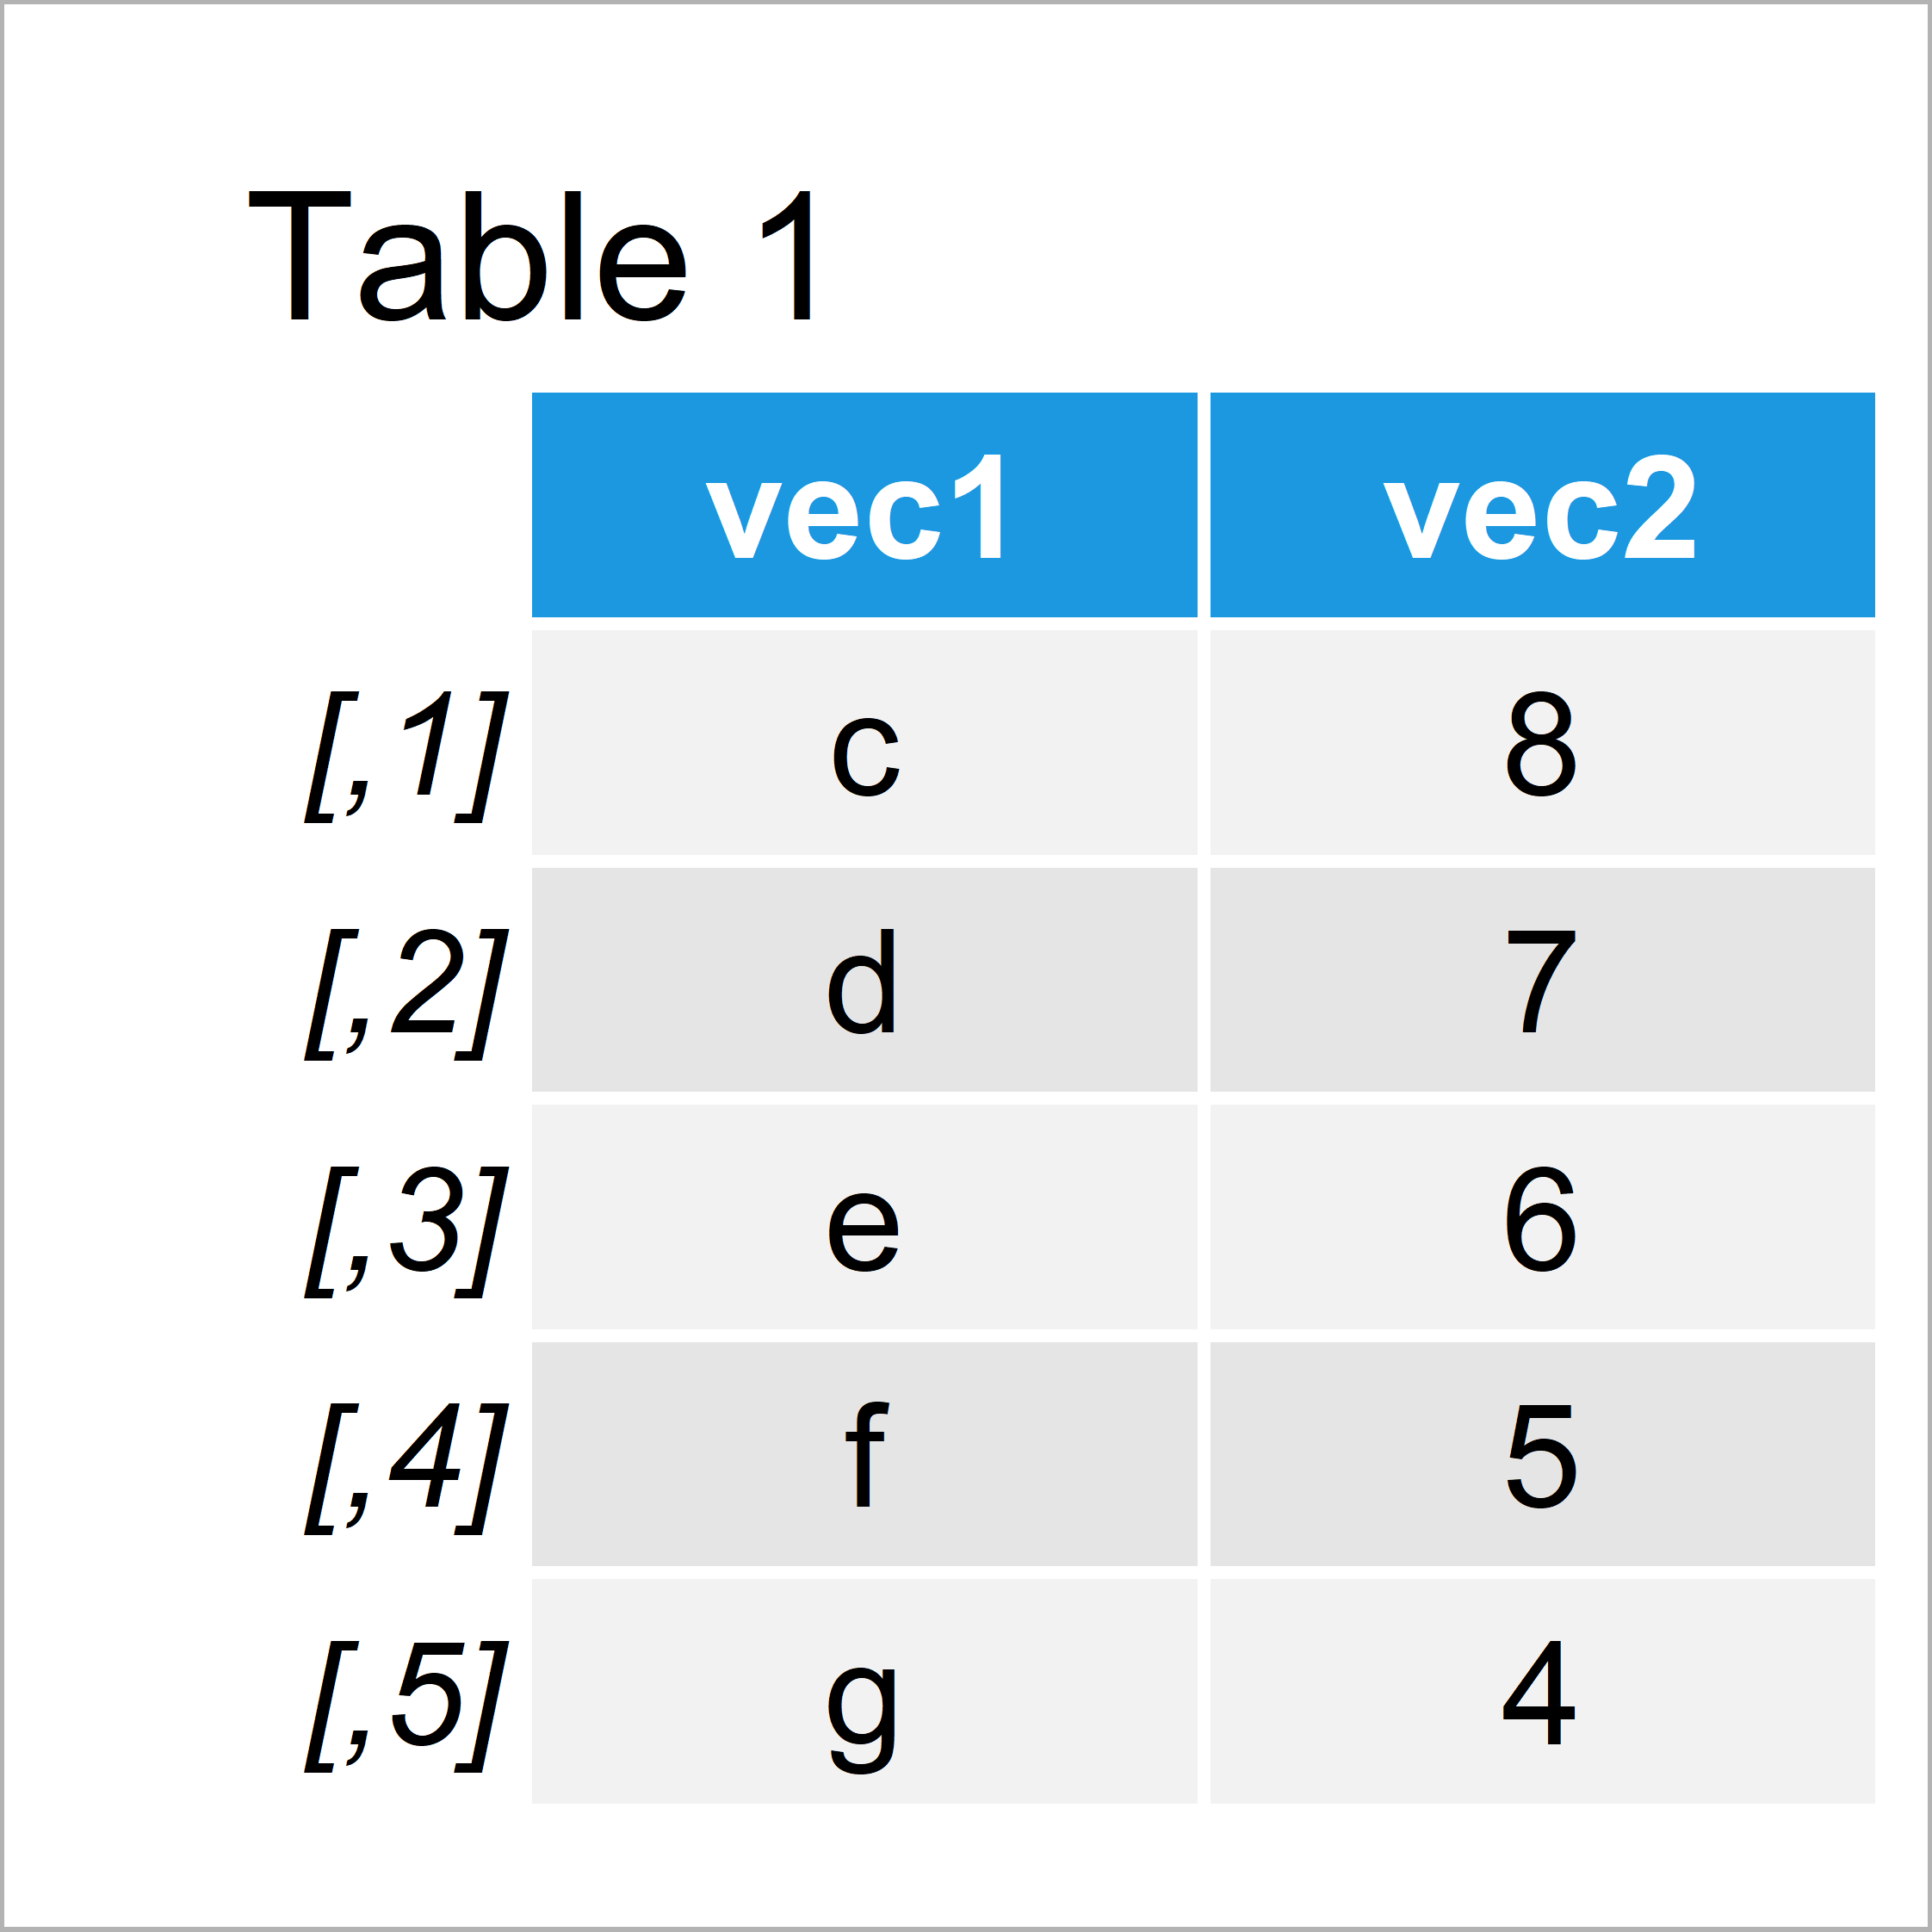
Table 1 illustrates the RStudio console output of the previous R code. As you can see, the variables of our new data matrix are named according to the input vectors.
We can now change these variable names using the colnames function:
colnames(data1) <- c("col1", "col2")    # Applying colnames
data1                                   # Print updated data

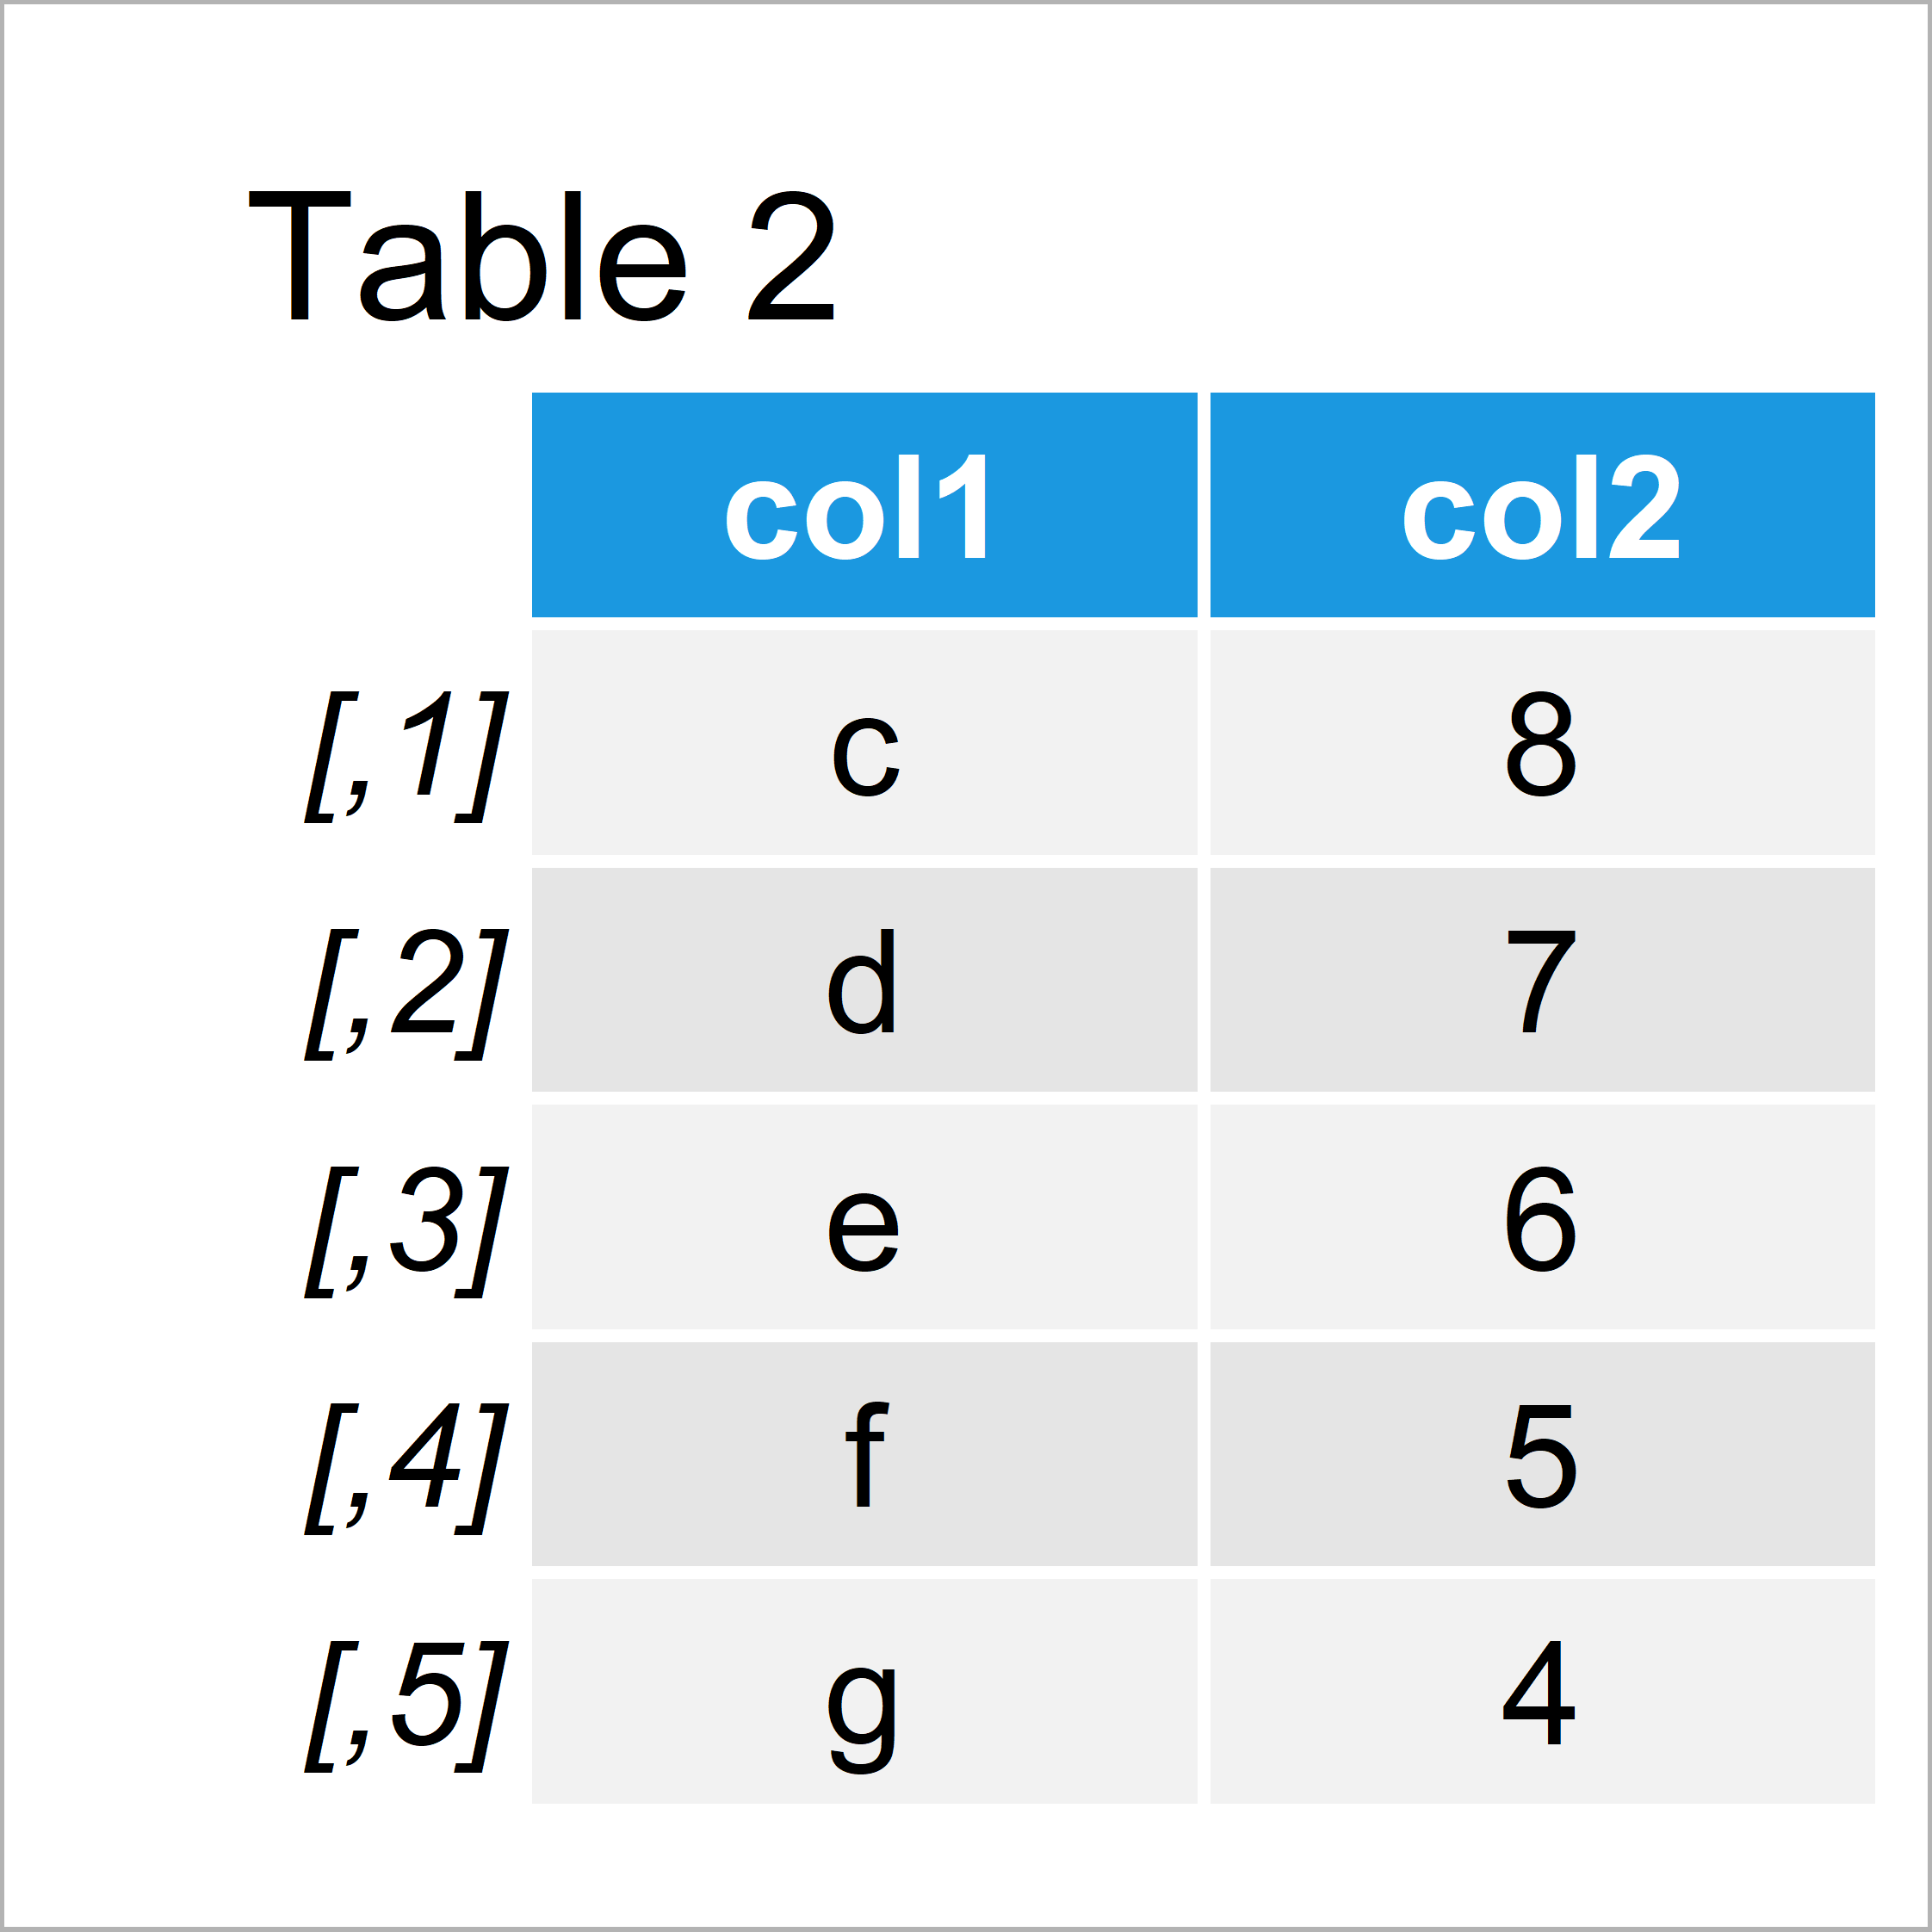
The output of the previously executed R code is shown in Table 2: The same data matrix, but with different column names.
The 2-step approach that we have used in this example is quite straight forward. However, in the next example I’ll show an even smoother way to define the column names of our data.
Keep on reading!
Example 2: Define Column Names within cbind() Function
In this section, I’ll explain how to specify column names directly within the cbind function.
Have a look at the R syntax below:
data2 <- cbind(x1 = vec1, x2 = vec2)    # Applying cbind with names
data2                                   # Print updated data

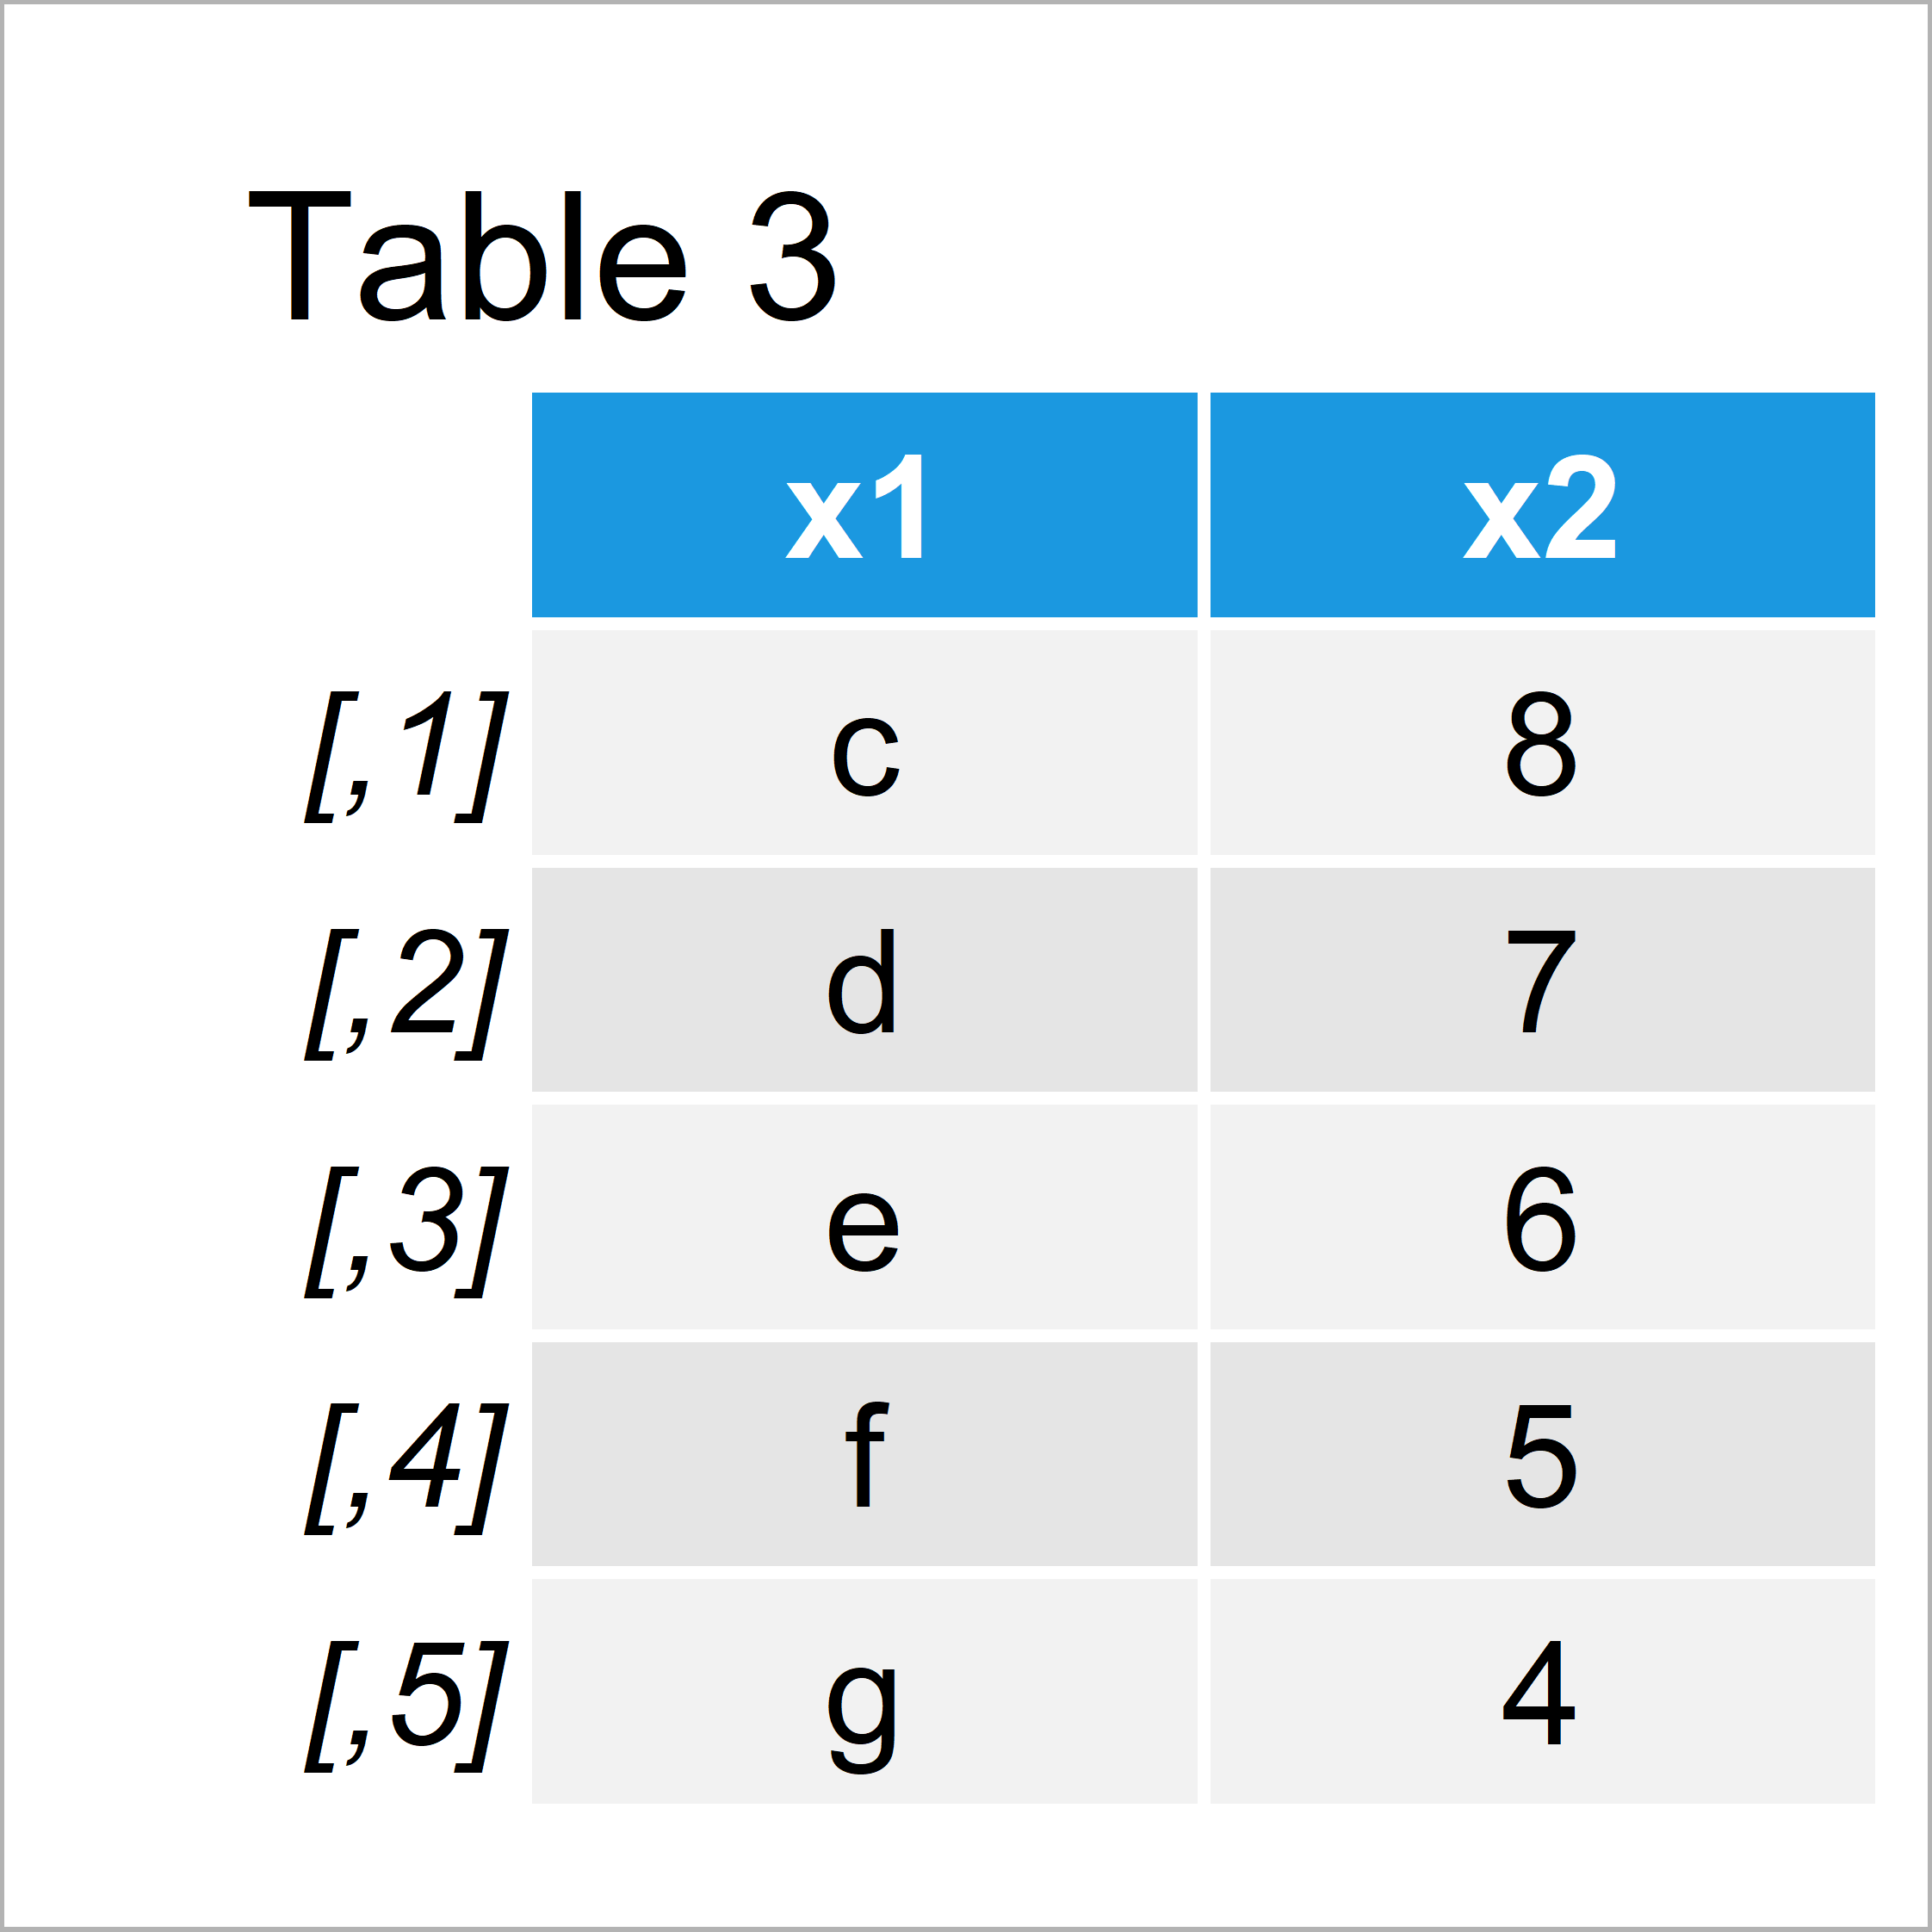
After running the previous R programming syntax the data matrix shown in Table 3 has been created.
As you can see, the variables were automatically named as we wanted. We don’t need to use the colnames function anymore.
Video & Further Resources
Do you need further explanations on the R syntax of this tutorial? Then you may want to watch the following video of my YouTube channel. In the video, I’m illustrating the topics of this article in a live session.
Furthermore, you might want to have a look at the other tutorials of https://statisticsglobe.com/.
- Merge Data Frames by Column Names in R
- Assign Column Names Based On Existing Row
- Sort Variables of Data Frame by Column Names
- Specify Column Names for X & Y when Joining with dplyr Package
- Built-in R Functions (Programming Examples)
- All R Programming Tutorials
In summary: At this point you should know how to set up variable names in the cbind function in R programming. Let me know in the comments, if you have additional comments or questions.


