Overlay ggplot2 Boxplot with Line in R (Example)
In this post, I’ll demonstrate how to add a line to a ggplot2 boxplot in the R programming language.
The article will contain this:
Let’s start right away!
Example Data, Packages & Default Graph
Initially, we’ll have to create some data that we can use in the example below:
set.seed(28736)            # Create example data
data <- data.frame(values = rnorm(100),
                   group = LETTERS[1:5])
head(data)                 # Print head of example data

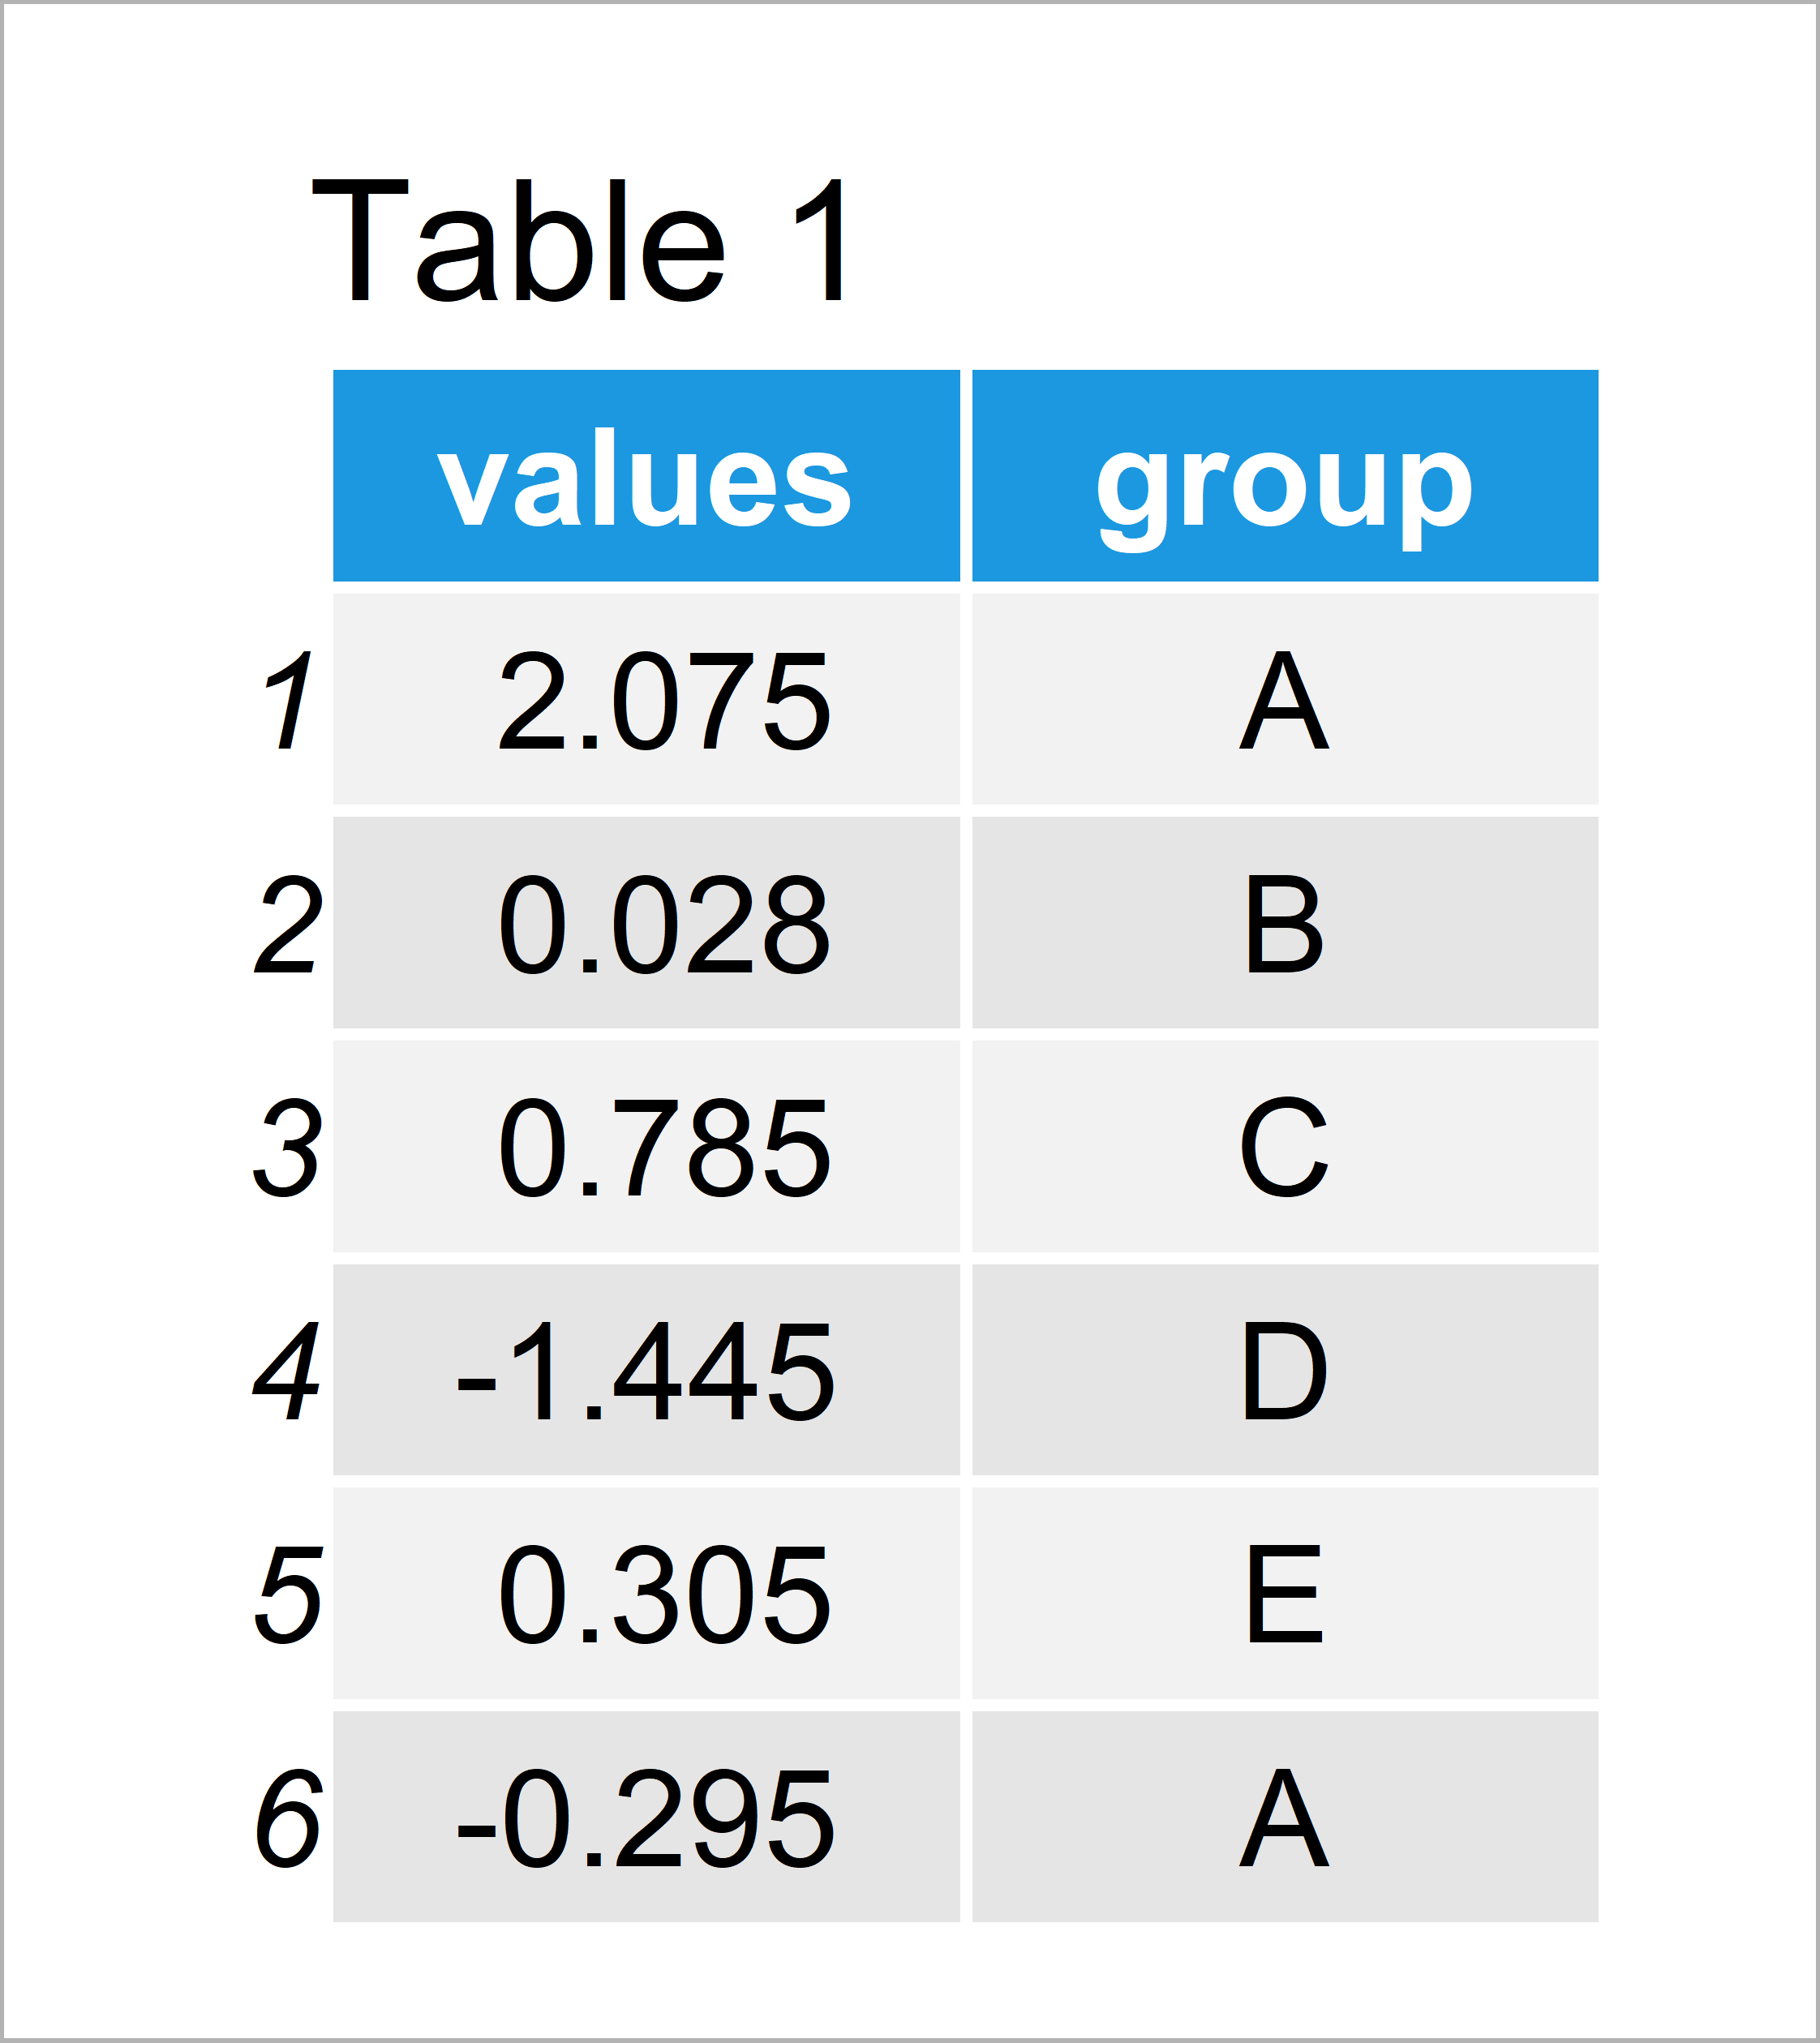
Have a look at the table that got returned after running the previous code. It shows the first six rows of our example data, and that our data has two columns called “values” and “group”. The column values is numerical and the variable group is a character.
In this R programming tutorial, we’ll also have to install and load the ggplot2 package:
install.packages("ggplot2")# Install ggplot2 package
library("ggplot2")         # Load ggplot2 package
Now, we can plot our data as follows:
ggp <- ggplot(data,        # Create ggplot2 boxplot
              aes(x = values,
                  y = group)) +
  geom_boxplot() +
  coord_flip()
ggp                        # Draw ggplot2 boxplot

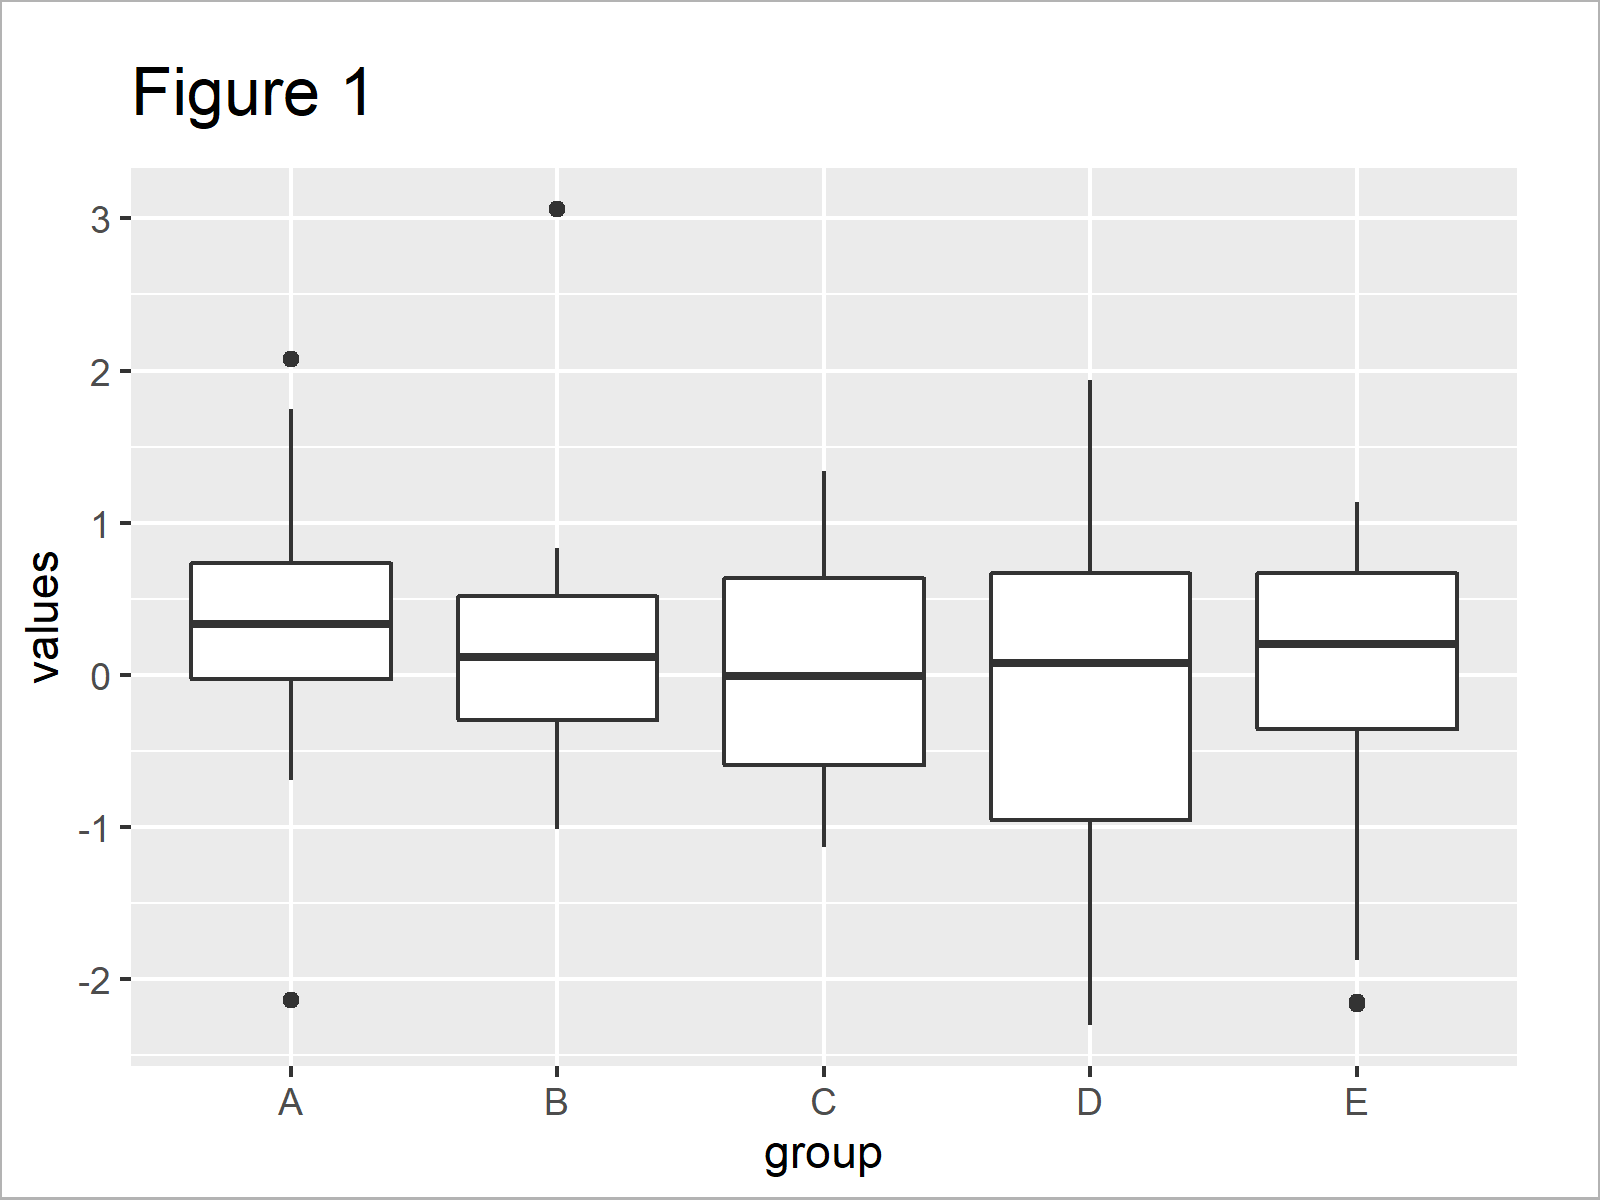
As shown in Figure 1, we have created a ggplot2 boxplot. However, this boxgraph does not contain a line yet.
Example: Add Line to ggplot2 Boxplot Using stat_summary() Function
The syntax below shows how to overlay a ggplot2 boxplot with a line using the stat_summary function of the ggplot2 package.
In this example we’ll overlay our boxplot with a line that illustrates the medians of our boxplots.
Have a look at the following R code:
ggp +                      # Add median line to boxplot
  stat_summary(fun = median,
               geom = "line",
               aes(group = 1),
               col = "red")

In Figure 2 it is shown that we have created a boxplot with a median line on top. For instance, this could be used to show the median change over time in a time series plot.
Video, Further Resources & Summary
Have a look at the following video on my YouTube channel. In the video, I’m explaining the content of the present tutorial in a live session.
In addition, you may want to have a look at the other tutorials of this website. You can find a selection of articles about topics such as ggplot2, graphics in R, and plot legends here.
- Control Line Color & Type in ggplot2 Plot Legend
- Change Color of ggplot2 Boxplot
- Change Colors in ggplot2 Line Plot
- Ignore Outliers in ggplot2 Boxplot
- Plots in R
- All R Programming Tutorials
In this tutorial, I have illustrated how to draw lines and boxplots in the same ggplot2 graphic in the R programming language. Tell me about it in the comments section below, in case you have further questions. Furthermore, don’t forget to subscribe to my email newsletter in order to get updates on new articles.


