R ggplot2 Warning Message: Removed rows containing missing values
In this R article you’ll learn how to replicate and fix the ggplot2 warning message “Removed X rows containing missing values”.
The table of content looks as follows:
Let’s get started…
Example Data, Packages & Basic Graph
Have a look at the following example data:
data <- data.frame(x = 1:5,         # Create example data
                   y = 1:5)
data                                # Print example data

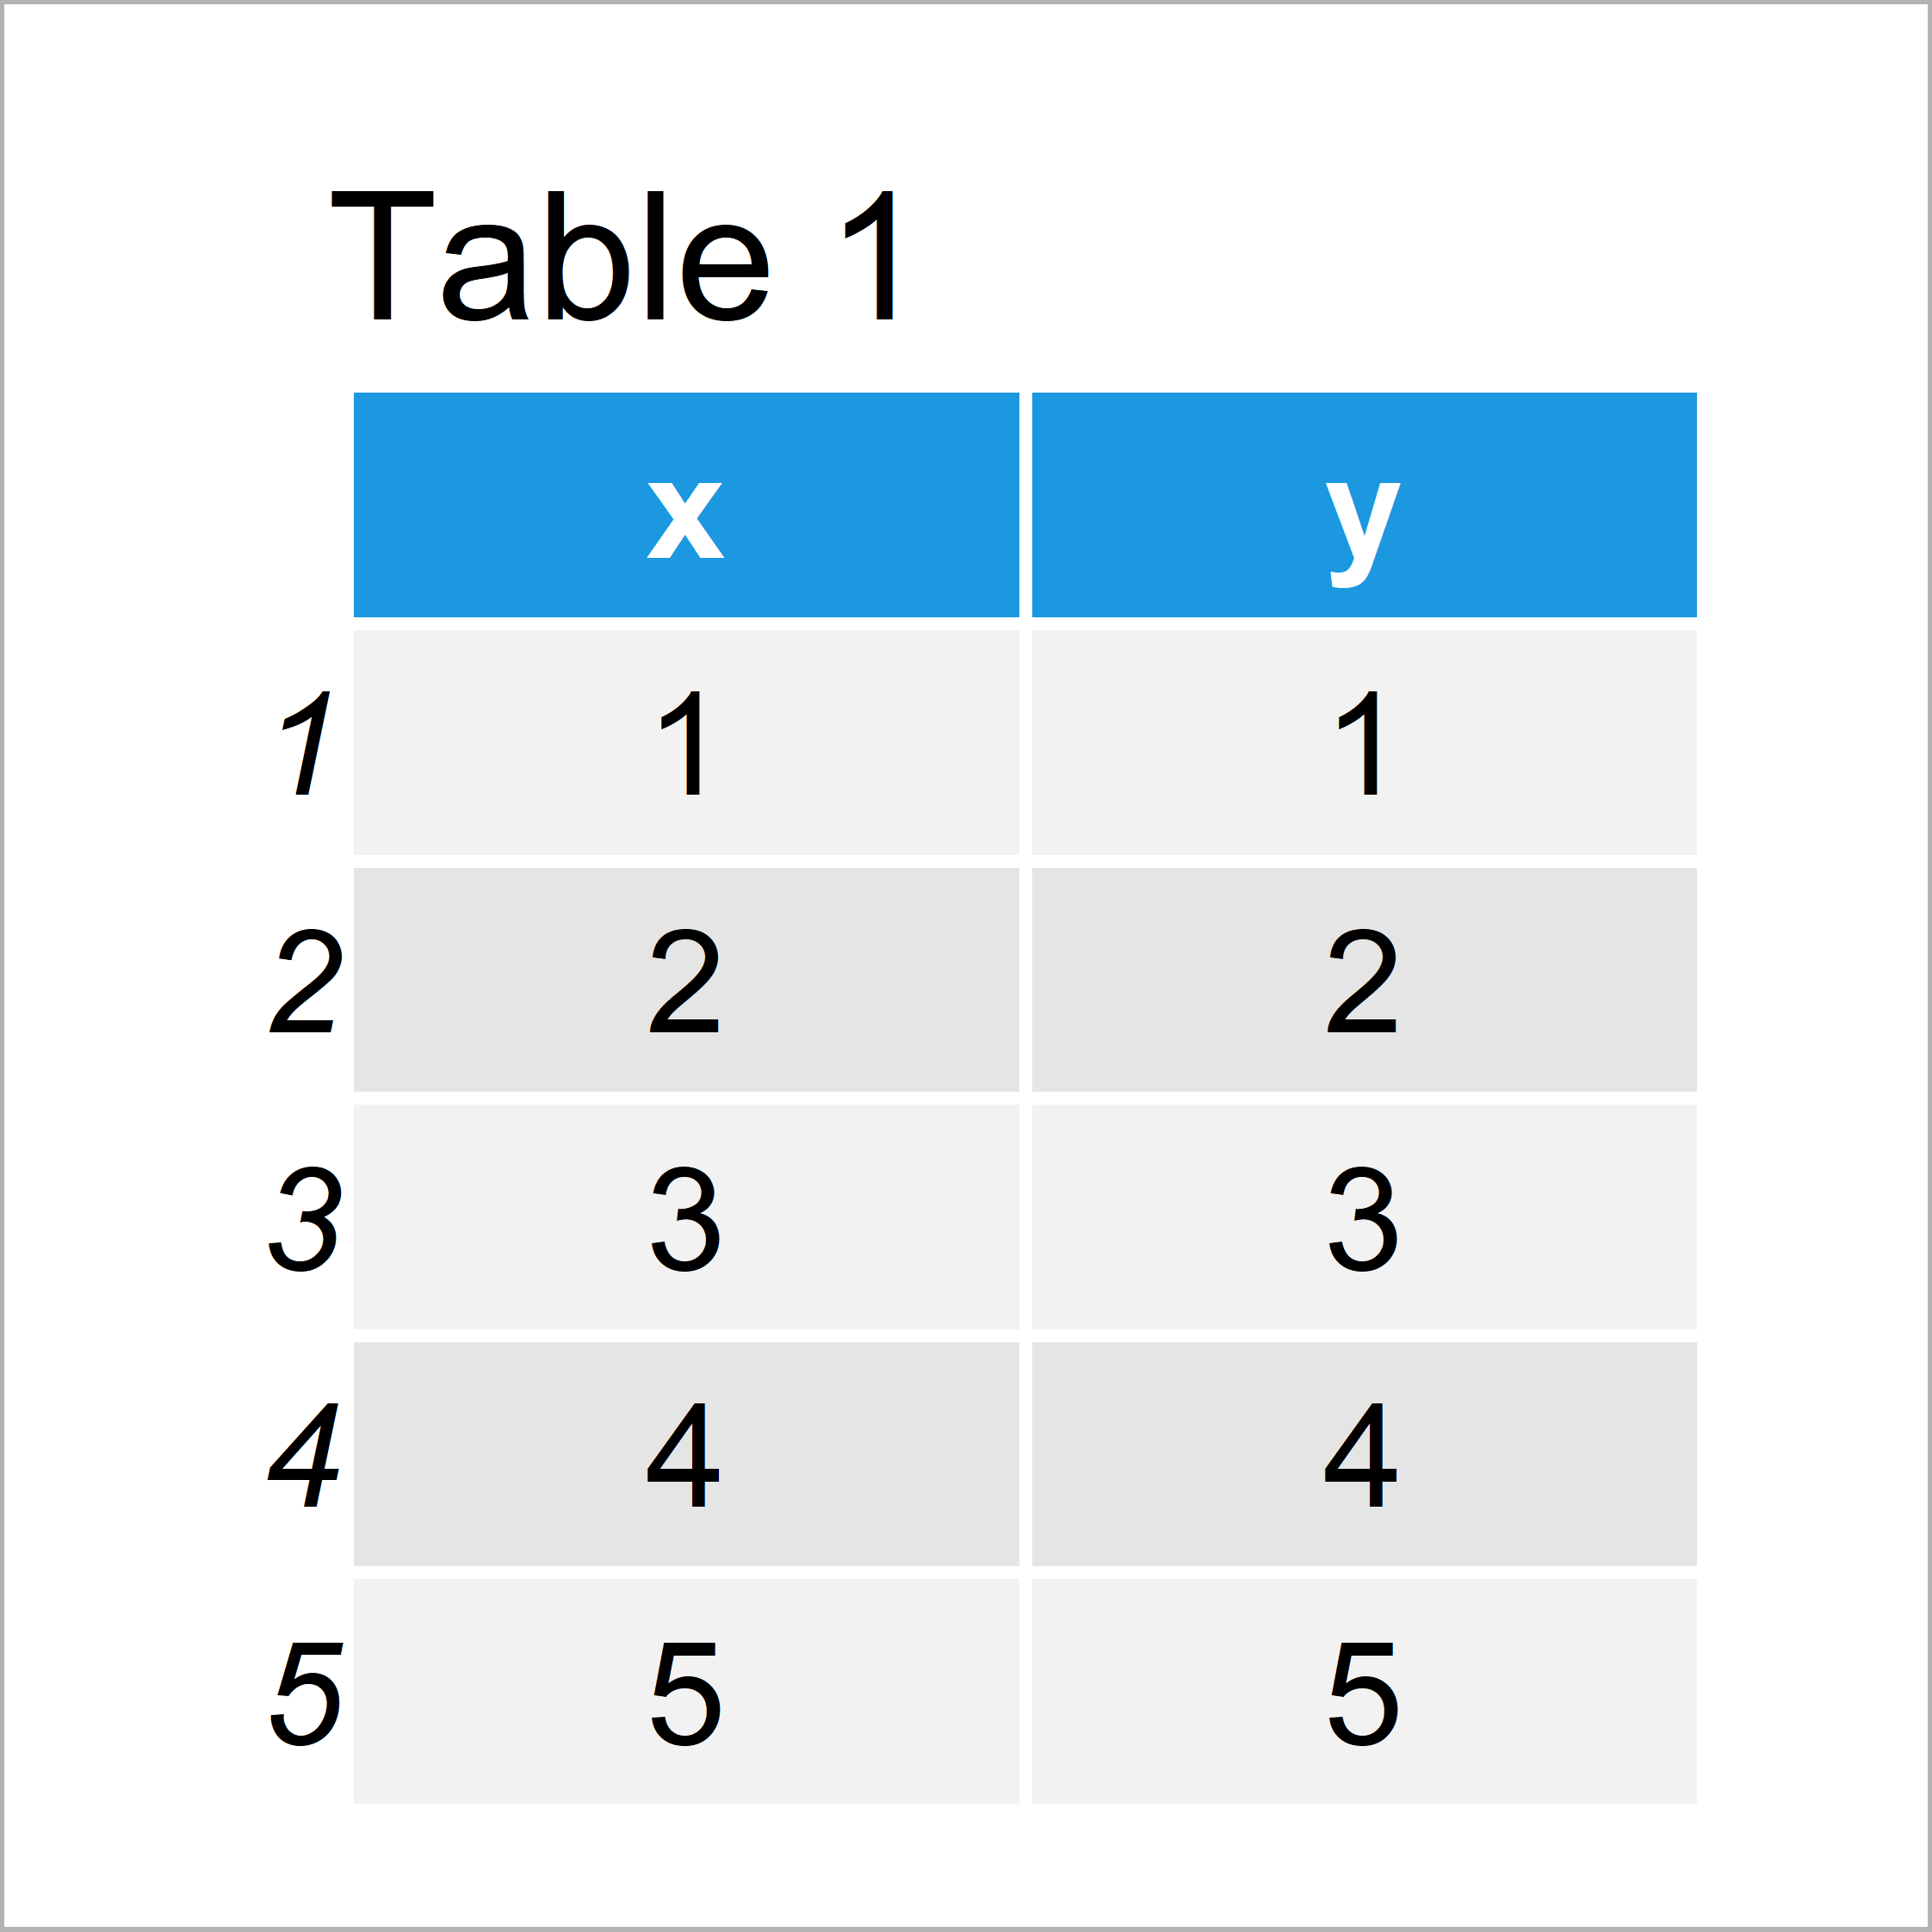
As you can see based on Table 1, our example data is a data frame and comprises five rows and two numeric columns.
If we want to use the functions of the ggplot2 package, we also have to install and load ggplot2:
install.packages("ggplot2")         # Install ggplot2 package
library("ggplot2")                  # Load ggplot2
As next step, we can plot our data:
ggp <- ggplot(data, aes(x, y)) +    # Create ggplot2 with default axis limits
  geom_point()
ggp                                 # Draw ggplot2 plot

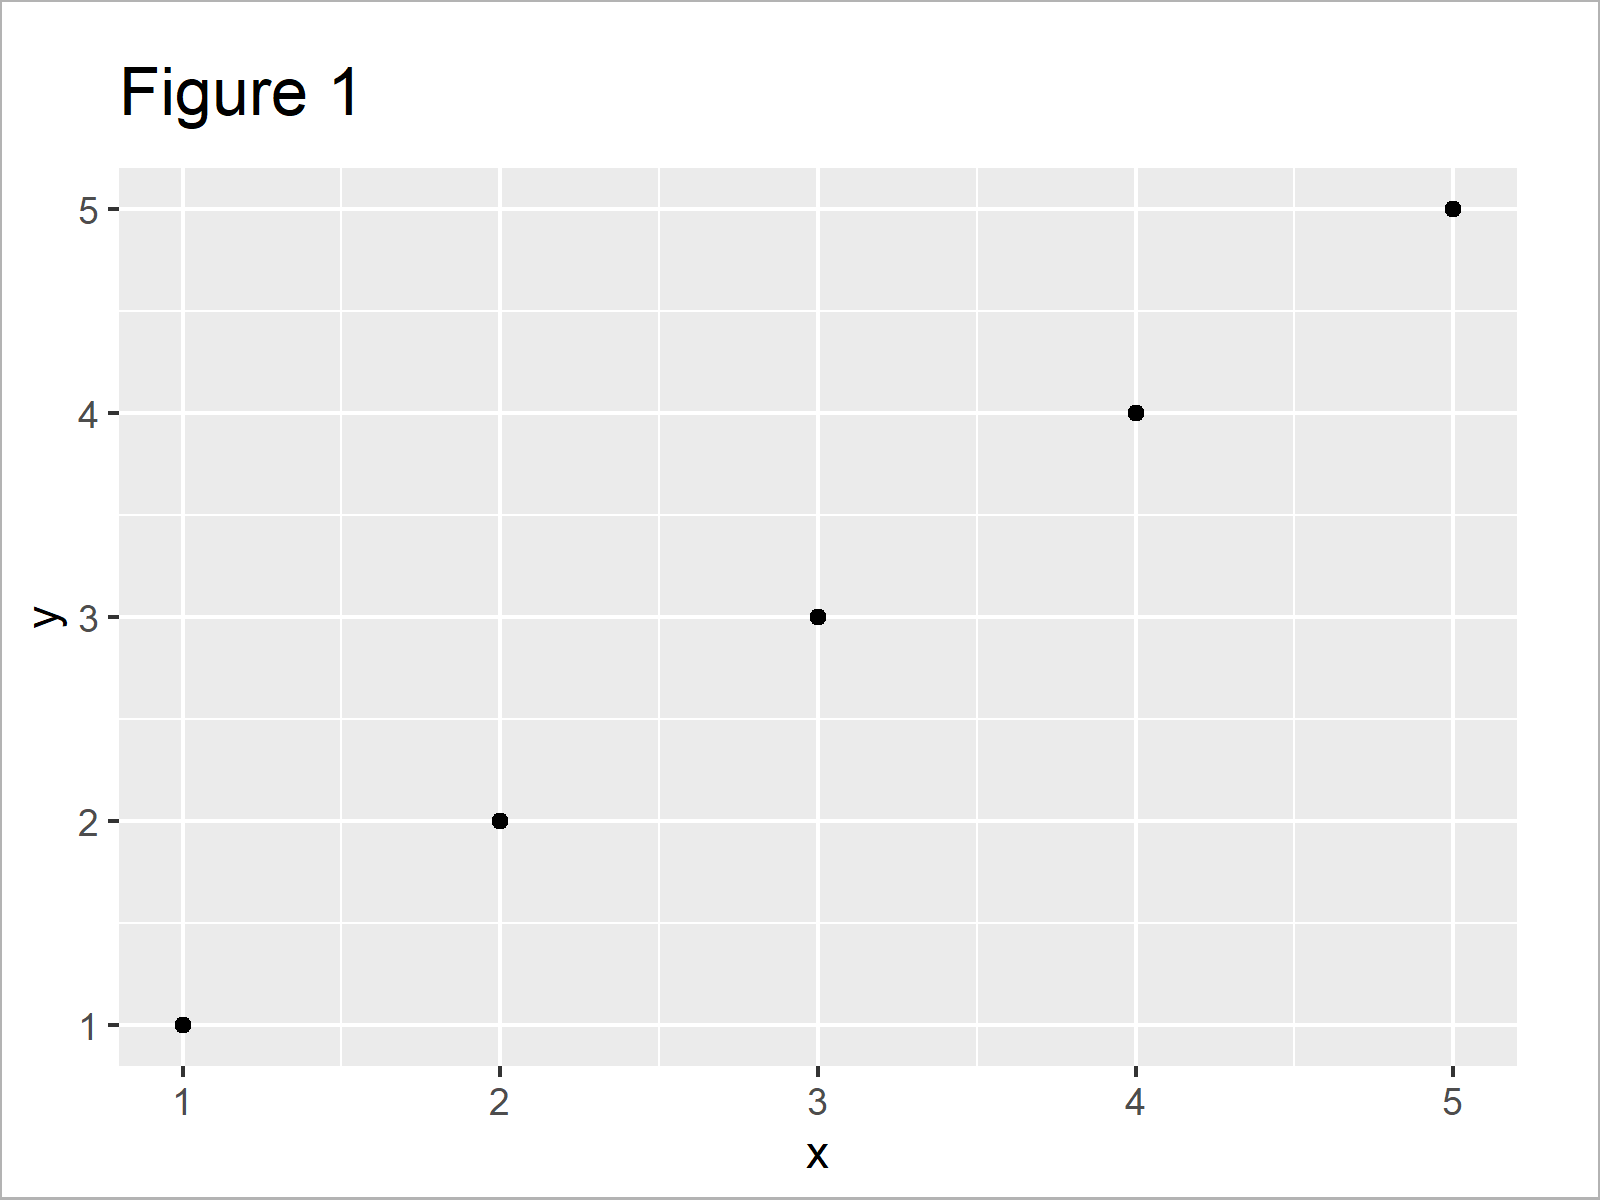
In Figure 1 it is shown that we have created a scatterplot showing five data points.
Example: Reproduce the Warning Message – Removed X rows containing missing values
The following R programming code illustrates how to create the warning message “Removed X rows containing missing values”.
Let’s assume that we want to manually create axis limits in our ggplot2 graphic. Then, we can use the scale_x_continuous function as shown below:
ggp +                               # Modify axis limits
  scale_x_continuous(limits = c(2, 5))
# Warning message:
#   Removed 1 rows containing missing values (geom_point).

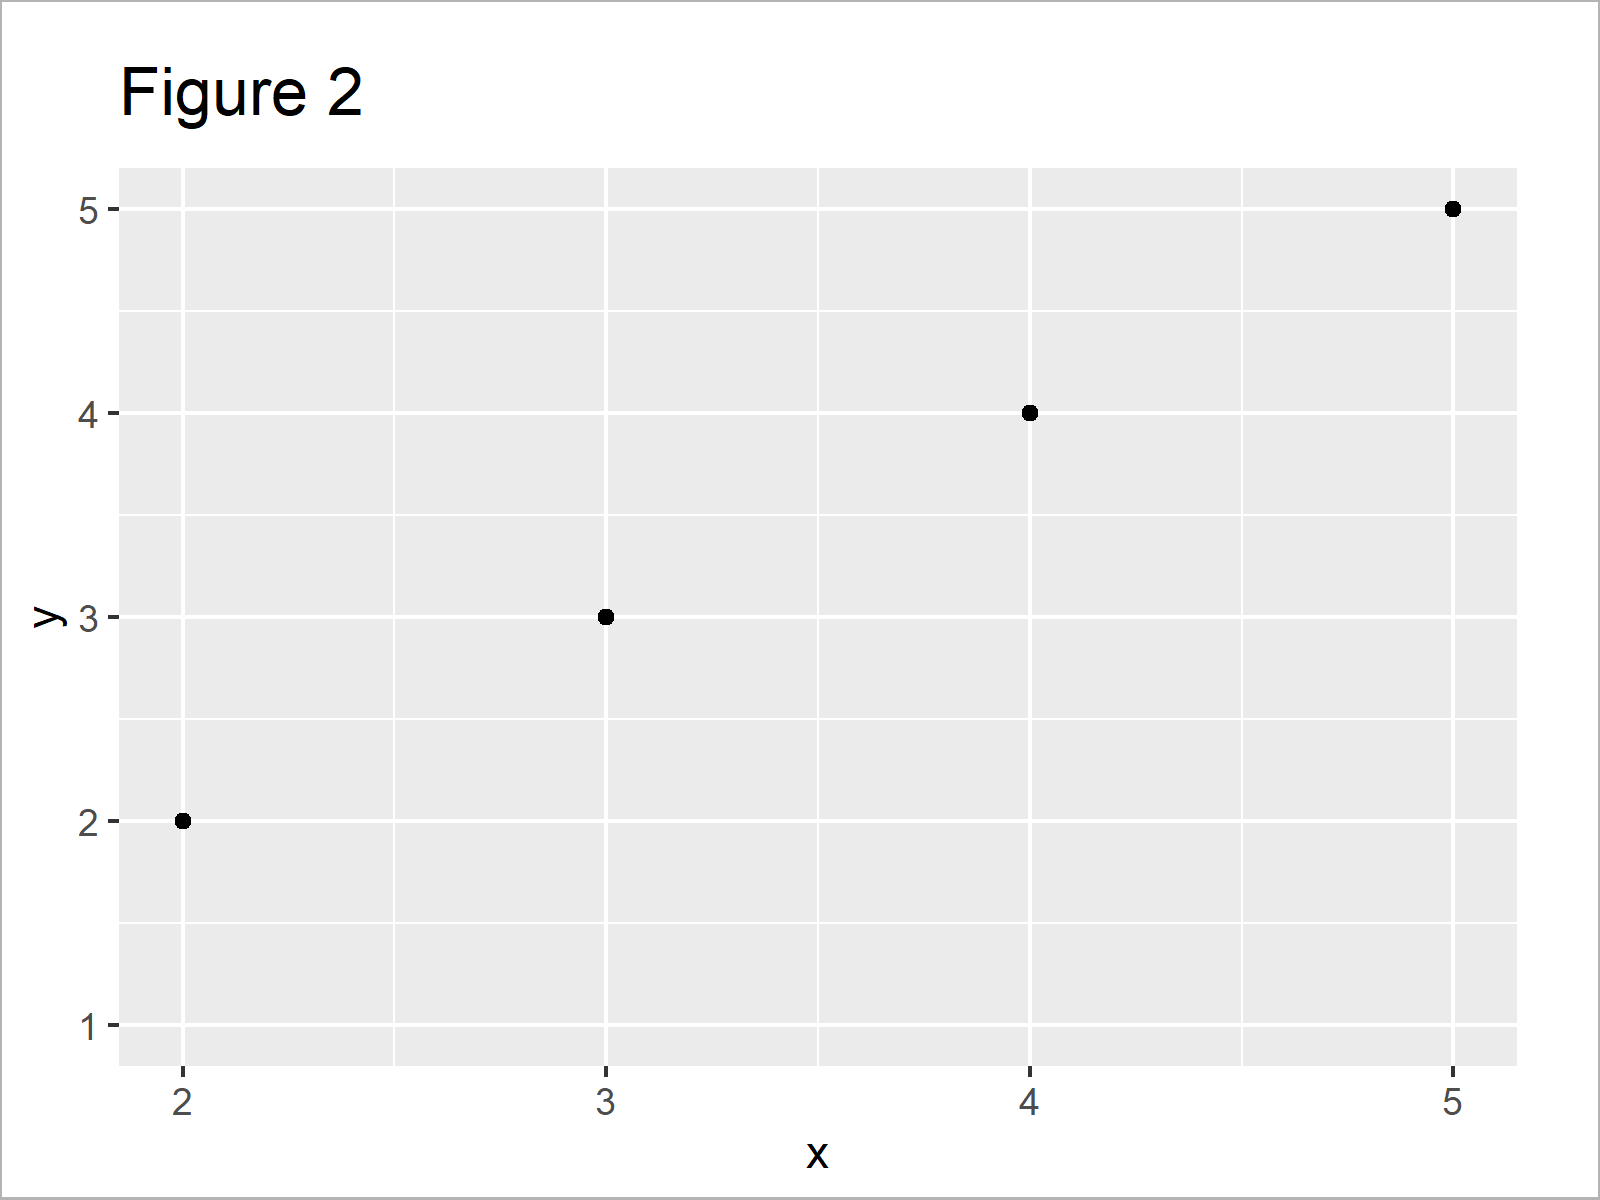
After running the previous R syntax the scatterplot with narrower x-axis limits shown in Figure 2 has been created.
You can also see in the RStudio console that the warning message “Removed 1 rows containing missing values (geom_point).” has been returned.
The reason for that is that we have cut-off some data points from our plot by setting manual axis limits.
This is only a warning – So if you have intended to remove certain values from your plot this is not a problem.
However, when you see this warning message you should check whether any important data points have been removed.
I have recently published a tutorial that explains how to properly zoom into ggplot plots without removing any data. You can find it here.
Video, Further Resources & Summary
The ggplot2 package has of course much more of useful and awesome functions and opportunities when it comes to data visualization in R. May you have a look at the following introduction video on my YouTube channel.
Furthermore, you may want to have a look at some of the other articles of my website:
You have learned in this article how to deal with the warning “Removed X rows containing missing values” in the R programming language. Let me know in the comments section below, in case you have further questions.


2 Comments. Leave new
excellent, I solved this long pending problem in R, within a few seconds. Thank you
Hey Ganapathy,
Thanks a lot for the kind feedback, glad the tutorial was helpful!
Regards,
Joachim