Force Plot Axes to Start at Zero in R (2 Examples)
In this R tutorial you’ll learn how to set the start of x- and y-axes to zero.
The content looks as follows:
So now the part you have been waiting for – the examples:
Creation of Example Data
Have a look at the following example data:
x <- 5:10                      # Create example data
y <- 3:8
Our example data are two numeric vectors with six vector elements each.
As next step, we can plot these data in a scatterplot using the plot() function:
plot(x, y) # Plot with default specifications

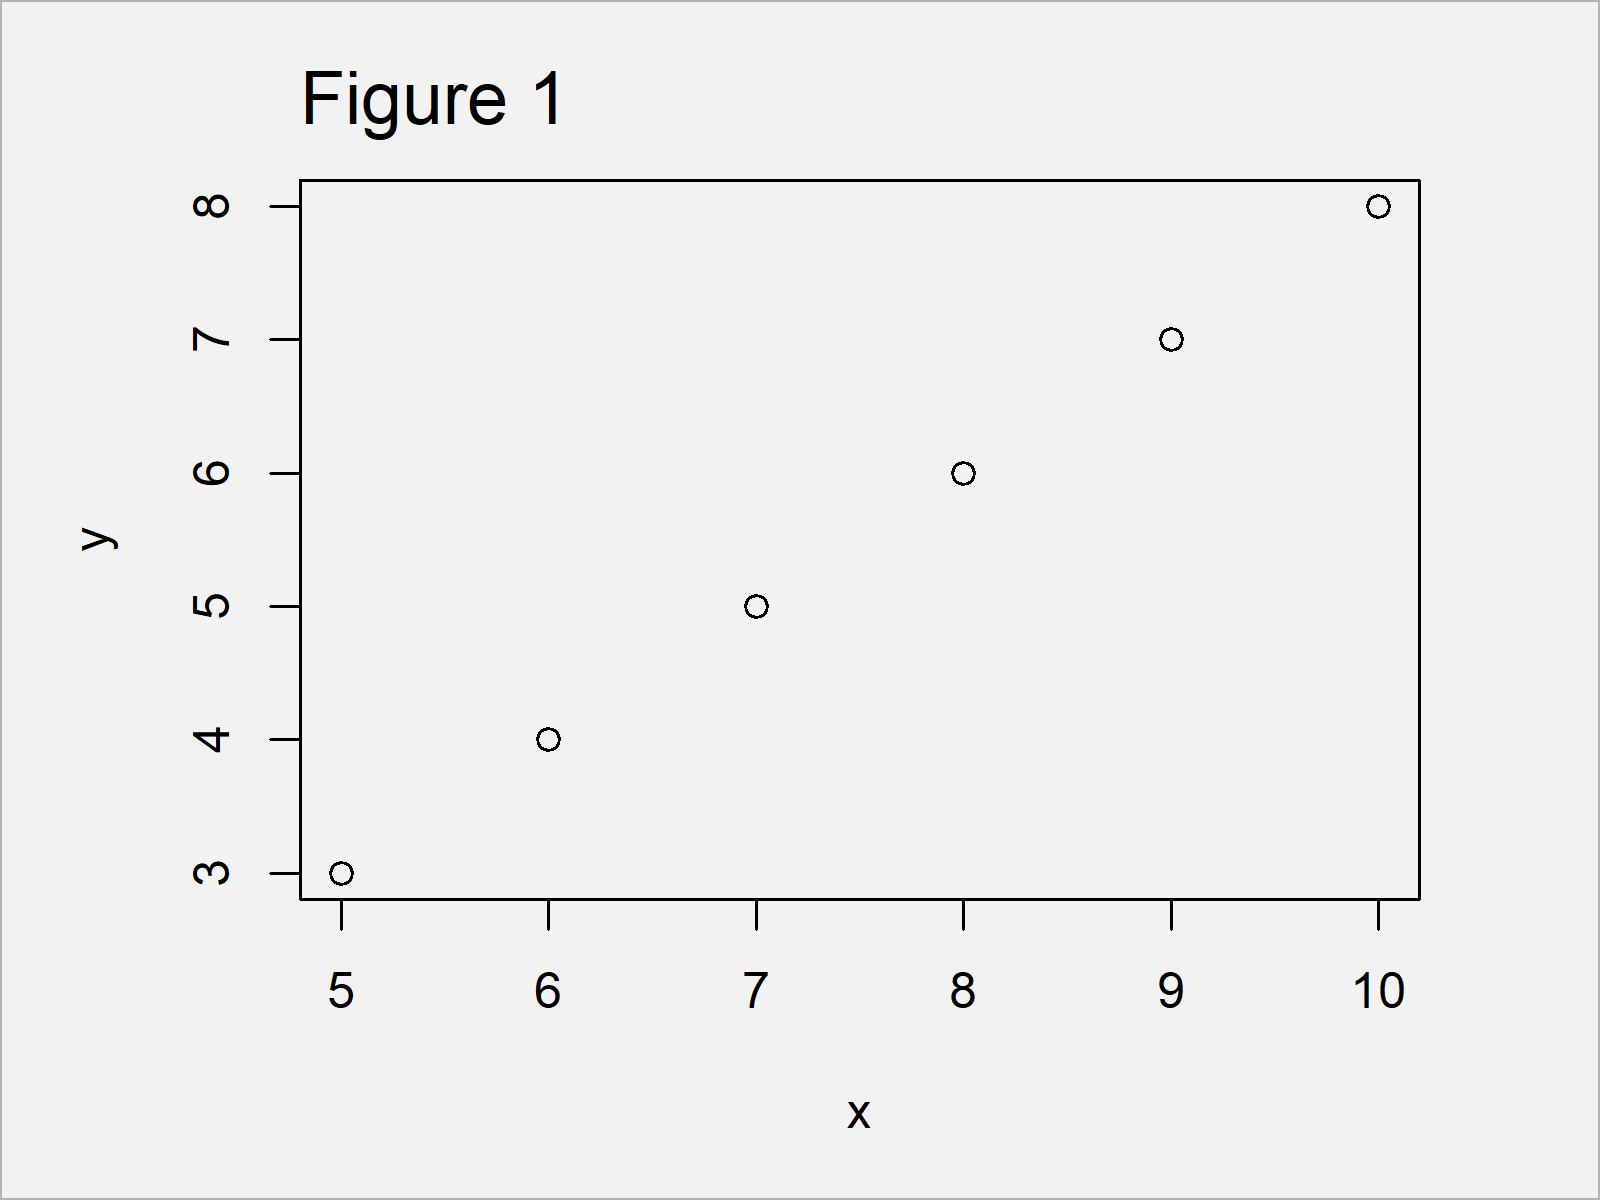
As shown in Figure 1, we have managed to create a Base R scatterplot using the previously shown R programming code. As defined in the default specifications of the plot function, the axis limits do not start at zero.
Example 1: Extend Axis Limits Using xlim & ylim Arguments
In Example 1, I’ll illustrate how to adjust the axis limits of our graphic using the xlim and ylim arguments.
Have a look at the following R code:
plot(x, y,                     # Specifying xlim/ylim
     xlim = c(0, 10),
     ylim = c(0, 8))

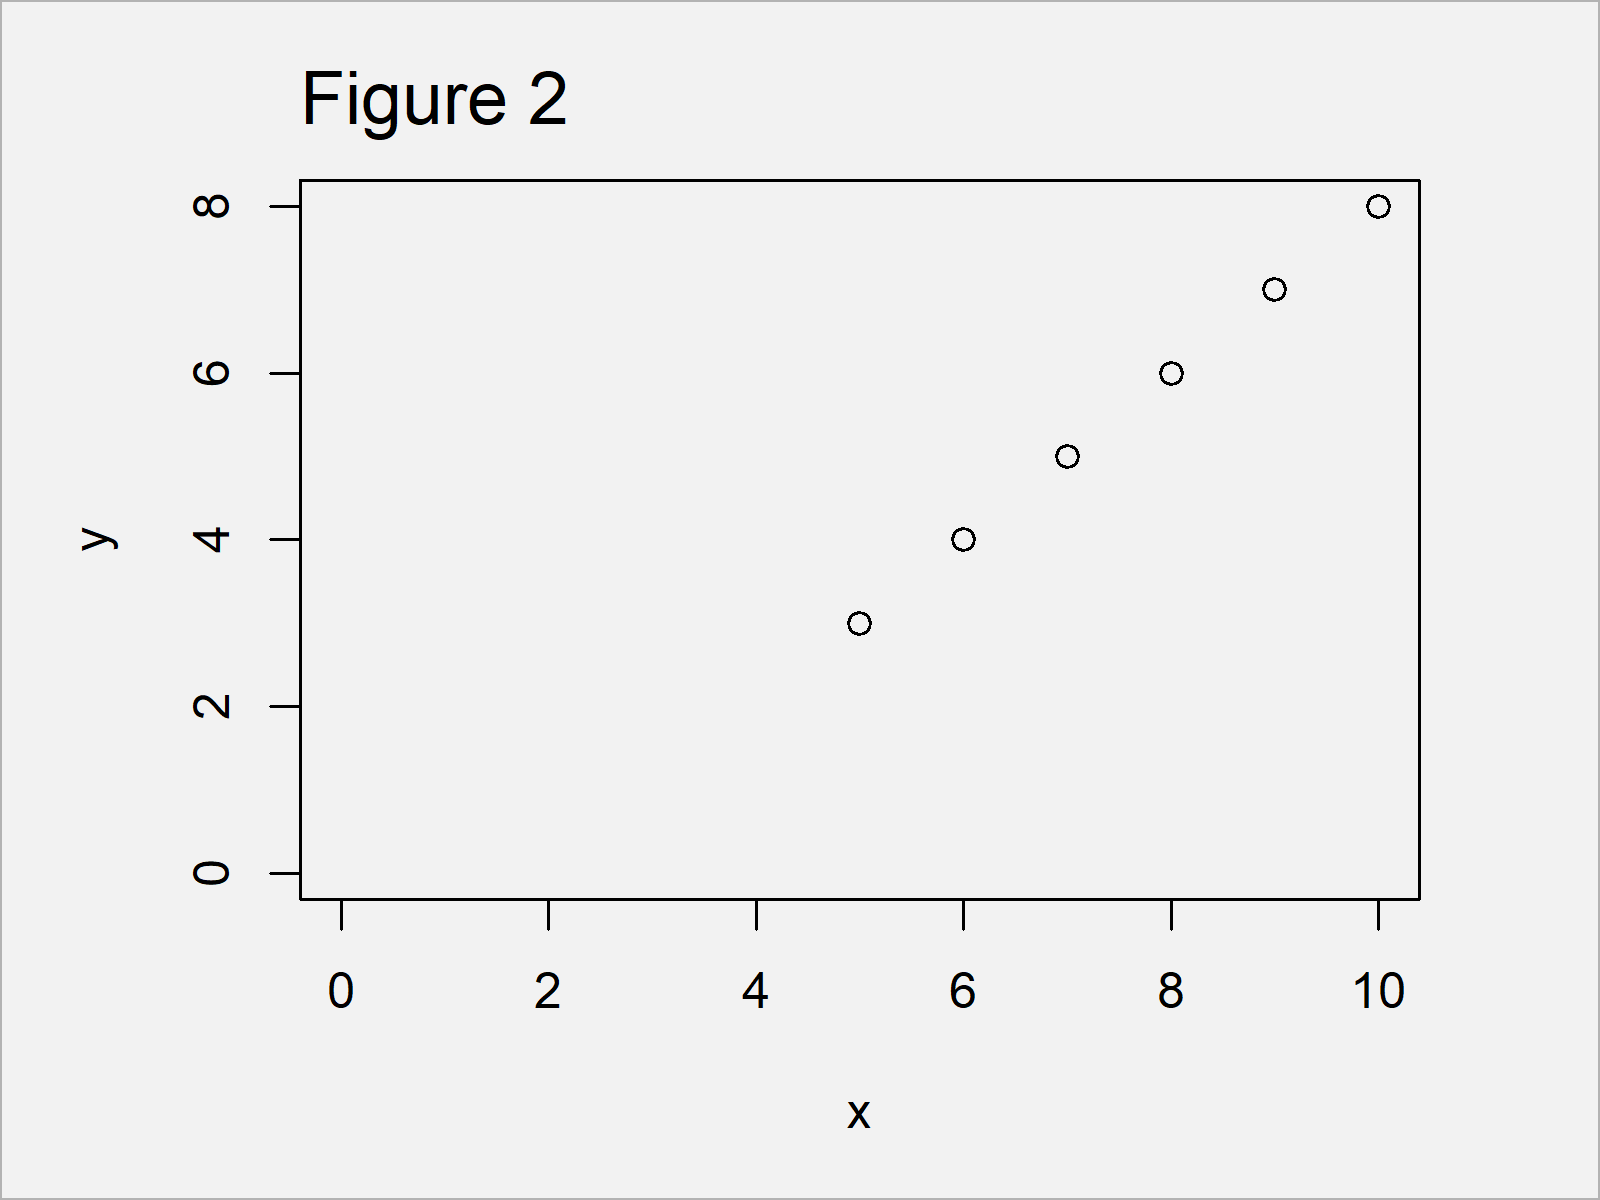
By executing the previous R programming syntax we have created Figure 2, i.e. a dotplot with x-axis and y-axis showing the value zero. However, the axes are not starting exactly at zero yet.
Example 2: Start Axes Exactly from Zero Origin Using xaxs & yaxs Arguments
In Example 2, I’ll show how to set the origin of our x- ad y-axes exactly to zero.
For this, we can use the xaxs and yaxs arguments in addition to xlim and ylim. We have to specify these arguments to be equal to the style “i”.
Consider the following R syntax and its output:
plot(x, y,                     # Specifying xaxs/yaxs
     xlim = c(0, 10),
     ylim = c(0, 8),
     xaxs = "i",
     yaxs = "i")

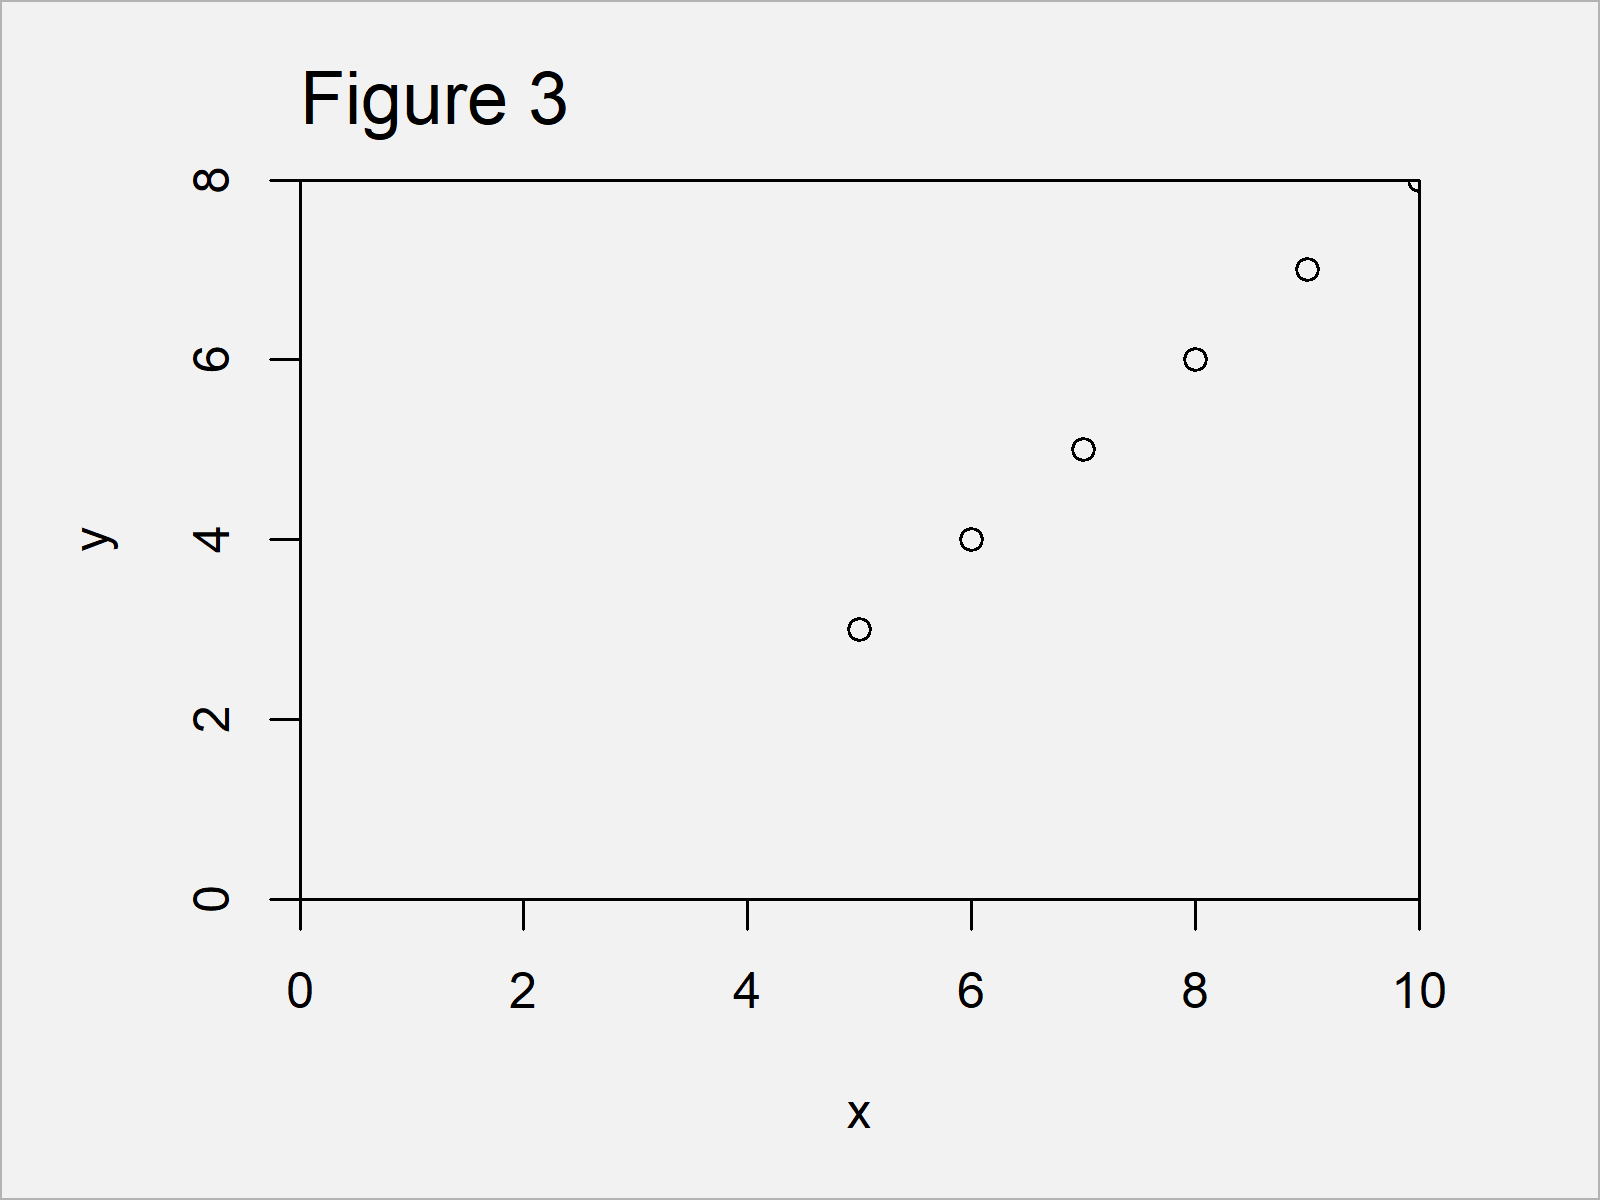
Figure 3 shows the output of the previous R syntax: A Base R xy-plot with axes starting exactly at the point 0/0.
Video, Further Resources & Summary
I have recently published a video on my YouTube channel, which shows the R codes of the present article. Please find the video below.
Furthermore, you may have a look at some of the other tutorials of this website:
- Add Axes to Plot Using axis Function
- Set Origin of ggplot2 Plot Axes to Zero
- Drawing Plots in R
- All R Programming Examples
You have learned in this article how to set the axis origin of a Base R graph to zero in the R programming language. Let me know in the comments section below, if you have additional questions.


