Standard Deviation by Row in R (2 Examples)
In this article you’ll learn how to compute the standard deviation across rows of a data matrix in R.
The post looks as follows:
Let’s jump right to the examples.
Constructing Example Data
I use the following data as basement for this R tutorial:
set.seed(3546728)                                  # Create example matrix
data <- matrix(round(runif(50), 2), ncol = 5)
colnames(data) <- paste0("x", 1:ncol(data))
data                                               # Print example matrix

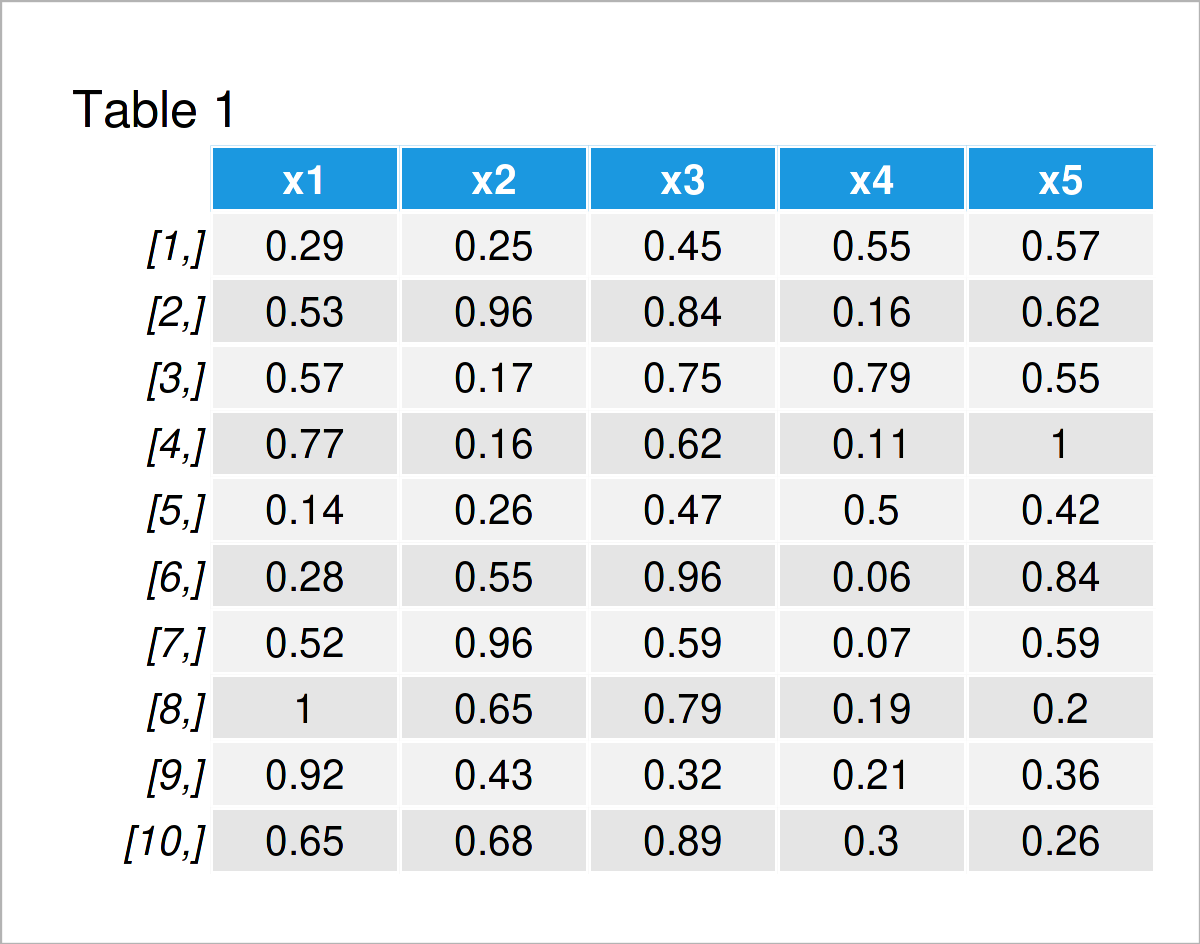
As you can see based on Table 1, the example data is a matrix containing ten rows and five columns called “x1”, “x2”, “x3”, “x4”, and “x5”.
Example 1: Compute Standard Deviation Across Rows Using apply() Function
In Example 1, I’ll demonstrate how to calculate the standard deviation for each row of a data matrix in R.
For this task, we can use the apply and sd functions as shown below:
row_sd1 <- apply(data, 1, sd)                      # Using apply() function
row_sd1                                            # Print standard deviations
#  [1] 0.1466970 0.3097095 0.2455199 0.3872596 0.1530359 0.3756594 0.3172223
#  [8] 0.3608739 0.2756266 0.2687564
The previous output of the RStudio console shows the ten standard deviations for the ten rows of our data set.
We might also add these results as a new column to our input matrix by using the cbind function in R:
data_new1 <- cbind(data, sd = row_sd1)             # Add standard deviations to data
data_new1                                          # Print data with standard deviations

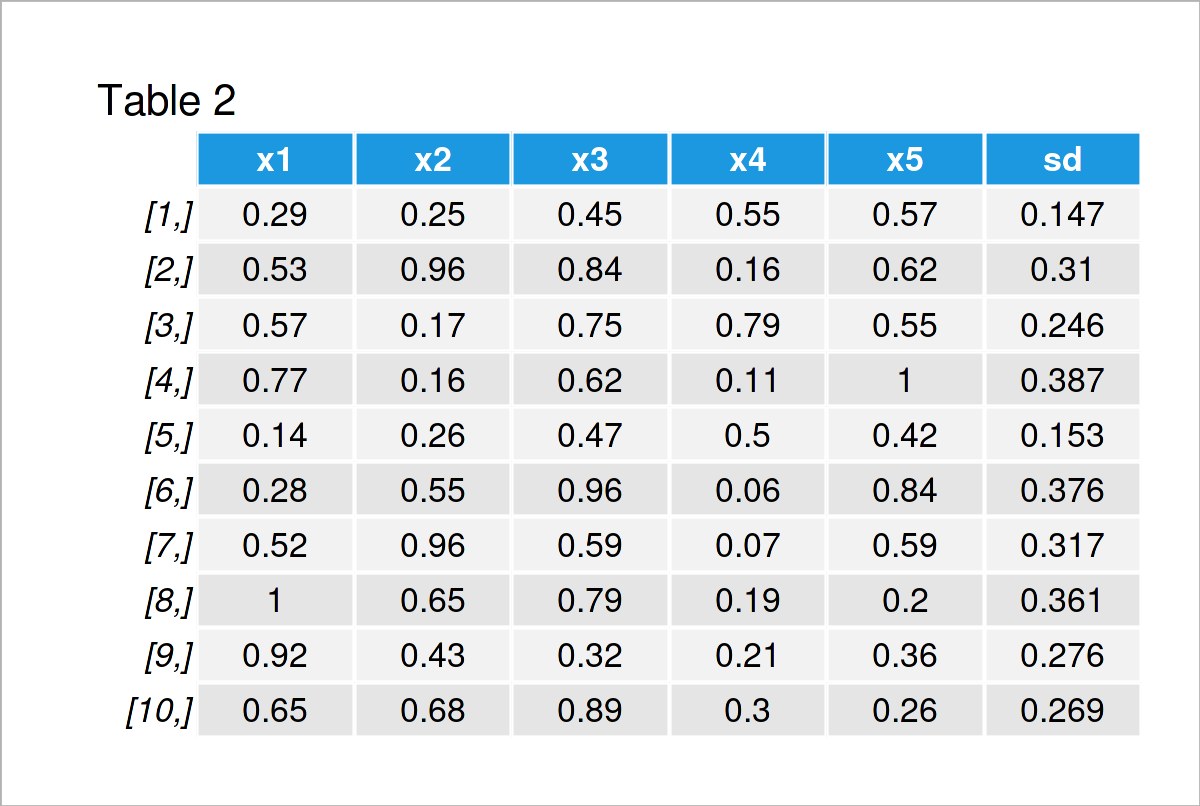
The output of the previously shown R programming code is shown in Table 2 – We have created a new version of our input data that also contains a column with standard deviations across rows.
Example 2: Compute Standard Deviation Across Rows of Data with NA Values
In Example 2, I’ll demonstrate how to calculate standard deviations for each row of a data set that contains NA values (i.e. missing data).
As a first step, we have to modify our example data:
data_na <- data                                    # Duplicate data
data_na[c(1, 7, 8), 1] <- NA                       # Insert NA values
data_na[c(4, 7), 3] <- NA
data_na[c(1, 2, 9), 4] <- NA
data_na                                            # Print data with NA values

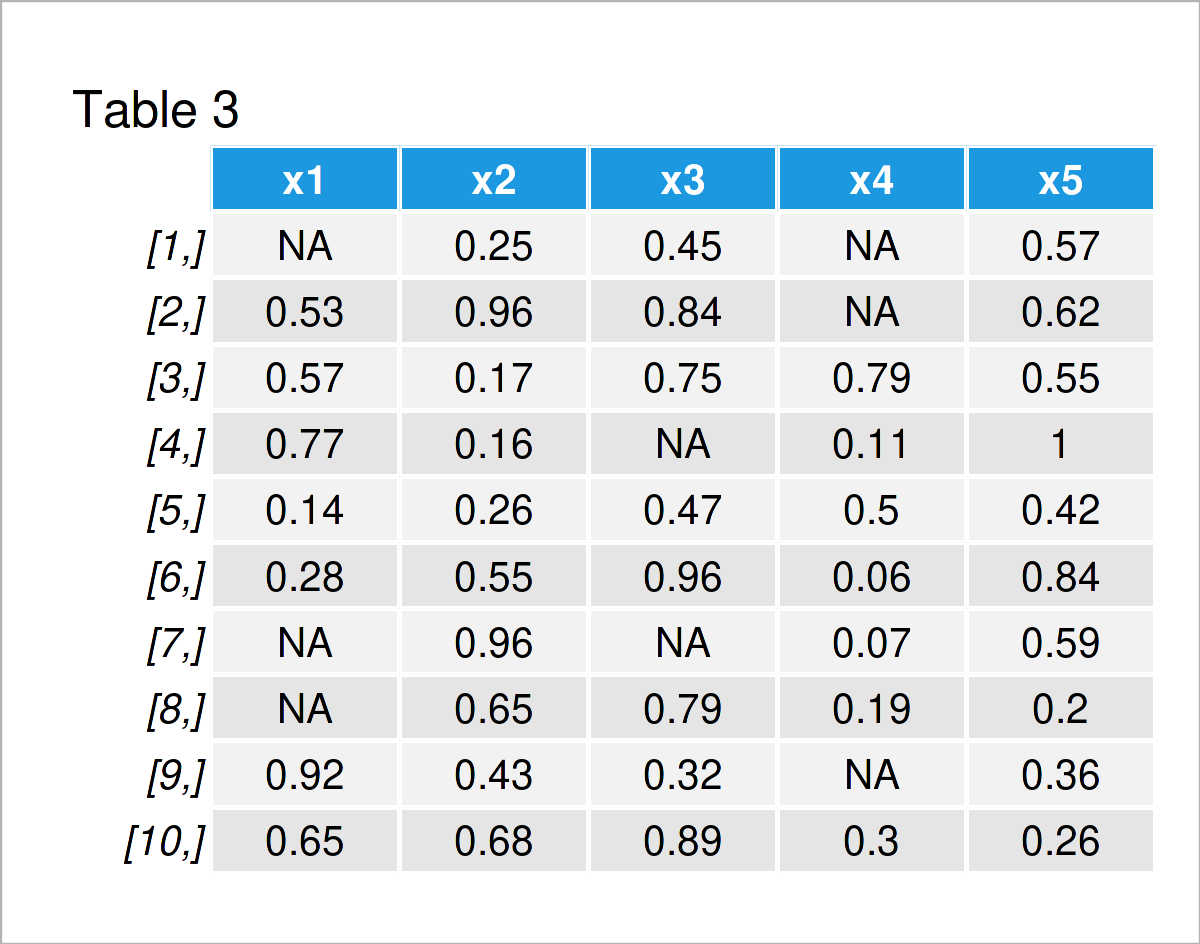
By executing the previous syntax we have created Table 3, i.e. a matrix containing NA values.
If we now apply the same code as in Example 1, our result contains NA values as well:
row_sd2a <- apply(data_na, 1, sd)                  # Try to calculate standard deviations
row_sd2a                                           # Result contains NA values
#  [1]        NA        NA 0.2455199        NA 0.1530359 0.3756594        NA
#  [8]        NA        NA 0.2687564
To avoid those NA values, we can use the na.rm argument of the sd function within the apply function:
row_sd2b <- apply(data_na, 1, sd, na.rm = TRUE)    # Using na.rm argument
row_sd2b                                           # Result without NA values
#  [1] 0.1616581 0.1973787 0.2455199 0.4435463 0.1530359 0.3756594 0.4471018
#  [8] 0.3084774 0.2787322 0.2687564
As you can see, our resulting vector does not contain any NA values anymore.
If we want, we can also add these values as new variable to our data set:
data_new2 <- cbind(data_na, sd = row_sd2b)         # Add standard deviations to data
data_new2                                          # Print data with standard deviations

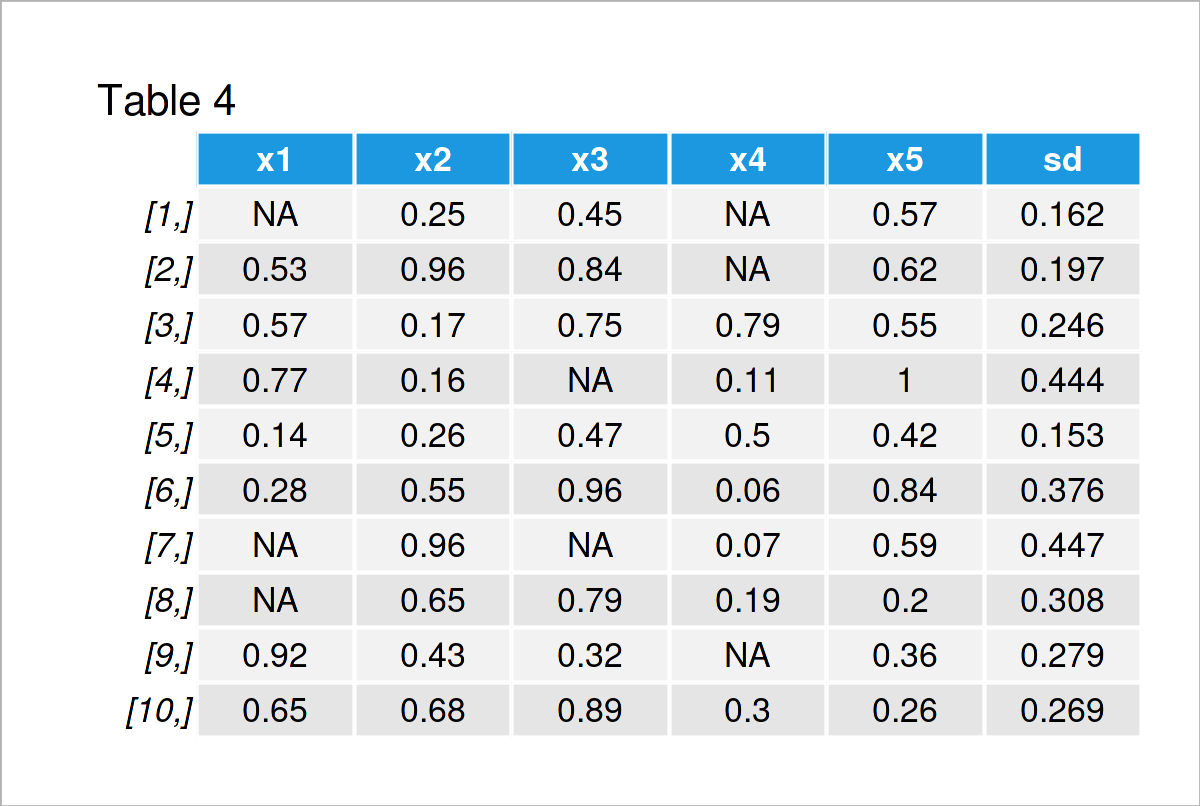
The final output is shown in Table 4, i.e. a matrix with standard deviations in an appended column.
Please note that the standard deviation results may suffer from the occurrence of too many NA values in your data. So please make sure to check the number of NAs in your data and why these missing values appear.
Video, Further Resources & Summary
I have recently released a video instruction on my YouTube channel, which shows the R codes of this tutorial. You can find the video below.
In addition, you may want to read some of the related tutorials on my website.
To summarize: This tutorial has explained how to calculate the standard deviation by the rows of a data set in the R programming language. Don’t hesitate to let me know in the comments section, if you have further questions.


