Exploratory Factor Analysis in R (Example)
In this tutorial, I’ll explain how to perform exploratory factor analysis (EFA) in the R programming language.
We’ll work with a built-in R dataset containing personality assessment data. This will serve as a hands-on example to showcase how EFA can help discover the underlying patterns in personality traits.
The table of contents is structured as follows:
Let’s dive into it!
Packages & Sample Dataset
Let us first install the packages needed for the data manipulation and analysis steps.
install.packages("psych") # install packages
install.packages("nFactors")
install.packages("reshape2")
install.packages("ggplot2")
install.packages("dplyr")
install.packages("GPArotation")
install.packages("corrplot")
install.packages("Hmisc")
Next, we need to load the respective libraries.
library(psych) # load libraries
library(nFactors)
library(reshape2)
library(ggplot2)
library(dplyr)
library(GPArotation)
library(corrplot)
library(Hmisc)
Once all libraries are set, we can load our sample data. We will use a built-in dataset called bfi, which includes 25 personality related self-report items taken from the International Personality Item Pool as part of the Synthetic Aperture Personality Assessment (SAPA) web based personality assessment project.
As seen in the following code, we will use the data() function to load the data to our environment.
data(bfi) # load data
In bfi, the first 25 columns represent personality self-report items (6-point response scale from 1:Very Inccurate to 6: Very Accurate), and the last three are demographic variables.
Since we are only interested in discovering underlying personality factors, I will omit the last three columns as follows.
mydata <- bfi[, 1:25] # use only 25 personality items
The columns in the original bfi dataset have predefined names that relate directly to specific personality traits. However, to simulate a real-world scenario where you work with an unstructured dataset, I will rename the columns to have a more generic format: Q1, Q2, … Q25.
names(mydata) <- paste0("Q", 1:25) # rename columns

head(mydata) # print mydata
#       Q1 Q2 Q3 Q4 Q5 Q6 Q7 Q8 Q9 Q10 Q11 Q12 Q13 Q14 Q15 Q16 Q17 Q18 Q19 Q20 Q21 Q22 Q23 Q24 Q25
# 61617  2  4  3  4  4  2  3  3  4   4   3   3   3   4   4   3   4   2   2   3   3   6   3   4   3
# 61618  2  4  5  2  5  5  4  4  3   4   1   1   6   4   3   3   3   3   5   5   4   2   4   3   3
# 61620  5  4  5  4  4  4  5  4  2   5   2   4   4   4   5   4   5   4   2   3   4   2   5   5   2
# 61621  4  4  6  5  5  4  4  3  5   5   5   3   4   4   4   2   5   2   4   1   3   3   4   3   5
# 61622  2  3  3  4  5  4  4  5  3   2   2   2   5   4   5   2   3   4   4   3   3   3   4   3   3
# 61623  6  6  5  6  5  6  6  6  1   3   2   1   6   5   6   3   5   2   2   3   4   3   5   6   1
The final view of the dataset is as shown above. Let’s now explore our data and prepare it for EFA!
Data Exploration & Preparation
We will use the describe() function of the Hmisch package to have an overview of the behavior of our data.
describe(mydata)
#     vars    n mean   sd median trimmed  mad min max range  skew kurtosis   se
# Q1     1 2784 2.41 1.41      2    2.23 1.48   1   6     5  0.83    -0.31 0.03
# Q2     2 2773 4.80 1.17      5    4.98 1.48   1   6     5 -1.12     1.05 0.02
# Q3     3 2774 4.60 1.30      5    4.79 1.48   1   6     5 -1.00     0.44 0.02
# Q4     4 2781 4.70 1.48      5    4.93 1.48   1   6     5 -1.03     0.04 0.03
# Q5     5 2784 4.56 1.26      5    4.71 1.48   1   6     5 -0.85     0.16 0.02
# Q6     6 2779 4.50 1.24      5    4.64 1.48   1   6     5 -0.85     0.30 0.02
# Q7     7 2776 4.37 1.32      5    4.50 1.48   1   6     5 -0.74    -0.14 0.03
# Q8     8 2780 4.30 1.29      5    4.42 1.48   1   6     5 -0.69    -0.13 0.02
# Q9     9 2774 2.55 1.38      2    2.41 1.48   1   6     5  0.60    -0.62 0.03
# Q10   10 2784 3.30 1.63      3    3.25 1.48   1   6     5  0.07    -1.22 0.03
# Q11   11 2777 2.97 1.63      3    2.86 1.48   1   6     5  0.37    -1.09 0.03
# Q12   12 2784 3.14 1.61      3    3.06 1.48   1   6     5  0.22    -1.15 0.03
# Q13   13 2775 4.00 1.35      4    4.07 1.48   1   6     5 -0.47    -0.47 0.03
# Q14   14 2791 4.42 1.46      5    4.59 1.48   1   6     5 -0.82    -0.30 0.03
# Q15   15 2779 4.42 1.33      5    4.56 1.48   1   6     5 -0.78    -0.09 0.03
# Q16   16 2778 2.93 1.57      3    2.82 1.48   1   6     5  0.37    -1.01 0.03
# Q17   17 2779 3.51 1.53      4    3.51 1.48   1   6     5 -0.08    -1.05 0.03
# Q18   18 2789 3.22 1.60      3    3.16 1.48   1   6     5  0.15    -1.18 0.03
# Q19   19 2764 3.19 1.57      3    3.12 1.48   1   6     5  0.20    -1.09 0.03
# Q20   20 2771 2.97 1.62      3    2.85 1.48   1   6     5  0.37    -1.06 0.03
# Q21   21 2778 4.82 1.13      5    4.96 1.48   1   6     5 -0.90     0.43 0.02
# Q22   22 2800 2.71 1.57      2    2.56 1.48   1   6     5  0.59    -0.81 0.03
# Q23   23 2772 4.44 1.22      5    4.56 1.48   1   6     5 -0.77     0.30 0.02
# Q24   24 2786 4.89 1.22      5    5.10 1.48   1   6     5 -1.22     1.08 0.02
# Q25   25 2780 2.49 1.33      2    2.34 1.48   1   6     5  0.74    -0.24 0.03
As seen, the bfi dataset is a relatively clean one using a standardized format (6-point scale for all) and excluding any inconsistencies (e.g., no out-of-range value).
Furthermore, outliers do not seem to be a potential issue observing the slight difference between the means and trimmed means. Nonetheless, we can reconsider them based on our analysis findings if necessary.
However, you can see that there is a certain amount of missingness, see the varied sample sizes per variable n. This is definitely worth considering. Let’s dive into it!
Exploring & Handling Missingness
We can start by analyzing the column-wise missingness. First, we will use the is.na() function to convert the data to boolean values, testing missingness. Then we will sum these values by column via colSums() to find the column-wise missingness. In the final step, we will divide the output by the number of rows using nrow() and multiply it by 100 to find the percentages.
col_miss <- round(colSums(is.na(mydata))/nrow(mydata) * 100, 2) # column-wise missingness
col_miss
#   Q1   Q2   Q3   Q4   Q5   Q6   Q7   Q8   Q9  Q10  Q11  Q12  Q13  Q14  Q15  Q16  Q17  Q18  Q19  Q20  Q21  Q22  Q23  Q24  Q25
# 0.57 0.96 0.93 0.68 0.57 0.75 0.86 0.71 0.93 0.57 0.82 0.57 0.89 0.32 0.75 0.79 0.75 0.39 1.29 1.04 0.79 0.00 1.00 0.50 0.71
Above, we see the percentage of missingness per variable, which are all low values as less than or around 1%. This indicates that none of the variables exhibit an anomaly.
It’s also crucial to consider case-wise missingness to get a comprehensive view of data completeness. Let’s delve into that aspect next!
First, we will create a data frame where all inputs in mydata are recorded as boolean values based on whether the input is missing. Then, we will group the data by the missingness pattern and calculate the missingness percentage per pattern.
df_miss <- as.data.frame(is.na(mydata)) # create missingness data

df_agg <- df_miss %>% # aggregate data by pattern  & calculate frequency
  group_by(across(everything())) %>%
  tally() %>%
  ungroup() %>%
  mutate(perc = n / sum(n) * 100) %>%
  arrange(-perc)
Above, group_by(across(everything())) groups the data by all unique combinations of observations (missingness patterns) in df_miss. The tally() function counts the number of occurences of patterns and store it as n. The percentages are calculated based on the calculated n and ordered in descending order through the arrange() function.
First, let’s see how many different patterns are found by checking the number of rows in previously created data df_agg.
dim(df_agg)[1] # number of rows in df_agg
# [1] 87
Here, we see there are 87 missingness patterns in total.
Let’s now check the largest missingness pattern percentages by printing the first six rows of df_agg.
head(df_agg) # print df_agg
# # A tibble: 6 × 27
#   Q1    Q2    Q3    Q4    Q5    Q6    Q7    Q8    Q9    Q10   Q11   Q12   Q13   Q14   Q15   Q16   Q17   Q18   Q19   Q20   Q21   Q22   Q23   Q24   Q25       n   perc
# <lgl> <lgl> <lgl> <lgl> <lgl> <lgl> <lgl> <lgl> <lgl> <lgl> <lgl> <lgl> <lgl> <lgl> <lgl> <lgl> <lgl> <lgl> <lgl> <lgl> <lgl> <lgl> <lgl> <lgl> <lgl>    <int>  <dbl>
# 1 FALSE FALSE FALSE FALSE FALSE FALSE FALSE FALSE FALSE FALSE FALSE FALSE FALSE FALSE FALSE FALSE FALSE FALSE FALSE FALSE FALSE FALSE FALSE FALSE FALSE  2436    87
# 2 FALSE FALSE FALSE FALSE FALSE FALSE FALSE FALSE FALSE FALSE FALSE FALSE FALSE FALSE FALSE FALSE FALSE FALSE TRUE  FALSE FALSE FALSE FALSE FALSE FALSE    25  0.893
# 3 FALSE FALSE FALSE FALSE FALSE FALSE FALSE FALSE FALSE FALSE FALSE FALSE FALSE FALSE FALSE FALSE FALSE FALSE FALSE TRUE  FALSE FALSE FALSE FALSE FALSE    17  0.607
# 4 FALSE FALSE FALSE FALSE FALSE FALSE FALSE FALSE FALSE FALSE FALSE FALSE FALSE FALSE TRUE  FALSE FALSE FALSE FALSE FALSE FALSE FALSE FALSE FALSE FALSE    17  0.607
# 5 FALSE FALSE FALSE FALSE FALSE FALSE FALSE FALSE FALSE FALSE FALSE FALSE FALSE FALSE FALSE FALSE TRUE  FALSE FALSE FALSE FALSE FALSE FALSE FALSE FALSE    16  0.571
# 6 FALSE FALSE FALSE FALSE FALSE FALSE FALSE FALSE FALSE FALSE TRUE  FALSE FALSE FALSE FALSE FALSE FALSE FALSE FALSE FALSE FALSE FALSE FALSE FALSE FALSE    16  0.571
As observed, the highest percentage 87% belongs to the pattern of complete cases with all FALSE inputs. The rest of percentages are at negligible levels, which provides evidence that the missingness could be completely at random. Therefore, as a handling method, we will directly omit the incomplete cases for the simplicity.
mydata_nm <- na.omit(mydata) # remove cases with missingness
If you have a limited sample size, you can also opt for multiple imputation, which requires the evaluation of numerous EFA output.
It is also worth noting that the missingness exploration can be enhanced with graphical representations. Here, we excluded them since the numerical outputs were straightforward to interpret.
Correlation Matrix Computation
In order to understand how the variables relate to each other, it is crucial to compute the correlations. We will calculate polychoric correlations considering the categorical nature of our data.
First, we will use the polychoric() function of the psych package for the computation. After that, we will retrieve the correlation coefficients to visualize the results using the corrplot() function of the corrplot package.
polychoric_corr <- polychoric(mydata_nm)$rho # # compute correlations

corrplot(polychoric_corr, # visualize correlations
         type = "lower",
         method = "number",
         tl.col = "darkblue",
         number.cex = 0.6,
         tl.cex = 0.6,
         col = COL2('RdBu'))
As seen, the rho element storing the correlations was retrieved and parsed to the corrplot() function. In the function, certain visual elements, like matrix type type, were also specified. If you are interested different visual designs, see this article.

The subsequent questions have either a strong positive or a strong negative correlation. Also, the question group Q2-Q5 considerably correlate with the question group Q12-Q15. These significant associations are indicators of hidden potential factors in the dataset.
Let’s take this analysis to the next level by computing the KMO statistic!
KMO(polychoric_corr) # check factorability
# Kaiser-Meyer-Olkin factor adequacy
# Call: KMO(r = polychoric_corr)
# Overall MSA =  0.86
# MSA for each item =
# Q1   Q2   Q3   Q4   Q5   Q6   Q7   Q8   Q9  Q10  Q11  Q12  Q13  Q14  Q15  Q16  Q17  Q18  Q19  Q20  Q21  Q22  Q23
# 0.77 0.84 0.88 0.88 0.91 0.86 0.80 0.86 0.84 0.87 0.84 0.89 0.90 0.88 0.90 0.78 0.78 0.87 0.89 0.86 0.88 0.80 0.86
# Q24  Q25
# 0.78 0.79
The KMO statistic assesses the adequacy of the data for factor analysis. A result that yields values exceeding 0.8 for each variable, and 0.86 for the complete dataset, suggests that the data is suitable for this analysis.
We are on the right track! Let’s start with deciding the number of factors to extract!
Factor Number Estimation
There are different factor selection methods that can be considered. In this tutorial, we will use relatively sophisticated methods called parallel analysis (PA) and minimum average partial (MAP) test.
Let’s start with PA, which compare the eigenvalues of the randomly generated and resampled data with the eigenvalues of the actual data. According to this method, the actual data factors with larger eigenvalues than the corresponding random/resampled data eigenvalues are retained.
We will use the fa.parallel() function of the psych package to return a PA solution with a graphical representation.
set.seed(1234) # set seed for reproducability

fa.parallel(mydata_nm, # perform parallel analysis
            fa = "fa",
            fm = "pa",
            show.legend = TRUE,
            main = "Scree Plot and Parallel Analysis")
# Parallel analysis suggests that the number of factors =  6  and the number of components =  NA
As you can see, the analysis suggests six factors. Since we requested only the factor computation by specifying fa = "fa", there is no suggestion regarding the principal component number.
Let’s also check the visual output!

Here, we observe the visual representation of the six factor solution. The simulated data eigenvalues and resampled eigenvalues overlap, which makes the corresponding lines be seen as a single line. This overlap is a result of using a polychoric matrix, see the function documentation.
To make a more informed decision about the number of factors, it’s advisable to use other alternative methods. As mentioned earlier, we will utilize the MAP test to confirm our initial findings.
This method checks the average squared partial correlation under the control of different numbers of factors. According to this method, the ideal factor number is the factor number related to the smallest average squared partial correlation.
VSS(mydata_nm) # perform MAP
# Very Simple Structure
# Call: vss(x = x, n = n, rotate = rotate, diagonal = diagonal, fm = fm,
#           n.obs = n.obs, plot = plot, title = title, use = use, cor = cor)
# VSS complexity 1 achieves a maximimum of 0.59  with  4  factors
# VSS complexity 2 achieves a maximimum of 0.75  with  5  factors
#
# The Velicer MAP achieves a minimum of 0.01  with  5  factors
# BIC achieves a minimum of  -550.01  with  8  factors
# Sample Size adjusted BIC achieves a minimum of  -143.33  with  8  factors
#
# Statistics by number of factors
#   vss1 vss2   map dof chisq     prob sqresid  fit RMSEA  BIC SABIC complex eChisq  SRMR eCRMS  eBIC
# 1 0.50 0.00 0.025 275 10656  0.0e+00    26.0 0.50 0.124 8512  9386     1.0  21181 0.120 0.126 19037
# 2 0.55 0.64 0.019 251  6669  0.0e+00    18.7 0.64 0.102 4712  5509     1.2  11015 0.087 0.095  9058
# 3 0.57 0.71 0.018 228  4585  0.0e+00    14.5 0.72 0.089 2807  3531     1.3   6268 0.065 0.075  4490
# 4 0.59 0.75 0.016 206  3033  0.0e+00    11.3 0.78 0.075 1426  2081     1.4   3129 0.046 0.056  1523
# 5 0.54 0.75 0.015 185  1539 8.6e-212     9.1 0.82 0.055   96   684     1.5   1132 0.028 0.035  -311
# 6 0.54 0.73 0.016 165   917 1.6e-104     8.1 0.84 0.043 -370   154     1.7    553 0.019 0.026  -734
# 7 0.51 0.69 0.019 146   631  1.8e-61     7.7 0.85 0.037 -508   -44     1.9    372 0.016 0.023  -767
# 8 0.51 0.69 0.022 128   448  4.0e-37     7.2 0.86 0.032 -550  -143     1.9    238 0.013 0.020  -760
I have preferred to use the VSS() function since it provides other statistics that one might be interested. Nevertheless, in the scope of this tutorial, we will only focus on the map column above.
Accordingly, five factor solution related to the smallest MAP 0.015 looks optimal. Remember, EFA is inherently an exploratory technique, so it’s essential to remain flexible when evaluating potential solutions.
In light of these results, we will perform our EFA considering both six and five factor solutions in the next section.
Without further ado, let’s jump into EFA!
Exploratory Factor Analysis
Let’s start with the six factor solution. All we need is to use the fa() function parsing the specified correlation matrix, rotation and extraction method, and the number of factors.
efa_promax6 <- fa(polychoric_corr, # perform EFA with 6 factors
                         nfactors=6,
                         rotate="promax",
                         fm="pa")
As seen, we input our polychoric correlation matrix polychoric_corr and number of factors 6, and set the rotation to "promax" and the extraction method to principal axis factoring "pa".
We’ve opted for the promax rotation, which is a type of oblique rotation generally preferred over their orthogonal counterparts in practice.
Let’s print the result showing factor loadings above 0.40, which is an arbitrary yet common threshold. You can also print the result without applying any threshold; it’s just for the sake of interpretation.
print(efa_promax6, # print efa_promax6
      cut = 0.4)

# Factor Analysis using method =  pa
# Call: fa(r = polychoric_corr, nfactors = 6, rotate = "promax", fm = "pa")
# Standardized loadings (pattern matrix) based upon correlation matrix
#     PA1   PA2   PA3   PA4   PA5   PA6   h2   u2 com
# Q1                          -0.69       0.40 0.60 1.3
# Q2                           0.70       0.60 0.40 1.2
# Q3                           0.53       0.59 0.41 1.9
# Q4                                      0.35 0.65 3.1
# Q5                                      0.55 0.45 3.5
# Q6               0.63                   0.41 0.59 1.2
# Q7               0.79                   0.55 0.45 1.1
# Q8               0.65                   0.35 0.65 1.1
# Q9              -0.72              0.48 0.66 0.34 1.9
# Q10             -0.59                   0.48 0.52 1.6
# Q11 -0.73                               0.44 0.56 1.4
# Q12 -0.78                               0.62 0.38 1.1
# Q13  0.55                               0.54 0.46 2.1
# Q14  0.70                               0.63 0.37 1.4
# Q15  0.54                               0.46 0.54 1.9
# Q16        0.94                         0.76 0.24 1.2
# Q17        0.93                         0.71 0.29 1.2
# Q18        0.76                         0.59 0.41 1.0
# Q19        0.49                         0.55 0.45 2.2
# Q20        0.51                         0.40 0.60 1.8
# Q21                   -0.49             0.42 0.58 2.2
# Q22                    0.54             0.34 0.66 1.2
# Q23                   -0.56             0.54 0.46 2.1
# Q24                   -0.41             0.35 0.65 3.1
# Q25                    0.65             0.43 0.57 1.1
#
#                        PA1  PA2  PA3  PA4  PA5  PA6
# SS loadings           2.95 2.92 2.34 1.76 1.75 1.01
# Proportion Var        0.12 0.12 0.09 0.07 0.07 0.04
# Cumulative Var        0.12 0.23 0.33 0.40 0.47 0.51
# Proportion Explained  0.23 0.23 0.18 0.14 0.14 0.08
# Cumulative Proportion 0.23 0.46 0.65 0.78 0.92 1.00
#
# With factor correlations of
#       PA1   PA2   PA3   PA4   PA5   PA6
# PA1  1.00 -0.38  0.43 -0.11  0.31  0.12
# PA2 -0.38  1.00 -0.22  0.04 -0.18  0.25
# PA3  0.43 -0.22  1.00 -0.19  0.31  0.25
# PA4 -0.11  0.04 -0.19  1.00 -0.02 -0.07
# PA5  0.31 -0.18  0.31 -0.02  1.00  0.34
# PA6  0.12  0.25  0.25 -0.07  0.34  1.00
#
# Mean item complexity =  1.7
# Test of the hypothesis that 6 factors are sufficient.
#
# df null model =  300  with the objective function =  9.59
# df of  the model are 165  and the objective function was  0.57
#
# The root mean square of the residuals (RMSR) is  0.02
# The df corrected root mean square of the residuals is  0.03
#
# Fit based upon off diagonal values = 0.99
# Measures of factor score adequacy
#                                                   PA1  PA2  PA3  PA4  PA5  PA6
# Correlation of (regression) scores with factors   0.93 0.95 0.91 0.87 0.89 0.83
# Multiple R square of scores with factors          0.87 0.90 0.83 0.75 0.78 0.69
# Minimum correlation of possible factor scores     0.74 0.80 0.67 0.51 0.57 0.39
As seen, the factor analysis object provides an extensive output. Eventhough, usually, the factor loadings are the main interest in EFA.
Based on the loadings table, certain questions load sufficiently on certain factors, except for Q9. This implies that some groups of questions may measure a similar concept. For example, Q1, Q2, and Q3 might all pertain to a specific personal trait.
However, it is important to note that the choice of the factor extraction and rotation methods have impact on the outcome. Therefore, it is advised to try out multiple extraction and rotation methods to get the most interpretable result, ideally, where each variable loads highly onto one and only one factor, also called simple structure.
Additionally, you can check the explained variance statistics per factor in the second table. For instance, factors explain a total of 51% (0.51) of variance in the dataset. However, we are less interested in the maximum explained variance in EFA, unlike in PCA).
You can observe the correlations of factors in the third table, where you can see some moderate-level correlations. For instance, the correlation between PA1 and PA2 it is -0.38. This implies that these two personal traits are inversely associated.
Finally, you can go over the factor score adequacy statistics in the fourth table to check the reliability of the estimated factor scores, which are the scores of individuals on the extracted factors. Like in regression, Multiple R square R² refers to the proportion of variance of factor scores explained by the question items. It ranges between 0 and 1, with higher values being preferable.
Let’s now check the other potential solution, extracting five factors!
efa_promax5 <- fa(polychoric_corr, # perform EFA with 5 factors
                   nfactors = 5,
                   rotate = "promax",
                   fm = "pa")

print(efa_promax5, # print efa_promax5
      cut = 0.4)
# Factor Analysis using method =  pa
# Call: fa(r = polychoric_corr, nfactors = 5, rotate = "promax", fm = "pa")
# Standardized loadings (pattern matrix) based upon correlation matrix
#      PA2   PA1   PA3   PA5   PA4   h2   u2 com
# Q1                    -0.53       0.26 0.74 1.4
# Q2                     0.66       0.54 0.46 1.1
# Q3                     0.64       0.61 0.39 1.3
# Q4                     0.43       0.35 0.65 2.2
# Q5                     0.51       0.53 0.47 1.9
# Q6               0.60             0.40 0.60 1.2
# Q7               0.73             0.51 0.49 1.2
# Q8               0.63             0.36 0.64 1.1
# Q9              -0.70             0.55 0.45 1.2
# Q10             -0.60             0.49 0.51 1.4
# Q11       -0.67                   0.39 0.61 1.1
# Q12       -0.75                   0.61 0.39 1.1
# Q13        0.57                   0.50 0.50 1.7
# Q14        0.71                   0.60 0.40 1.2
# Q15        0.53                   0.46 0.54 1.9
# Q16  0.87                         0.74 0.26 1.3
# Q17  0.83                         0.66 0.34 1.2
# Q18  0.77                         0.59 0.41 1.0
# Q19  0.56                         0.55 0.45 1.8
# Q20  0.56                         0.40 0.60 1.6
# Q21                          0.55 0.39 0.61 1.3
# Q22                         -0.51 0.30 0.70 1.5
# Q23                          0.62 0.54 0.46 1.5
# Q24                          0.45 0.35 0.65 2.6
# Q25                         -0.60 0.36 0.64 1.1
#
#                       PA2  PA1  PA3  PA5  PA4
# SS loadings           2.95 2.91 2.29 2.04 1.84
# Proportion Var        0.12 0.12 0.09 0.08 0.07
# Cumulative Var        0.12 0.23 0.33 0.41 0.48
# Proportion Explained  0.25 0.24 0.19 0.17 0.15
# Cumulative Proportion 0.25 0.49 0.68 0.85 1.00
#
# With factor correlations of
#      PA2   PA1   PA3   PA5  PA4
# PA2  1.00 -0.26 -0.23 -0.02 0.04
# PA1 -0.26  1.00  0.41  0.35 0.16
# PA3 -0.23  0.41  1.00  0.25 0.21
# PA5 -0.02  0.35  0.25  1.00 0.16
# PA4  0.04  0.16  0.21  0.16 1.00
#
# Mean item complexity =  1.4
# Test of the hypothesis that 5 factors are sufficient.
#
# df null model =  300  with the objective function =  9.59
# df of  the model are 185  and the objective function was  0.92
#
# The root mean square of the residuals (RMSR) is  0.03
# The df corrected root mean square of the residuals is  0.04
#
# Fit based upon off diagonal values = 0.98
# Measures of factor score adequacy
#                                                   PA2  PA1  PA3  PA5  PA4
# Correlation of (regression) scores with factors   0.94 0.93 0.91 0.89 0.87
# Multiple R square of scores with factors          0.88 0.86 0.82 0.80 0.76
# Minimum correlation of possible factor scores     0.77 0.72 0.64 0.59 0.52
In this solution, we have obtained the ideal simple structure where each question item loads on a unique factor. Perfect!
The next step is reviewing these question groups and trying to find a common concept that these questions seem to measure. This step is more of an art than a science and requires a combination of intuition, domain knowledge, and context.
In a scenario, where we are scientists analyzing this data, it’s imperative to apply our knowledge of psychology to interpret the meaning behind these groupings. For instance, if the first five questions revolve around themes like being cooperative, kind to others, and displaying trustworthiness, we might conclude that they relate to the Agreeableness trait of the Big Five personality traits.
Imagine, after this evaluation step, we concluded that the factors PA1, PA2, PA3, PA4 and PA5 measure Neuroticism, Extraversion, Conscientiousness, Agreeableness and Openness. You can run the code below and find the item explanations in the dataset documentation to confirm this partitioning.
names(bfi[, 16:20]) # original variable names per factor
# [1] "N1" "N2" "N3" "N4" "N5"
names(bfi[, 11:15])
# [1] "E1" "E2" "E3" "E4" "E5"
names(bfi[, 6:10])
# [1] "C1" "C2" "C3" "C4" "C5"
names(bfi[, 1:5])
# [1] "A1" "A2" "A3" "A4" "A5"
names(bfi[, 21:25])
# [1] "O1" "O2" "O3" "O4" "O5"
It looks like we discovered the underlying themes in our dataset! In the next section, we will check if the selected item groups indeed measure the same concept, also called internal consistency or reliability.
Reliability Check of Item Groups
One common way to test the internal consistency is to calculate Cronbach’s alpha. Using the alpha() function of the psych package, we can calculate the statistic for each extracted factor. The values over 0.70 are considered acceptable reliability. See the code script below.
alpha1 <- psych::alpha(mydata_nm[ ,16:20], check.keys=TRUE) # cronbach alpha per factor
alpha2 <- psych::alpha(mydata_nm[ ,11:15], check.keys=TRUE)
alpha3 <- psych::alpha(mydata_nm[ ,6:10], check.keys=TRUE)
alpha4 <- psych::alpha(mydata_nm[ ,1:5], check.keys=TRUE)
alpha5 <- psych::alpha(mydata_nm[ ,21:25], check.keys=TRUE)
As seen, we have used the fully qualified name psych::alpha to avoid clashes of function names among loaded packages. Besides, we specified the check.keys argument to TRUE to reverse the items that are negatively yet sufficiently associated with the factor. This is indicated by a negative sign for the variable name.
Let’s now print the first alpha statistic to get an overview of the stored information!
alpha1 # print alpha1
# Reliability analysis
# Call: psych::alpha(x = mydata_nm[, 16:20], check.keys = TRUE)
#
# raw_alpha std.alpha G6(smc) average_r S/N    ase mean  sd median_r
#      0.82      0.82     0.8      0.47 4.5 0.0059  3.2 1.2     0.42
#
# 95% confidence boundaries
# lower alpha upper
# Feldt     0.81  0.82  0.83
# Duhachek  0.81  0.82  0.83
#
# Reliability if an item is dropped:
#     raw_alpha std.alpha G6(smc) average_r S/N alpha se  var.r med.r
# Q16      0.76      0.76    0.71      0.44 3.2   0.0080 0.0061  0.42
# Q17      0.77      0.77    0.72      0.45 3.3   0.0077 0.0056  0.42
# Q18      0.76      0.76    0.74      0.44 3.2   0.0081 0.0186  0.40
# Q19      0.80      0.80    0.77      0.50 4.0   0.0068 0.0192  0.49
# Q20      0.82      0.82    0.79      0.53 4.5   0.0061 0.0140  0.54
#
# Item statistics
#        n raw.r std.r r.cor r.drop mean  sd
# Q16 2436  0.81  0.81  0.78   0.68  2.9 1.6
# Q17 2436  0.79  0.79  0.75   0.65  3.5 1.5
# Q18 2436  0.81  0.81  0.74   0.68  3.2 1.6
# Q19 2436  0.72  0.72  0.60   0.55  3.2 1.6
# Q20 2436  0.68  0.67  0.53   0.49  3.0 1.6
#
# Non missing response frequency for each item
#        1    2    3    4    5    6 miss
# Q16 0.23 0.24 0.15 0.18 0.12 0.07    0
# Q17 0.12 0.19 0.15 0.25 0.18 0.11    0
# Q18 0.17 0.23 0.13 0.22 0.16 0.09    0
# Q19 0.17 0.24 0.15 0.22 0.14 0.09    0
# Q20 0.24 0.24 0.14 0.18 0.12 0.09    0
Above, first, you see the raw alpha statistics for the particular factor, which is 0.82, the alpha for standardized items, std.alpha, which is 0.82. The other statistics like average inter item correlation average_r and signal to noise ratio S/N are also provided.
Later, you see the confidence intervals and alpha statistics in case a particular item is dropped. The fact that the raw_alpha never exceeds the raw alpha 0.82 after the drops provides evidence that none of the items negatively impact the factor’s internal consistency.
In the last two tables, you will see the descriptive statistics like correlations with the factor (raw.r, std.r, etc.), and the response frequencies including missing cases. Remember that we have removed the cases with missingness already at the beginning. Therefore, no missingness is detected.
Everything looks fine for the first factor Neuroticism. If the same applies to the rest, you can visualize your factors and corresponding measuring items. Let’s check how to do it in the next section!
Visualisation of Results
The psych package provides the fa.diagram() function for the visualizations of factor-item relations in a diagram. It is enough to parse our EFA object to the function to return it.
fa.diagram(efa_promax5) # draw factor diagram
By default, the loadings above 0.3 and the highest loading per factor are shown. Since our final model has a simple structure and our cutoff is 0.40, we don’t need to change the default settings. See the corresponding visual below.
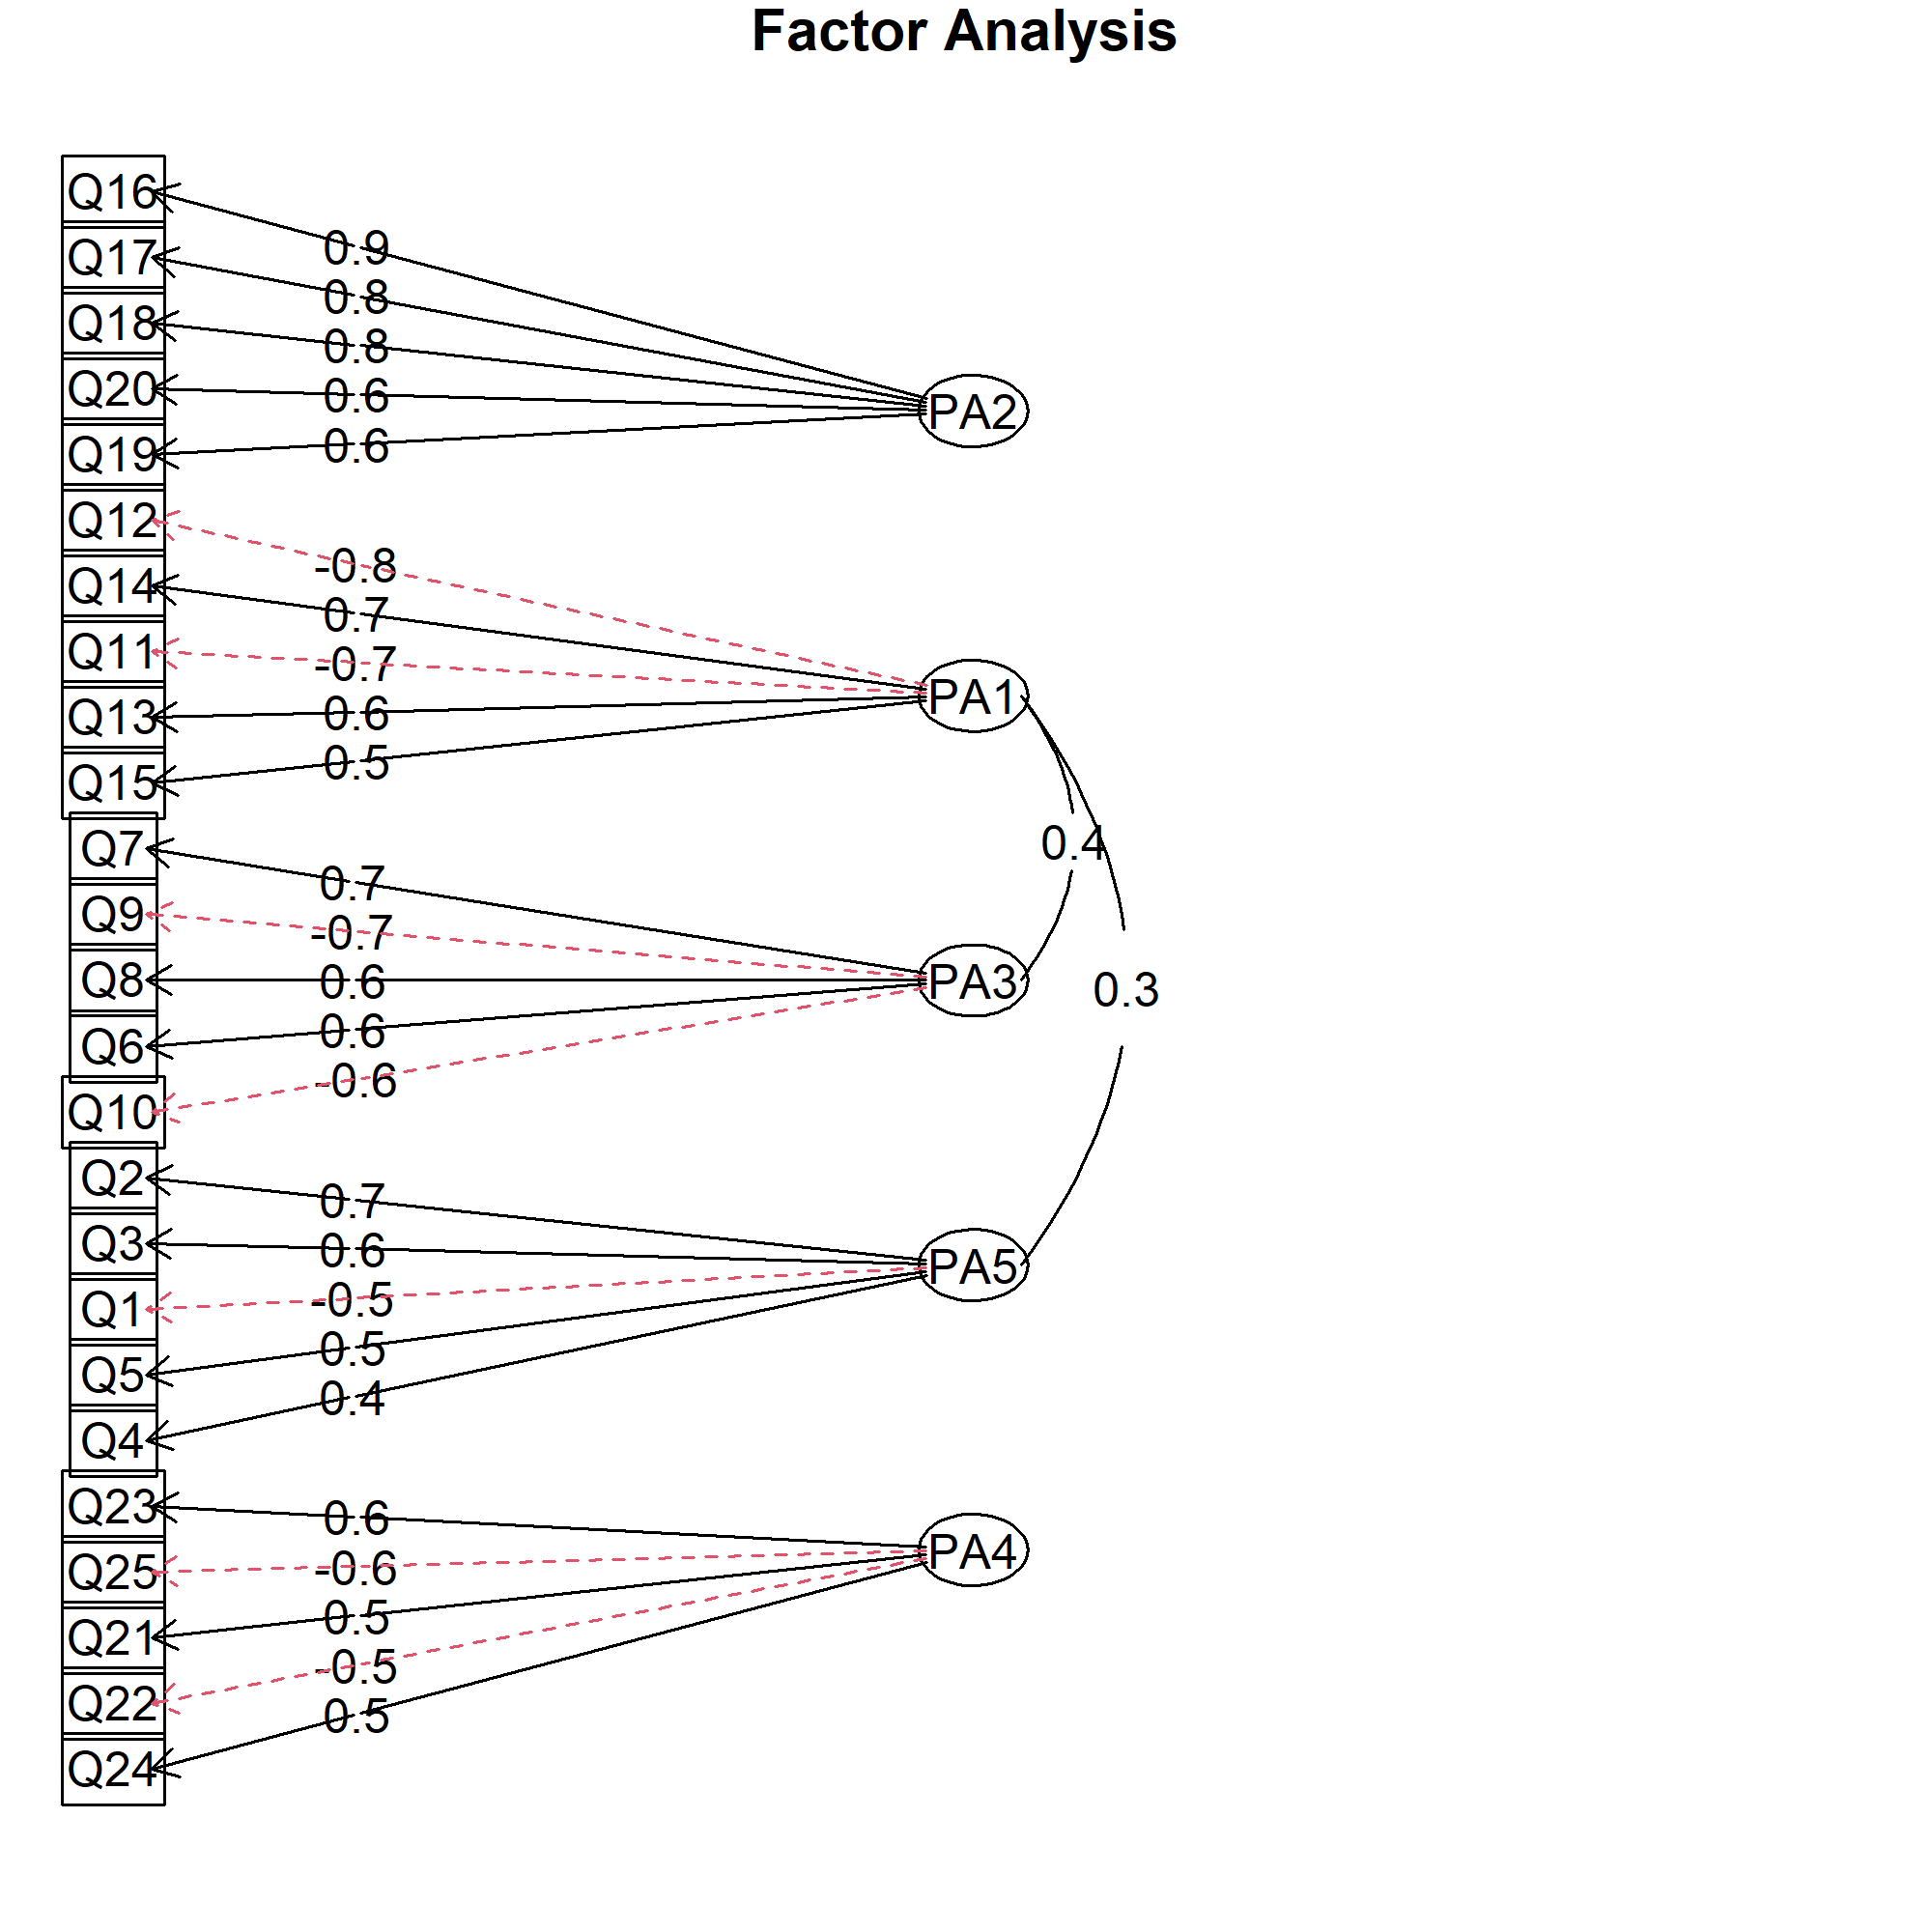
As seen, the negative associations are shown with red dashed lines, while the solid black lines represent the positive ones. The factor partitioning is clearly represented, and the factor correlations above 0.30 are also shown, which gives further insight into the relations in data.
If you want to change the cutoff value, you should set the cut argument to the cutoff value you want. Also, you can set the simple argument to FALSE, if you are interested in showing the cross-loadings (items sufficiently loading on more than one factor).
While fa.diagram() offers a quick way to produce a diagram, it doesn’t allow for fine-grained control over the placement of items and factors. Also, when the model is more complicated, it may not deliver the optimal visual design. Therefore, sometimes using other visualization tools like Lucidchart could be more beneficial for customized designs.
Video, Further Resources & Summary
Do you need more explanations on how to conduct EFA in R? Then you might check out the following video of the Statistics Globe YouTube channel.
In the video tutorial, we explain how to employ EFA and interpret the results.
The YouTube video will be added soon.
Furthermore, you could have a look at some of the other tutorials on Statistics Globe:
- Intoduction to Factor Analysis
- Exploratory Factor Analysis
- Confirmatory Factor Analysis (CFA)
- What is a Principal Component Analysis (PCA)?
This article has demonstrated how to perform EFA in R. If you have further questions, you may leave a comment below.

This page was created in collaboration with Cansu Kebabci. You might have a look at Cansu’s author page to get more information about academic background and the other articles she has written for Statistics Globe.

I’m Joachim Schork. On this website, I provide statistics tutorials as well as code in Python and R programming.
Statistics Globe Newsletter
Get regular updates on the latest tutorials, offers & news at Statistics Globe. I hate spam & you may opt out anytime: Privacy Policy.