Exploratory Factor Analysis
In this tutorial, I’ll explain how the Exploratory Factor Analysis (EFA) is used to uncover underlying relationships within a set of observed variables.
The table of contents is structured as follows:
Let’s dive into it!
Introduction
Exploratory Factor Analysis (EFA) is a statistical technique primarily used to uncover *latent (unobserved) structures or relationships within a set of *observed variables. It allows researchers to identify complex, underlying patterns of variable correlations that might not be immediately apparent.
Through this process, EFA results in a simplification of the data structure, which can be understood as an outcome of dimensionality reduction. This reduction is not the main goal of EFA but rather a byproduct that occurs as we unveil the core structures underlying the observed data. For a dimensionality reduction technique, see What is Principal Component (PCA)?
As with all statistical methods, EFA relies on some statistical assumptions. These assumptions are that the observed variables follow a multivariate normal distribution, maintain linear relationships with latent variables, are correlated, and the sample size is sufficiently large.
If your data meets these assumptions to a satisfactory degree and you intend to reveal underlying unobserved constructs in your dataset, then you can perform EFA. Let’s see the steps of EFA!
Steps to Perform PCA
In this section, the steps of performing EFA are theoretically explained. For the practical implementation in R, see Exploratory Factor Analysis in R to be published soon.
Data Collection and Preparation
In this step, data is collected on variables to be explored, and it is cleaned and preprocessed.
Correlation Matrix Computation
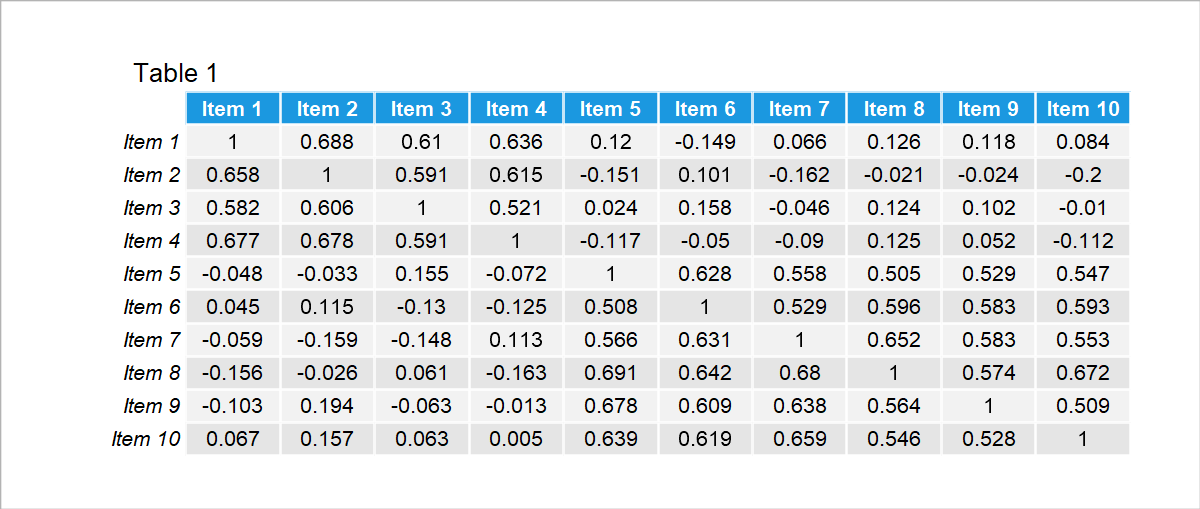
Once the data is prepared for analysis, the correlation matrix of the variables is calculated. This matrix is essential for understanding how different variables in the dataset relate to each other. The user can also compute statistics, like Kaiser-Meyer-Olkin (KMO), to ensure the correlation matrix is suitable for a factor analysis. Here is an **example correlation matrix of 10 observed variables below.

It seems like the first four and last six items are highly associated, which might be an indicator that they measure similar concepts.
Factor Number Estimation
Most statistical software provides multiple options for determining the number of factors (unobserved variables) to be formed. As a rule of thumb, any factor with an eigenvalue greater than 1 is retained. However, more sophisticated methods such as parallel analysis (PA) and minimum average partial (MAP) could also be preferred. For details, see this article.
EFA Procedure
Software packages (like R, SAS, or Python) have specific functions or procedures for conducting EFA. This step involves using a specific estimation method, e.g., PCA, PAF, ML, to analyze the correlation matrix with an initial estimation of the number of factors based on the previous step.
Output Rotation
The initial solution may not be easy to interpret. Therefore, the output is rotated to achieve a simple and interpretable factor structure by making the factor loadings (the correlations between the observed variables and the factors) more distinct. Software packages typically allow specifying the rotation method as a parameter when you run the factor analysis. See some explanations of possible rotations. It is advised to try out different rotations and keep the most interpretable solution.
Factor Interpretation
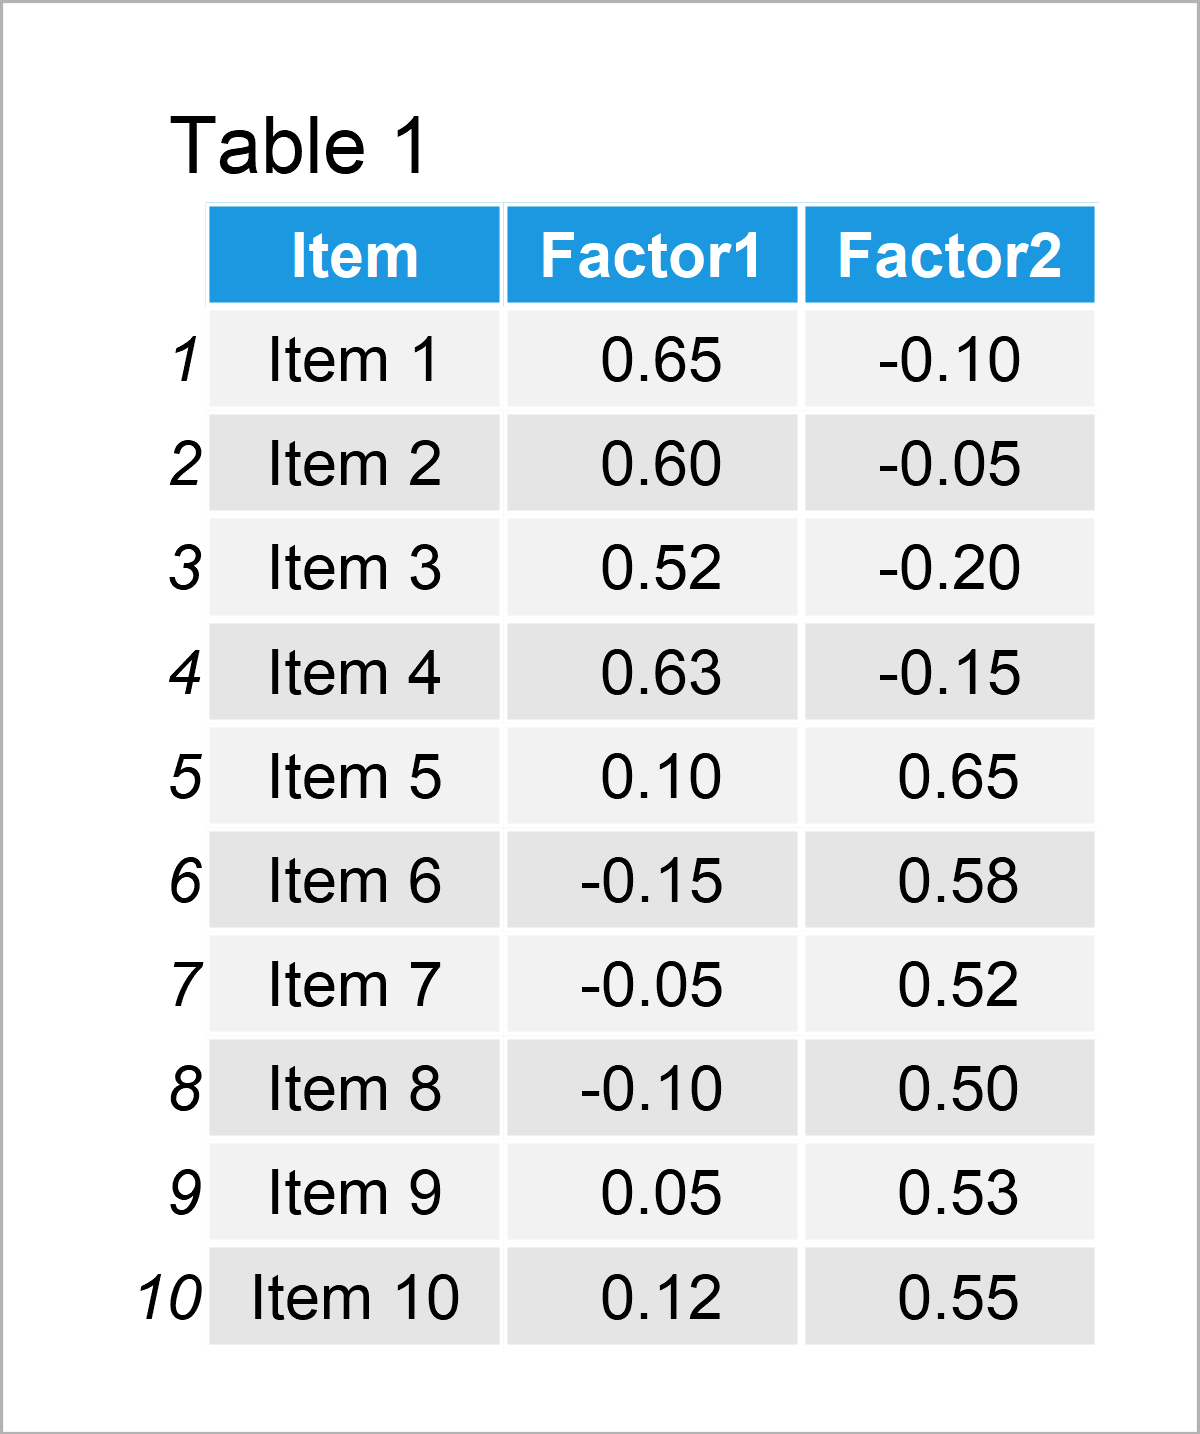
After completing EFA, we assess the factors by examining their loadings. Loading with an absolute value of 0.30 or higher suggests that the variable is strongly linked to that factor. Based on these significant loadings, we identify the underlying concept each factor represents and assign descriptive names accordingly. See the **sample output below.

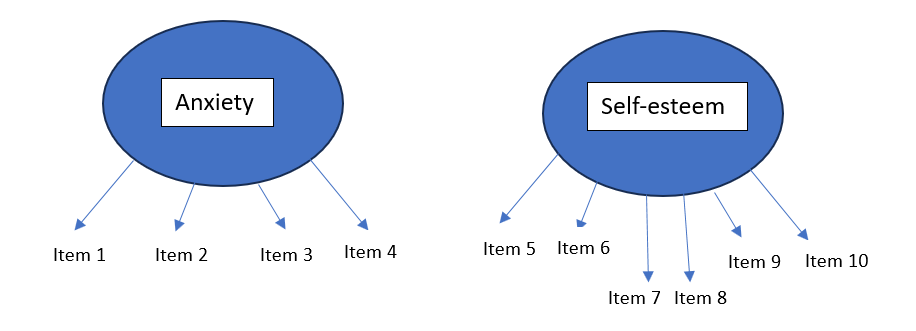
As observed, the initial four variables have strong loadings on the first factor, while the remaining six load heavily on the second factor. Suppose the first four variables pertain to questions about anxiety, and the last six are questions measuring self-esteem in a survey. In this context, we can label these factors as ‘Anxiety’ and ‘Self-Esteem.’ and the final factor structure can depicted as shown below.

In the figure above, the arrows are pointing to the observed variables (Item1, Item2, etc.). This is because latent variables cause/influence the observed variables in FA context. See our Introduction to Factor Analysis tutorial for a better understanding of the causal relations in factor analysis models.
Reliability Assessment
Finally, the reliability of the structured factors can be assessed, for instance, by Cronbach’s alpha, which asses if the items that load on a particular factor are measuring the same underlying construct consistently. For the given example, it should be measured for the anxiety and self-esteem constructs.
*Observed variables can also be referred to as manifest variables, indicators, and endogenous variables, whereas latent variables can be referred to as factors, constructs, unobserved/underlying variables, and exogenous variables in the context of EFA.
**The example data is randomly generated; hence does not reflect any real analysis output.
Video, Further Resources & Summary
Do you need more explanations on how to conduct EFA? Then you might check out the following video of the Statistics Globe YouTube channel.
In the video tutorial, we explain how to perform EFA.
The YouTube video will be added soon.
Furthermore, you could have a look at some of the other tutorials on Statistics Globe:
This article has demonstrated how to perform EFA to uncover underlying relationships. If you have further questions, you may leave a comment below.
This page was created in collaboration with Cansu Kebabci. You might have a look at Cansu’s author page to get more information about academic background and the other articles she has written for Statistics Globe.


