Draw Two Data Sets with Different Sizes in ggplot2 Plot in R (2 Examples)
In this tutorial, I’ll show how to draw a ggplot2 plot of two data frames with different sizes in the R programming language.
The article consists of this content:
Let’s just jump right in.
Example Data & Software Packages
The following two data sets are used as basement for this R programming tutorial.
First, we have to set a random seed for reproducibility:
set.seed(328957634) # Set seed for reproducibility
Next, we can use the following R code to create our first example data frame:
data_large <- data.frame(x = rnorm(1000) + 1:10,  # Create first data frame
                         y = rnorm(1000))
head(data_large)                                  # Print head of first data frame
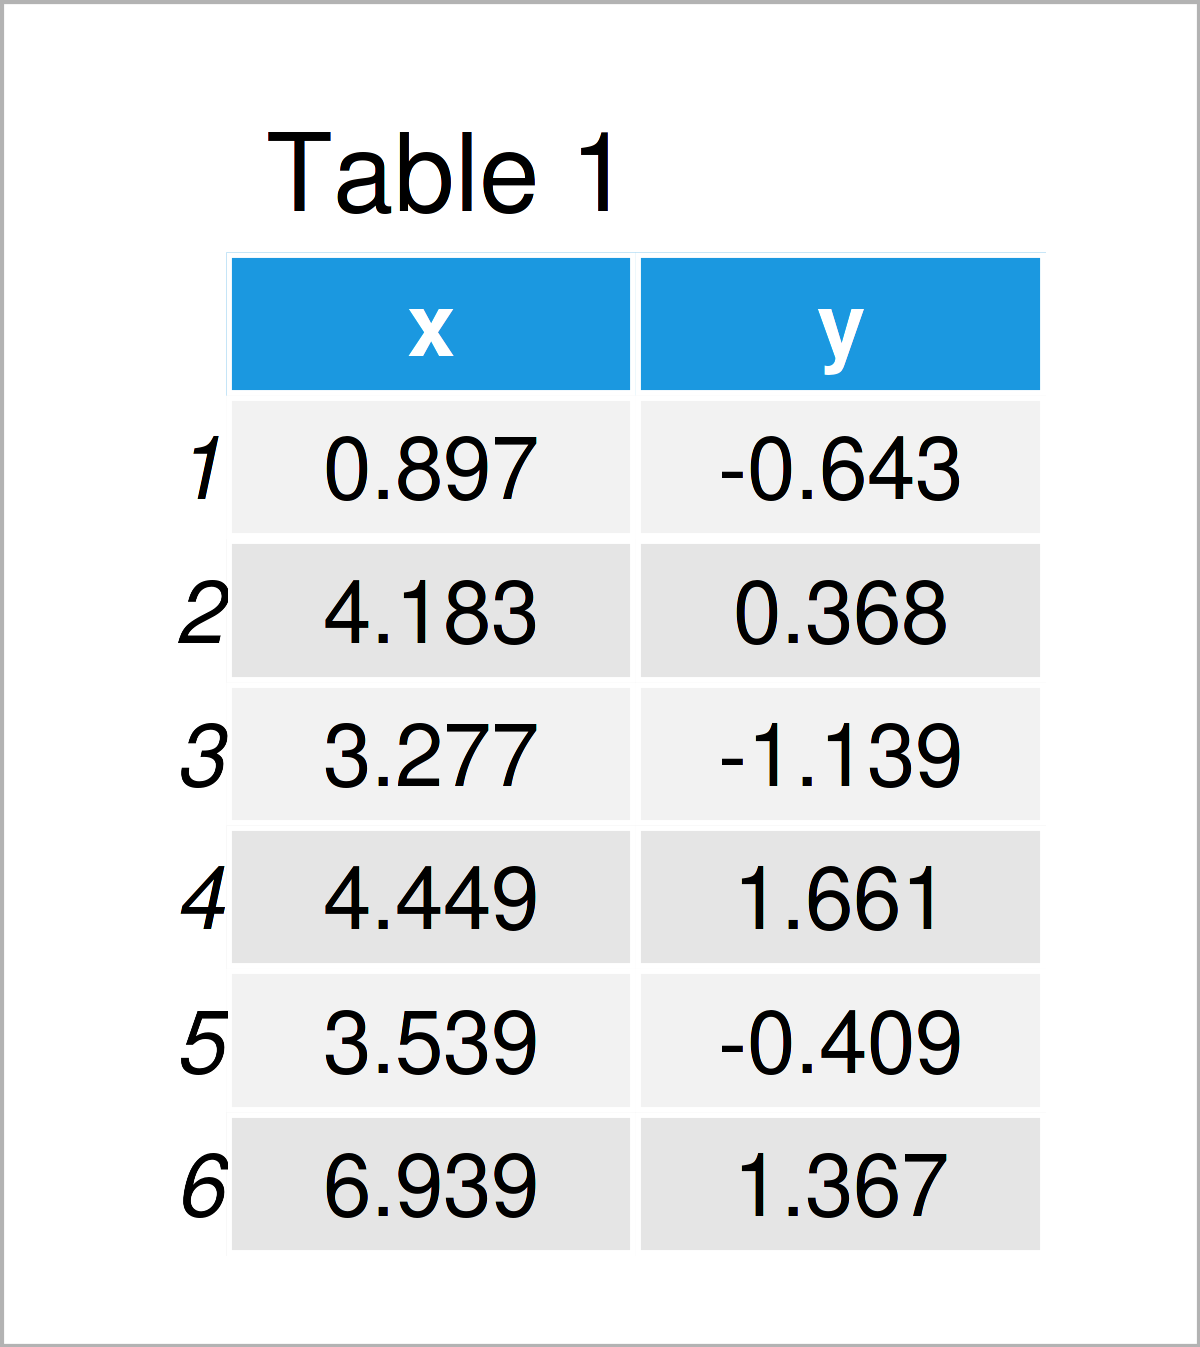
And the following R code to create our second example data frame:
data_small <- data.frame(x = rnorm(10, 5),        # Create second data frame
                         y = rnorm(10))
data_small                                        # Print second data frame
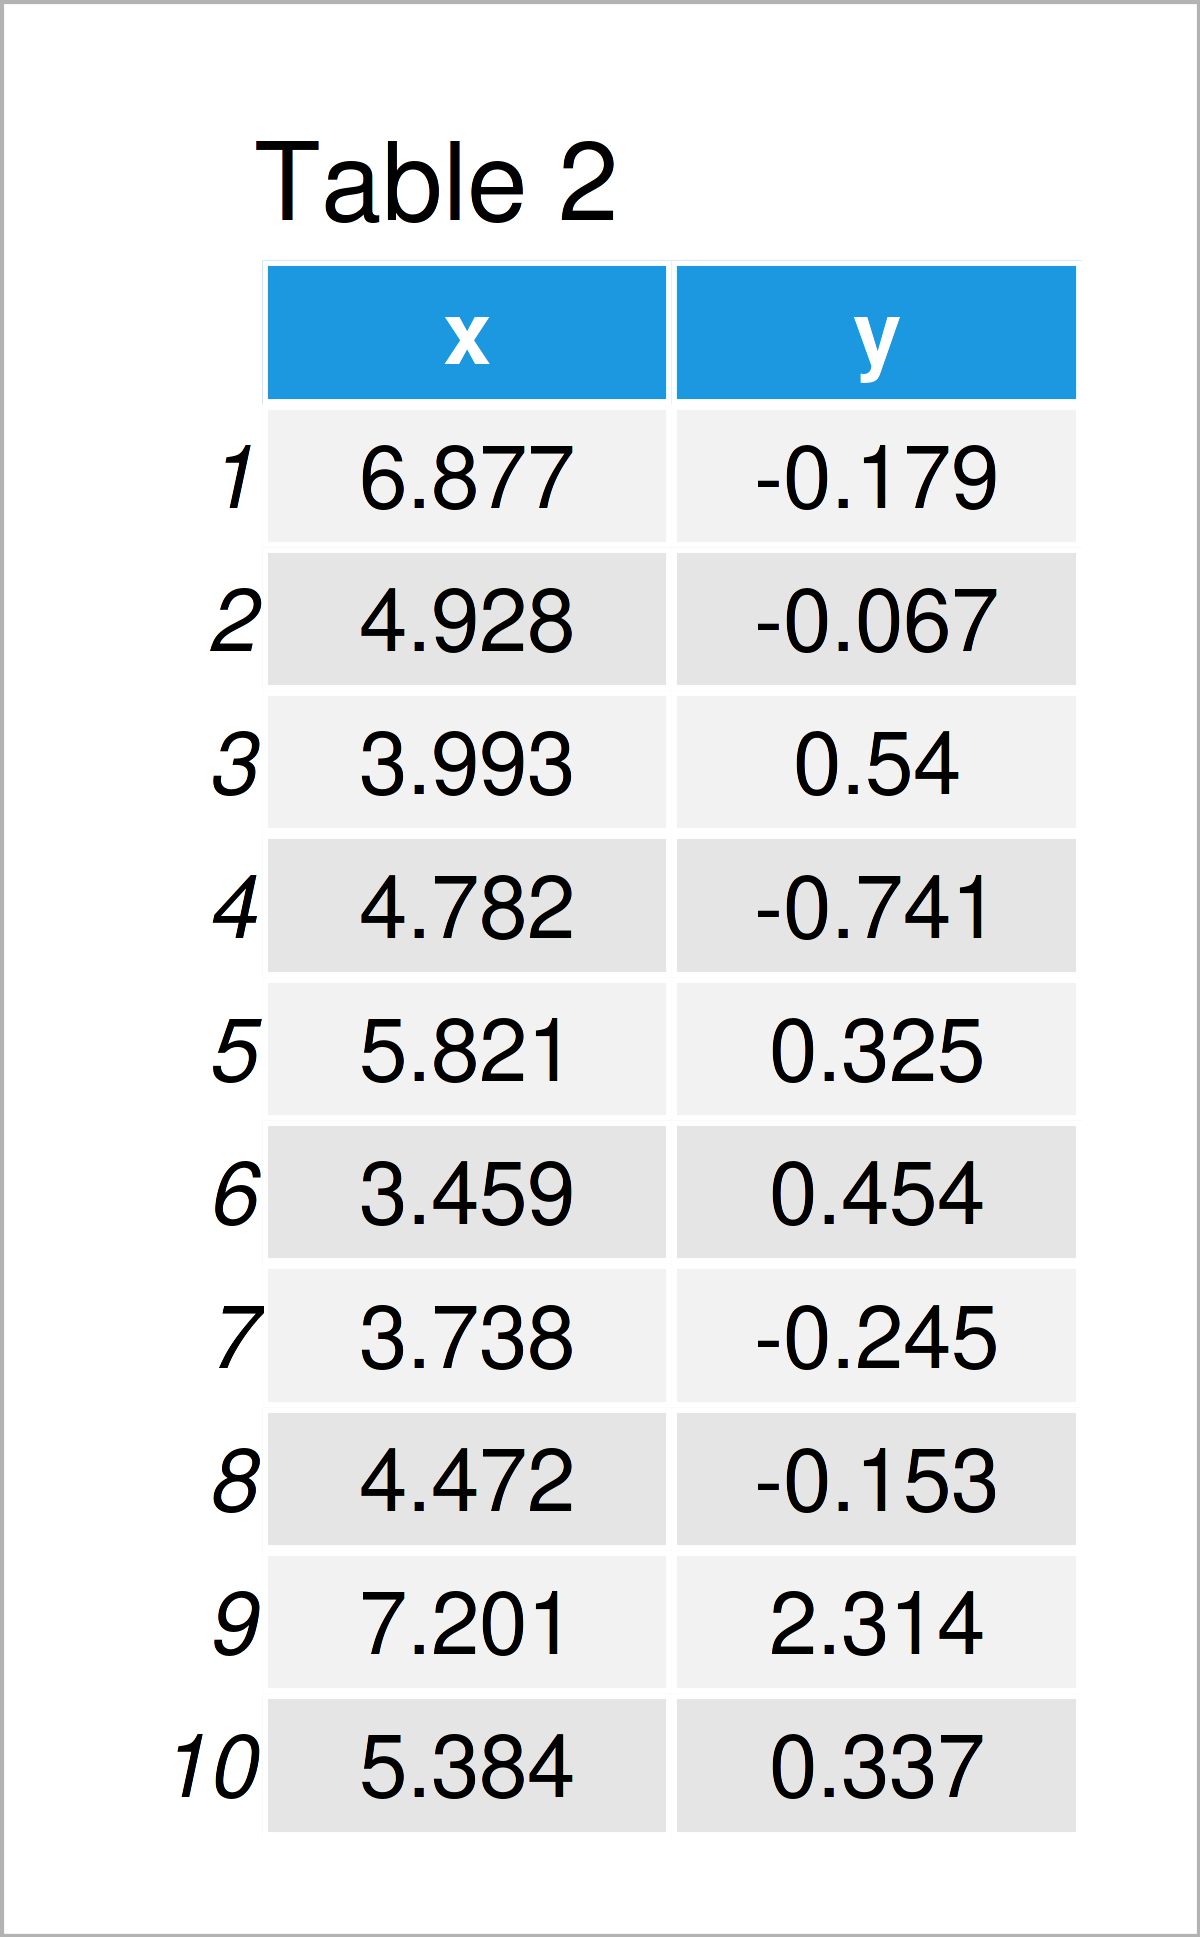
After executing the previous R programming codes a larger data frame with 1000 rows and a smaller data frame with only 10 rows have been created.
If we want to plot our example data with the ggplot2 package, we also have to install and load ggplot2:
install.packages("ggplot2")                       # Install & load ggplot2
library("ggplot2")
We are set up, let’s move on to the examples!
Example 1: Draw Two Data Sets with Different Sizes Using ggplot2 Package
This example explains how to draw a ggplot2 plot based on two different data sources.
For this, we have to set the data argument within the ggplot function to be equal to NULL, and then we have to specify the two different data frames within two different calls of a geom_ function (in this case geom_point).
Note that it’s important that both data frames have the same column names.
ggp1 <- ggplot(NULL, aes(x, y)) +                 # Draw two data frames in ggplot2 plot
  geom_point(data = data_large,
             col = "#1b98e0") +
  geom_point(data = data_small,
             col = "red",
             size = 5)
ggp1
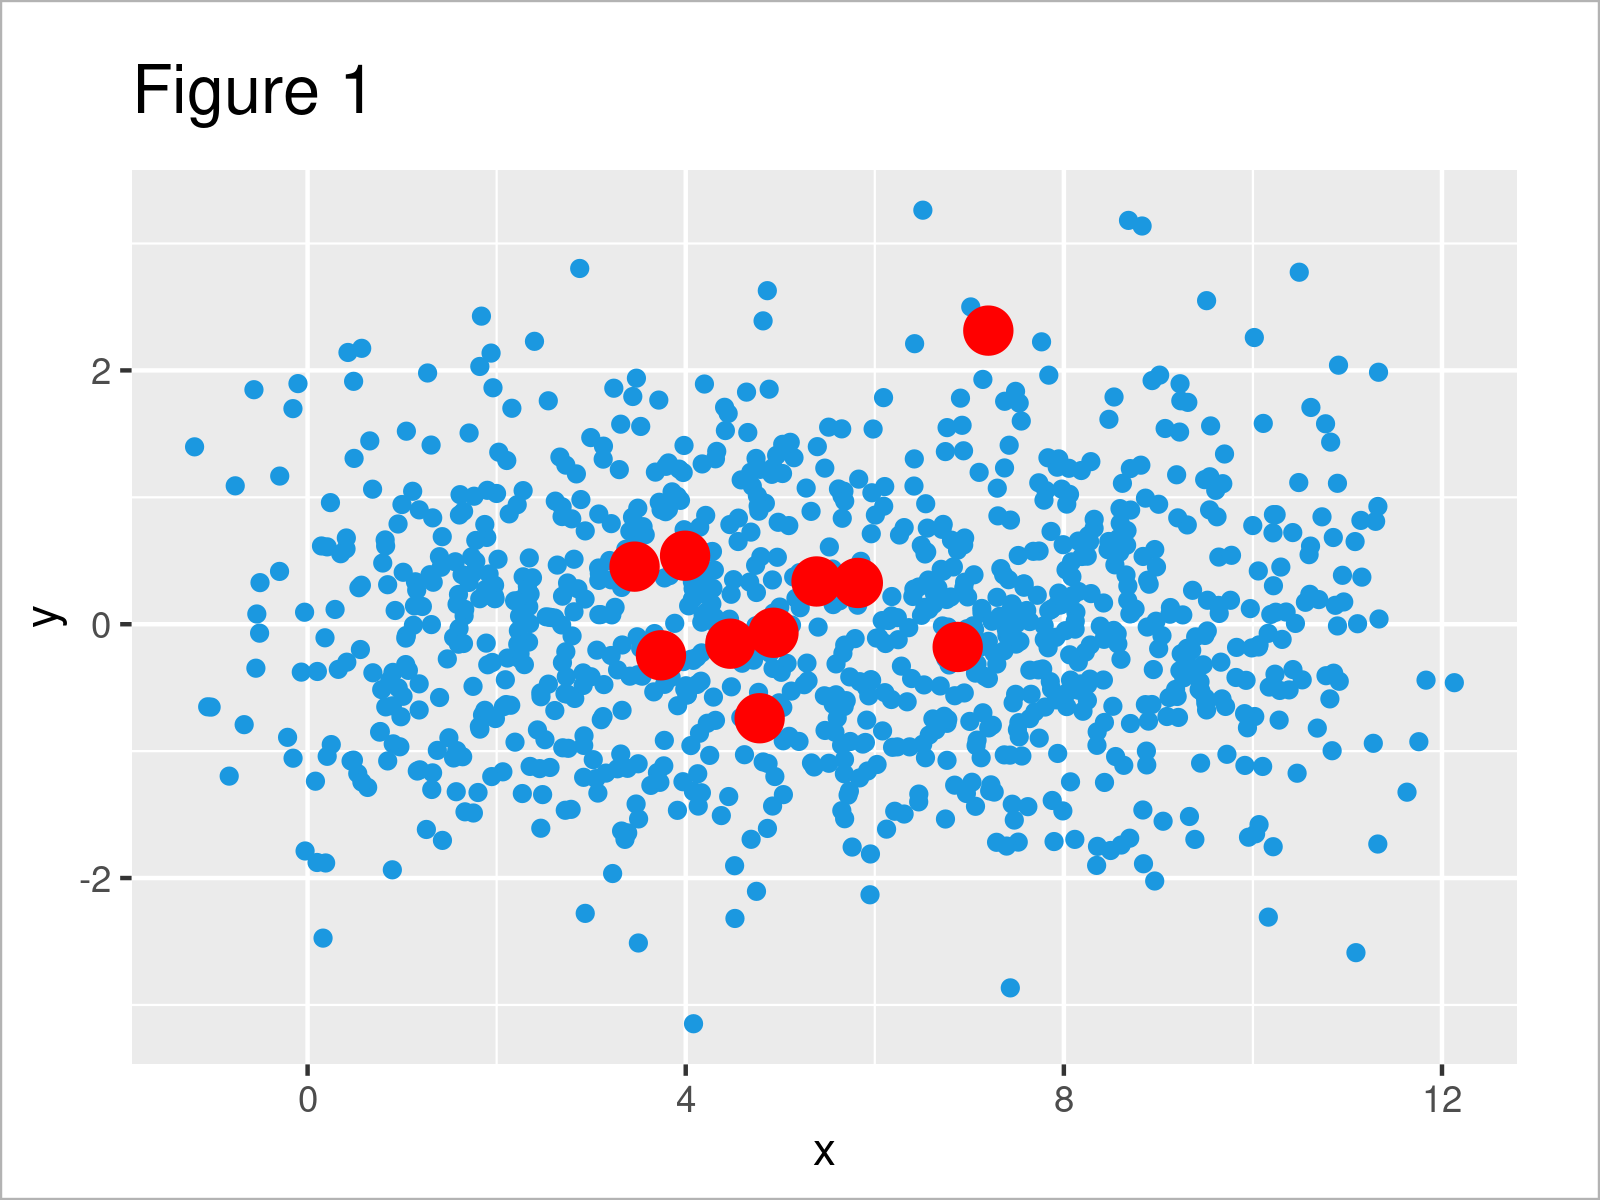
As shown in Figure 1, we have created a ggplot2 scatterplot based on two different data sets with different sizes.
Example 2: Combine Two Data Sets Before Drawing in ggplot2 Plot
Another approach is to concatenate both data frames before drawing the in a ggplot2 graphic.
Consider the following R code:
data_all <- data.frame(rbind(data_large,          # Combine both data frames
                             data_small),
                       col = c(rep("#1b98e0", nrow(data_large)),
                                 rep("red", nrow(data_small))),
                       size = c(rep(1.5, nrow(data_large)),
                                rep(5, nrow(data_small))))
After executing the previous syntax, we have created a new data frame that contains the first and second example data frames as well as two additional variables to specify the colors and sizes of our points.
We can now use these data to draw a ggplot2 plot with only one call of the geom_point function.
Note that we have to specify the col and size columns of our new data frame within the geom_point function:
ggp2 <- ggplot(data_all, aes(x, y)) +             # Draw combined data frame
  geom_point(col = data_all$col,
             size = data_all$size)
ggp2
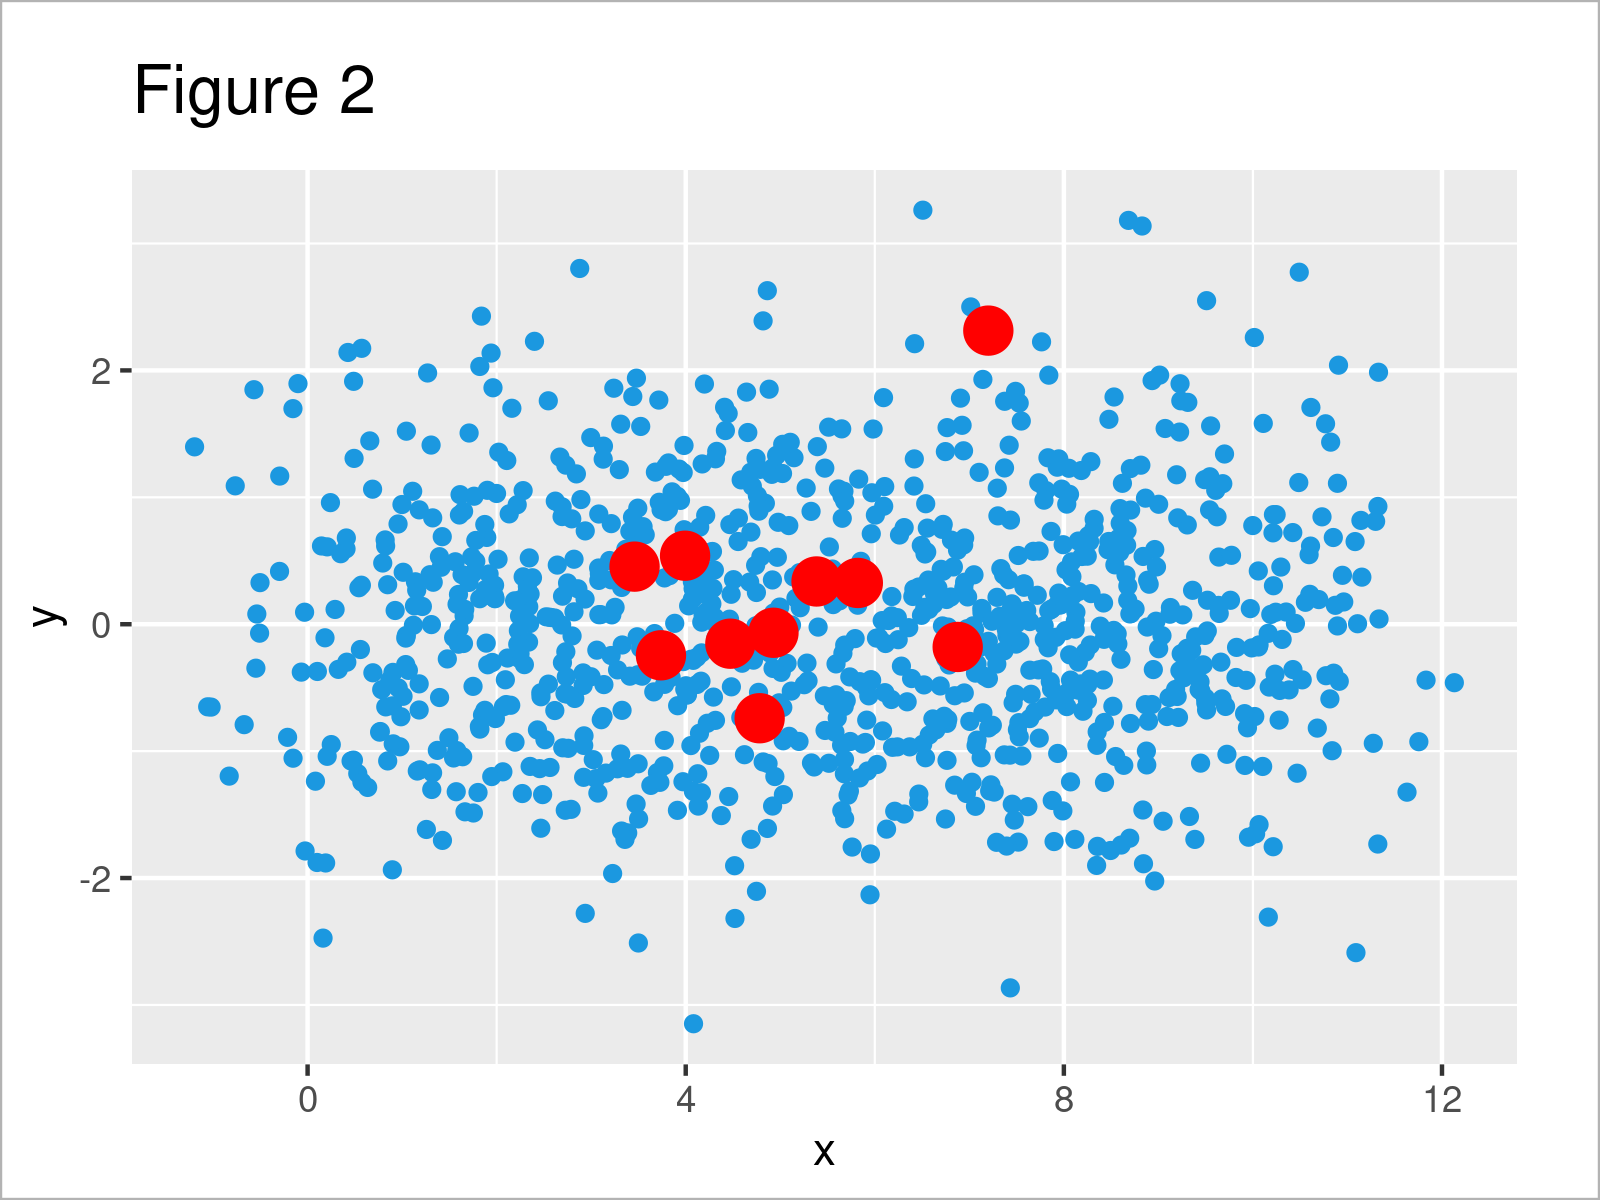
In Figure 2 it is shown that we have plotted exactly the same graph as in Example 1. However, this time we have merged our data before creating a ggplot2 graphic.
Video, Further Resources & Summary
Do you need further explanations on the R programming syntax of this article? Then you might want to have a look at the following video on my YouTube channel. In the video, I show the R code of the present page in a live programming session.
In addition, you may want to have a look at the other articles on my homepage. A selection of articles is listed below.
- Draw ggplot2 Plot with Factor on X-Axis
- Draw ggplot2 Plot with Lines and Points
- Combine Two Data Frames with Different Variables by Rows
- Add Different Line to Each Facet of ggplot2 Plot
- Add Regression Line to ggplot2 Plot
- Introduction to the ggplot2 Package
- Graphics Overview in R
- All R Programming Examples
In summary: In this article, I have demonstrated how to draw a ggplot2 plot of two data frames with different number of rows in R. In case you have any additional questions, please let me know in the comments section.




2 Comments. Leave new
Hello,
Thanks for this.
1) Can this be done for ‘boxplots’ instead of points or scatter?
2) What about if there is a 2 more columns:
a) sample-name = where half the names are the same in data_large and data_small, (data_small being a subset of data_large)
b) group = where data_small has 2 groups ‘a’, ‘b’ whilst data_large has 4 groups ‘a’, ‘c’,’d’,’e’
Hey,
Yes, you can. For instance, you may draw the following plot based on the data created in Example 2:
Regards,
Joachim