Draw ggplot2 Barplot with Round Corners in R (2 Examples) | ggchicklet Package
In this tutorial, I’ll demonstrate how to create a ggplot2 barchart with rounded bars using the ggchicklet package in the R programming language.
The content of the page is structured as follows:
Let’s do this…
Introduction to the ggchicklet Package
The ggchicklet package, created and maintained by Bob Rudis, provides functions to create rounded rectangle segmented column charts (i.e. “chicklets”).
Please find more info on the development of this package on its GitHub page.
Example 1: Draw ggplot2 Barplot with Round Corners Using ggchicklet Package
In Example 1, I’ll show how to draw barplots with rounded corners using the ggplot2 and ggchicklet packages in R.
For this example, we first have to create some data:
data1 <- data.frame(value = 1:4,                  # Create example data
                    group = LETTERS[1:4])
data1                                             # Print example data
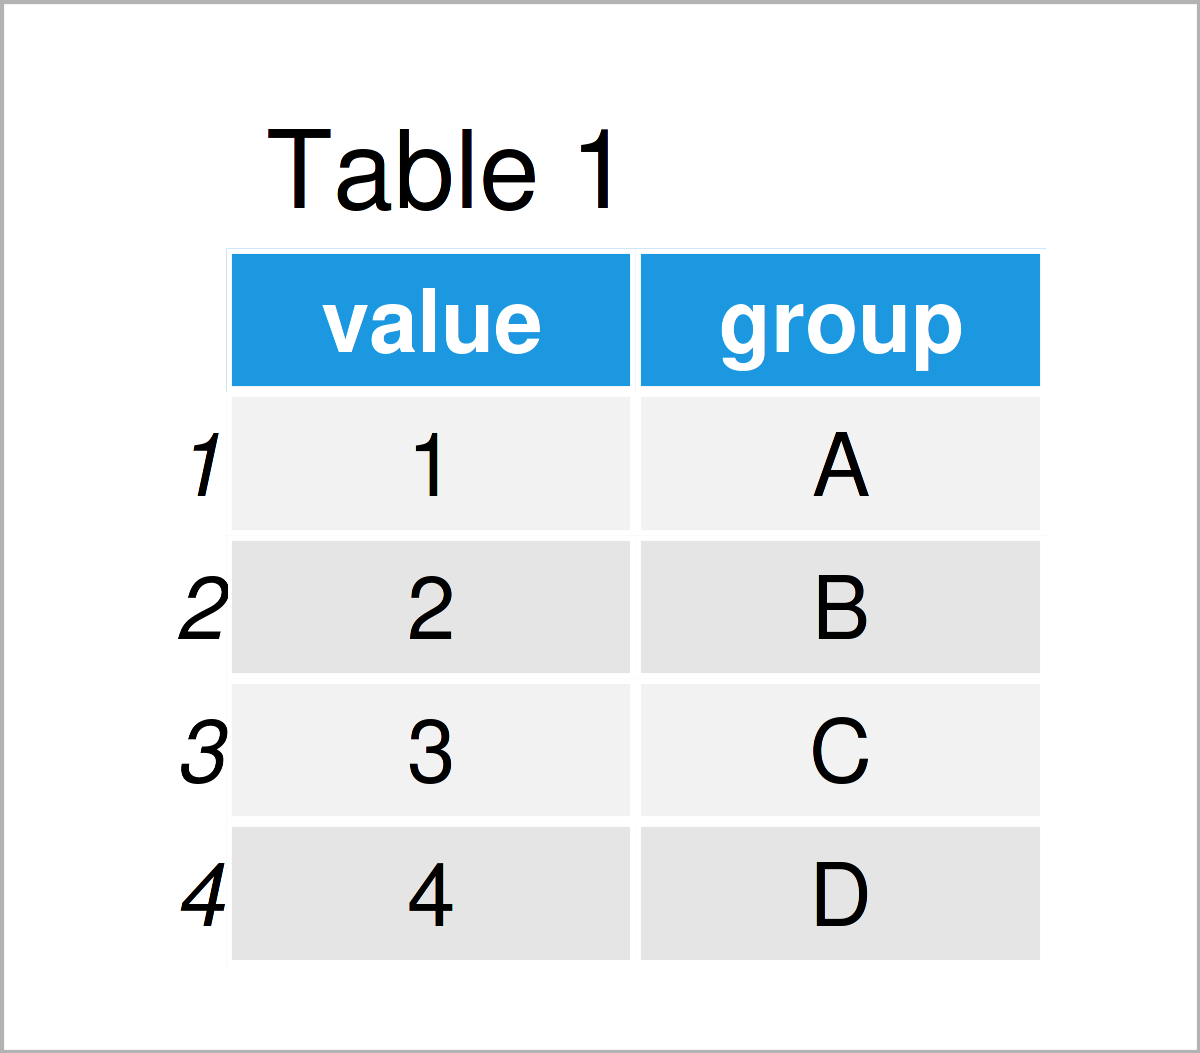
By running the previous code, we have created Table 1, i.e. a data frame containing a numeric and a character column.
Next, we have to install and load the ggplot2 package:
install.packages("ggplot2")                       # Install ggplot2 package
library("ggplot2")                                # Load ggplot2 package
We can now draw a regular ggplot2 barplot using the geom_col function as shown below:
ggplot(data1, aes(group, value)) +                # ggplot2 barplot with regular corners
  geom_col()
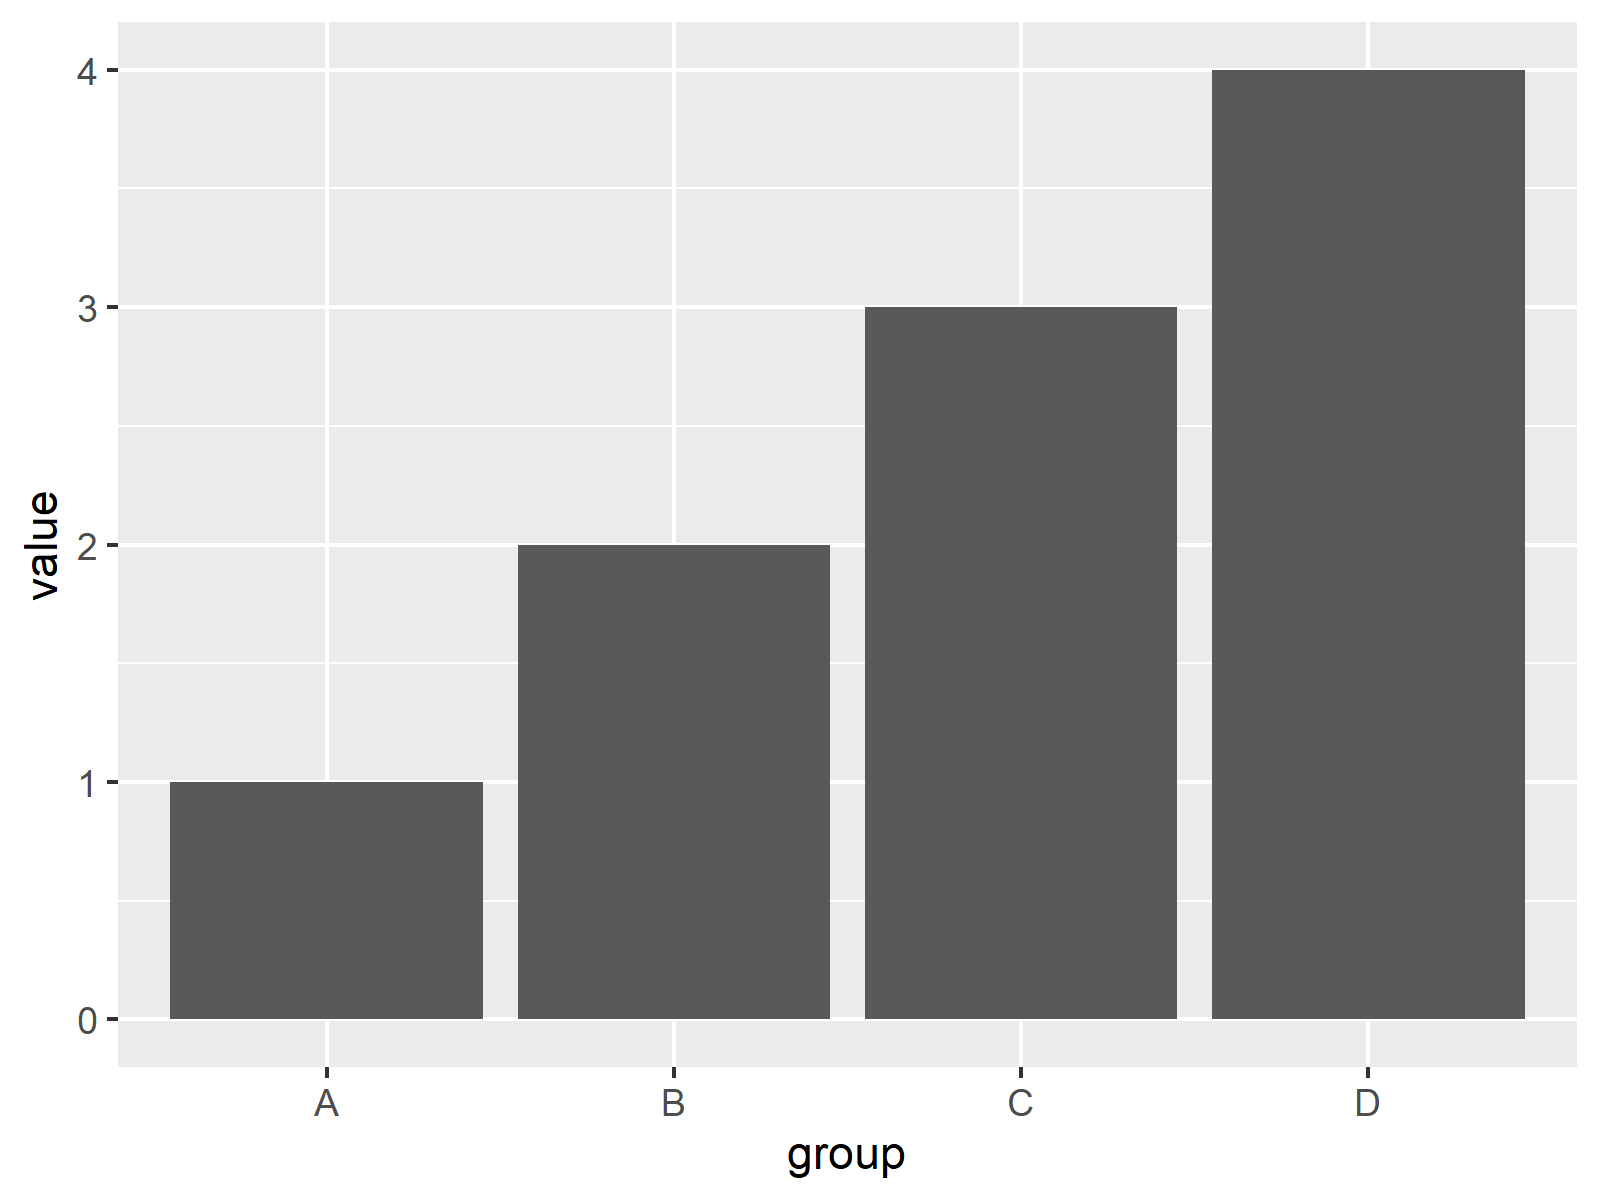
After executing the previous R programming code the barchart visualized in Figure 1 has been created. As you can see, the corners of the bars are not rounded yet.
To create a bargraph with round corners, we have to install and load the ggchicklet software package as well:
install.packages("ggchicklet",                    # Install & load ggchicklet package
                 repos = "https://cinc.rud.is")
library("ggchicklet")
Now, we can use the geom_chicklet function of the ggchicklet package to draw a barplot with round corners. Note that we can use the radius argument within the geom_chicklet function to specify how round the corners should be:
ggplot(data1, aes(group, value)) +                # ggplot2 barplot with round corners
  geom_chicklet(radius = grid::unit(3, "mm"))
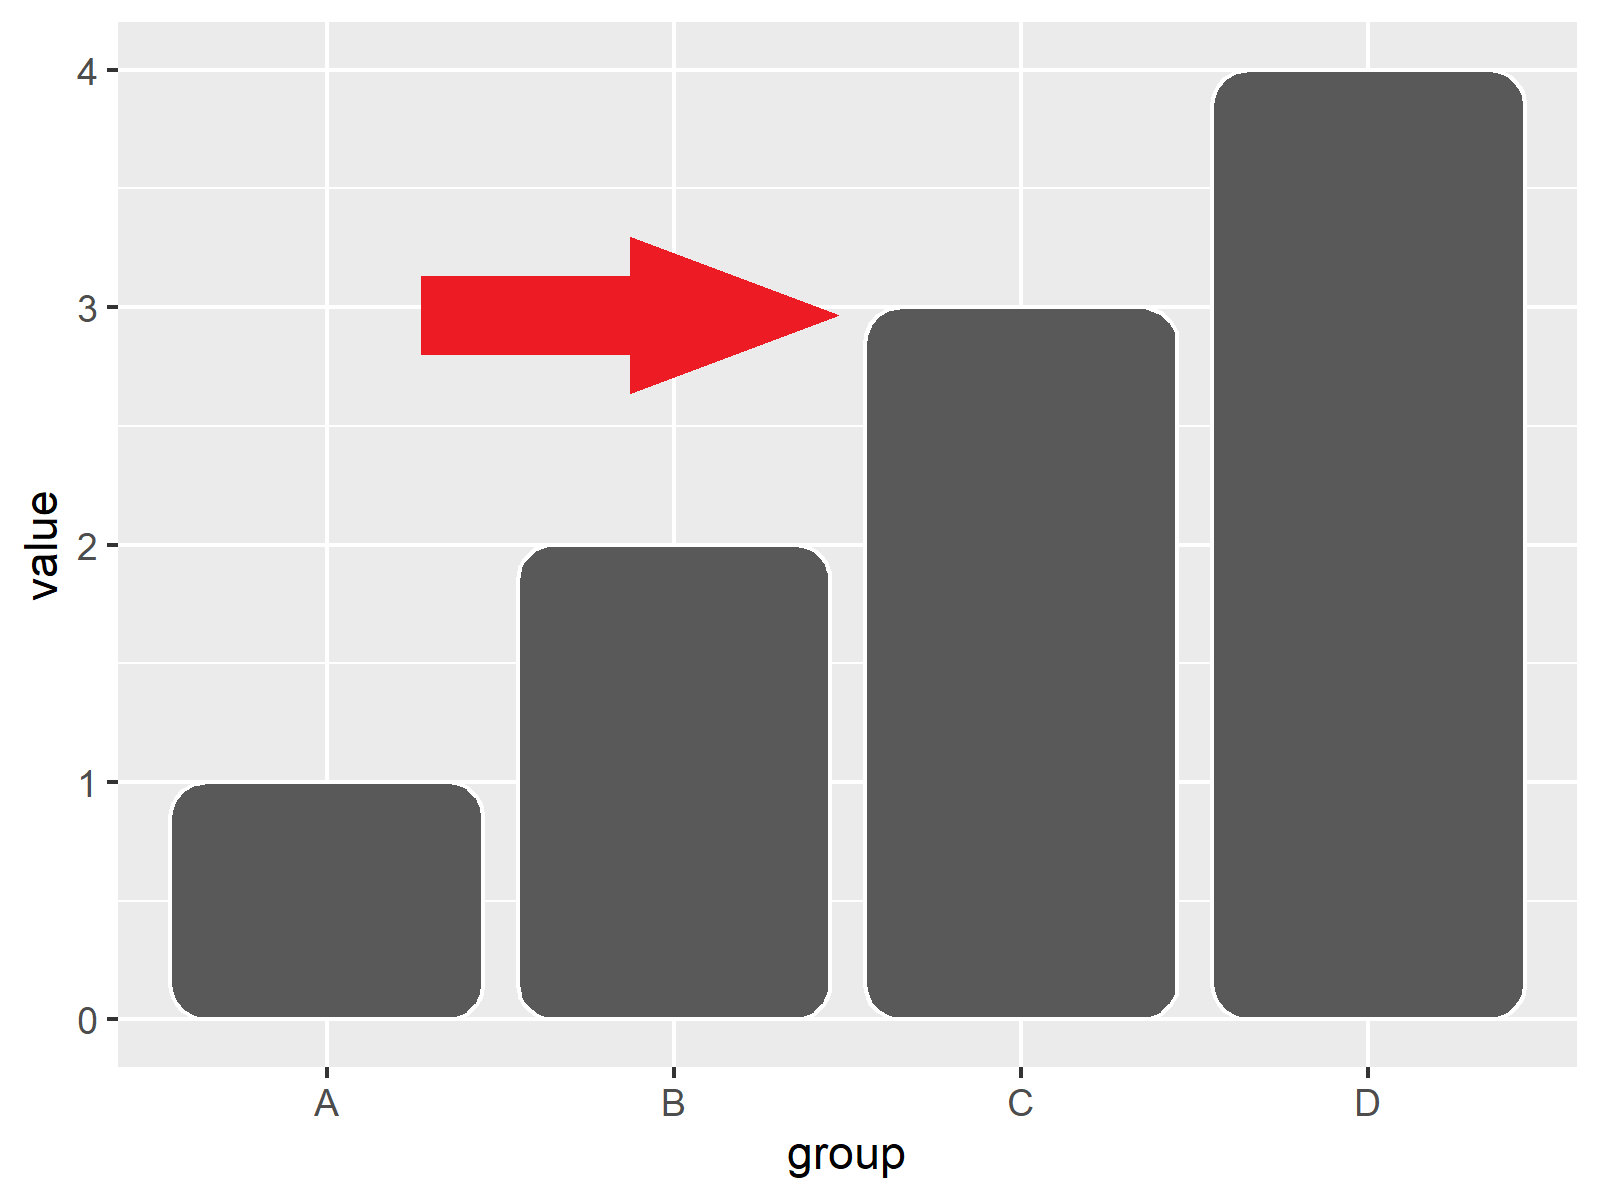
As you can see, we have created another ggplot2 barplot, but this time the corners of the bars have been rounded.
Example 2: Draw Stacked ggplot2 Barplot with Round Corners Using ggchicklet Package
In my opinion, rounded corners look especially petty when drawing stacked barplots.
To illustrate that, we first have to create another data set:
data2 <- data.frame(value = 1:12,                 # Create example data
                   group = rep(LETTERS[1:4], each = 3),
                   sub = letters[1:3])
data2                                             # Print example data
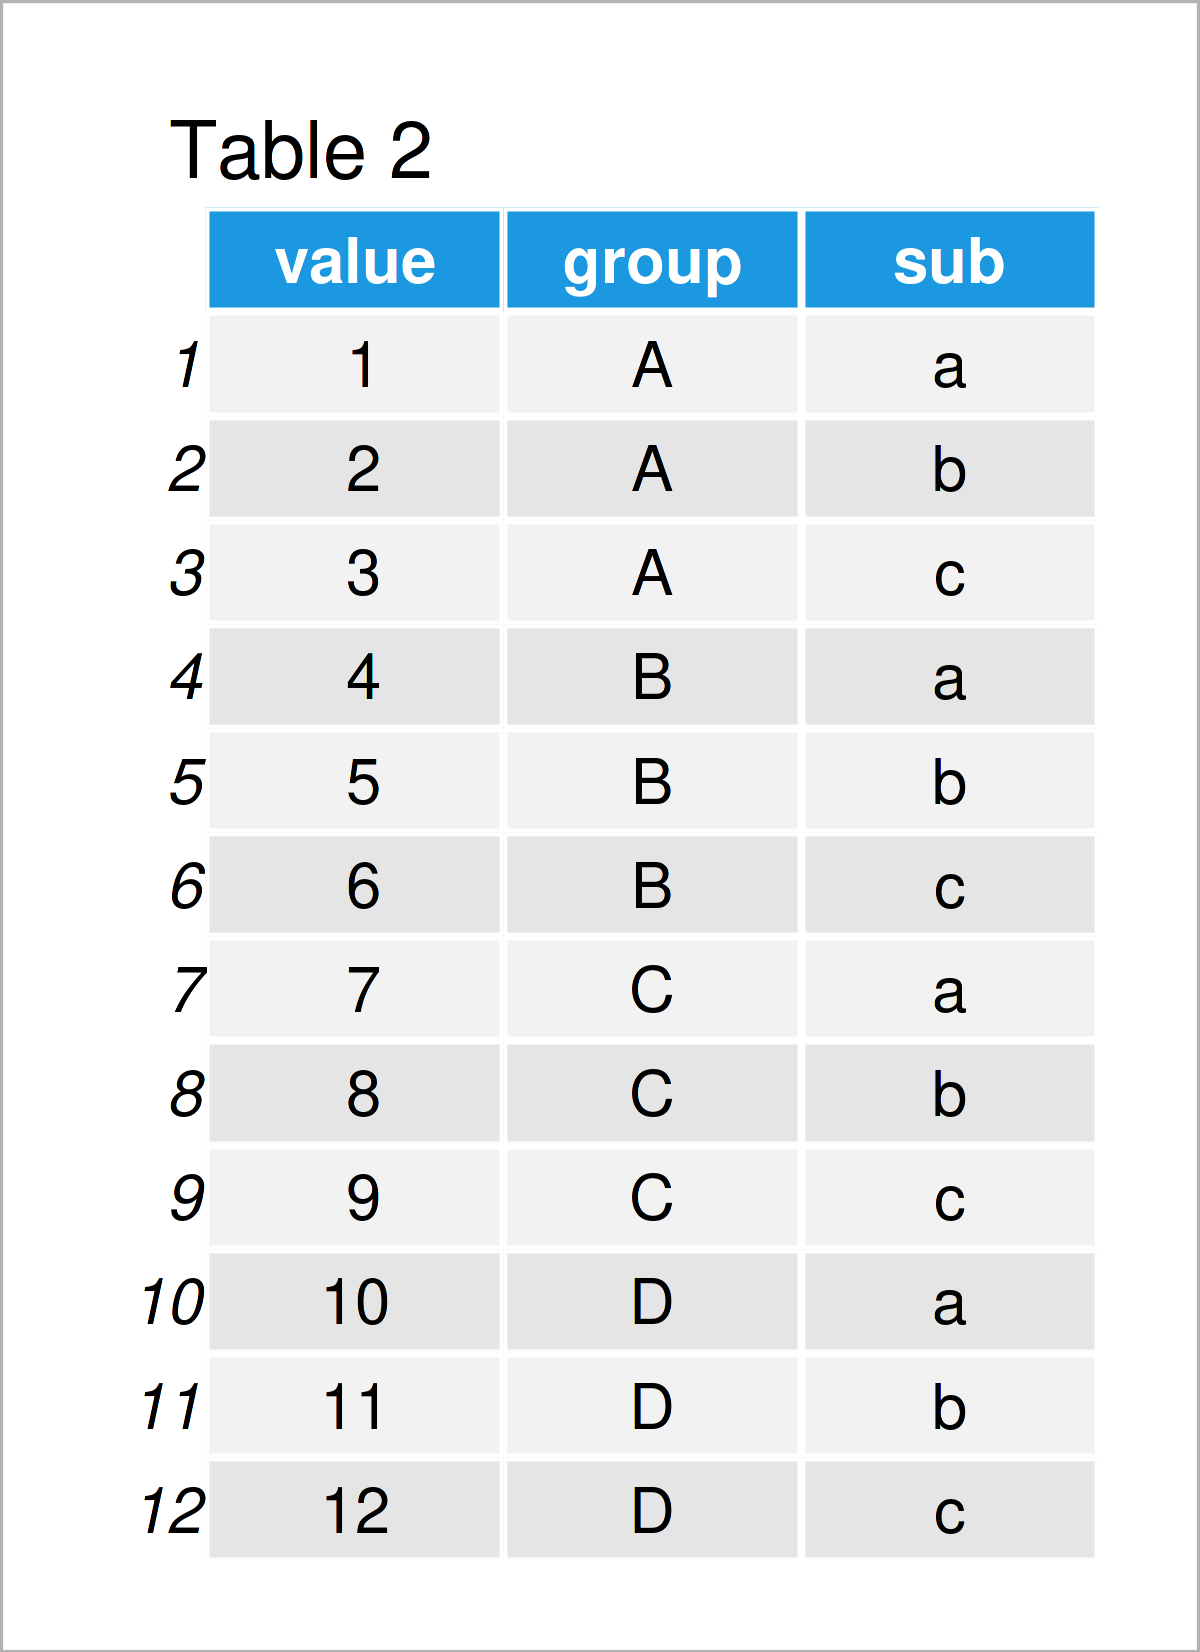
Table 2 shows the output of the previous code: A data frame with a values column as well as group and subgroup columns.
Next, we can use the geom_chicklet function to draw a stacked barplot of these data. Note that we are also specifying the fill argument within the aesthetics of our plot:
ggplot(data2, aes(group, value, fill = sub)) +    # Stacked barplot with round corners
  geom_chicklet(radius = grid::unit(3, "mm"))
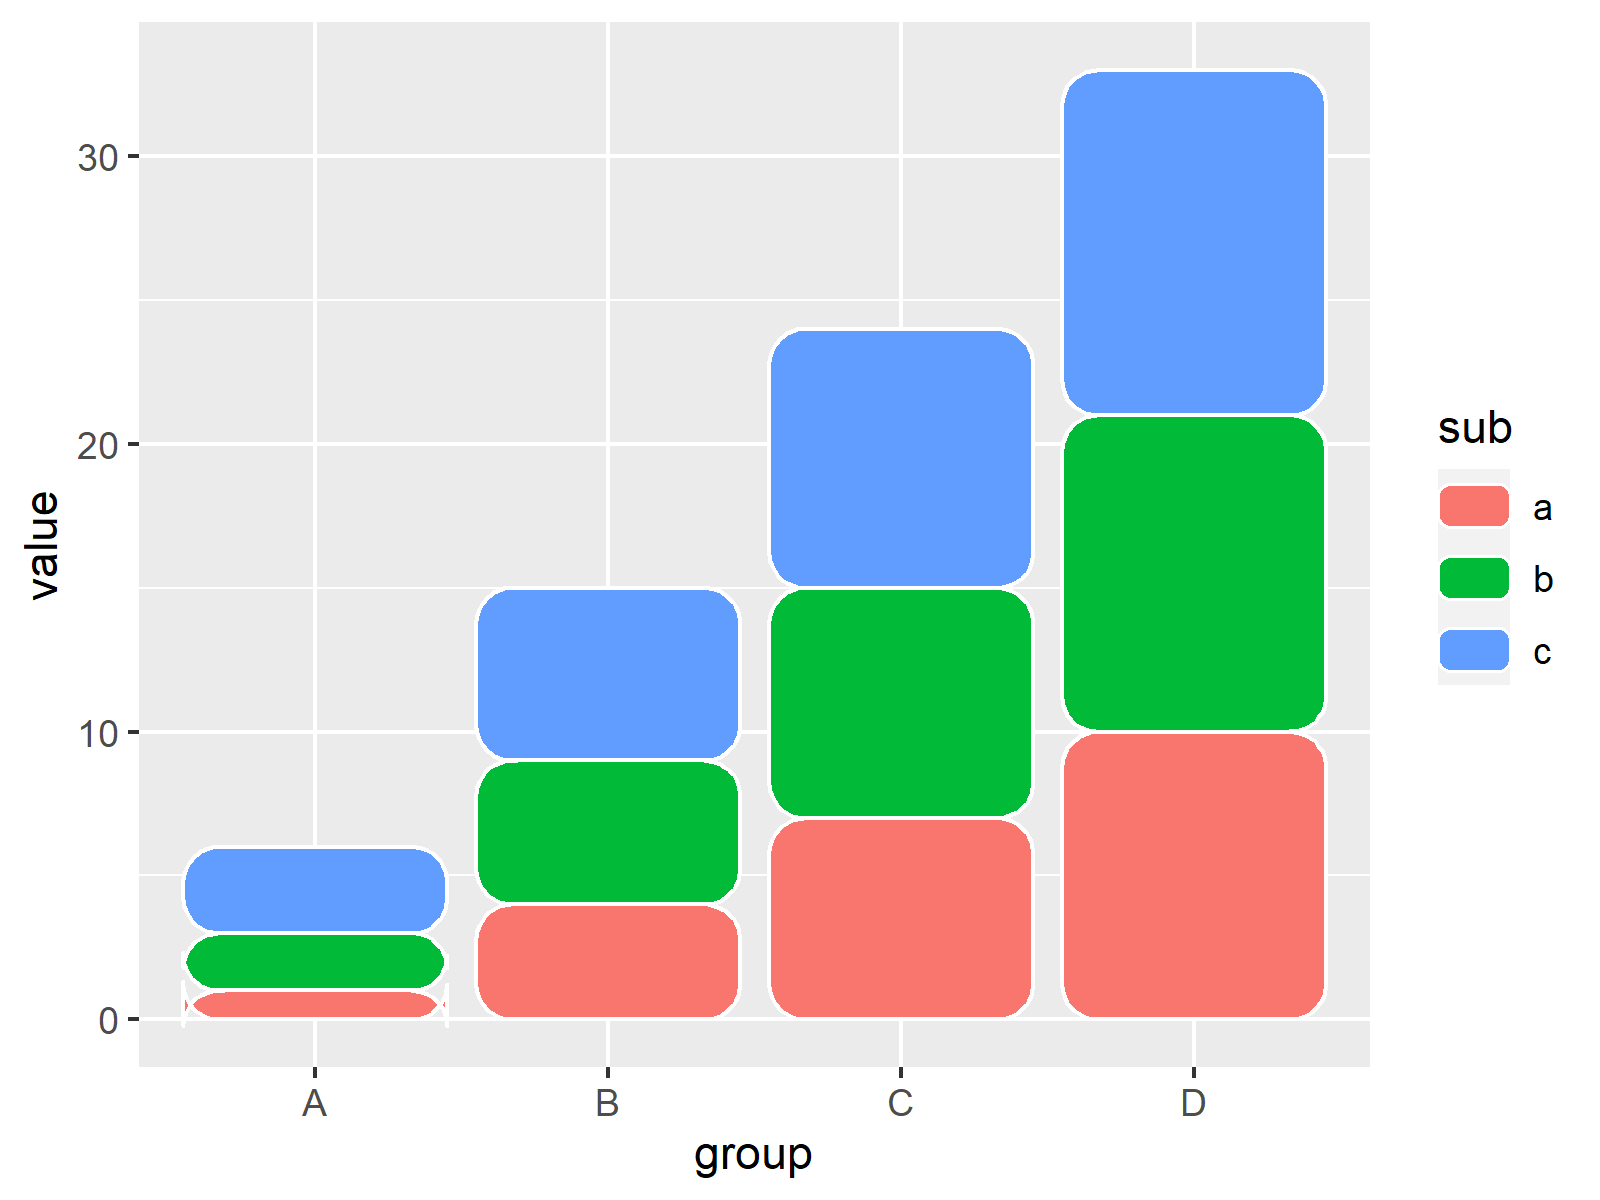
The previous R syntax has produced Figure 3, i.e. a stacked barchart with round corners.
Video, Further Resources & Summary
Do you want to learn more about the creation of a ggplot2 barchart with rounded bars using the ggchicklet package? Then I can recommend watching the following video on my YouTube channel. I show the content of this article in the video.
Furthermore, you might want to read the other tutorials on statisticsglobe.com.
- Graphics in R – Introduction to the ggplot2 Package
- Change Space & Width of Bars in ggplot2 Barplot
- Add Regression Line to ggplot2 Plot
- Draw Dates to X-Axis of Plot in R
- Draw ggplot2 Plot with Factor on X-Axis in R
- Plotting Data in R
- The R Programming Language
To summarize: You have learned in this article how to draw a ggplot2 barplot with rounded bars using the ggchicklet package in R programming. If you have further questions, please tell me about it in the comments section. Furthermore, please subscribe to my email newsletter in order to receive updates on new articles.


