Create Lagged Variable by Group in R (Example)
In this R programming tutorial you’ll learn how to add a column with lagged values by group to a data frame.
The content is structured as follows:
You’re here for the answer, so let’s get straight to the exemplifying R code:
Introduction of Example Data
The first step is to create some data that we can use in the examples later on:
data <- data.frame(group = c(rep(LETTERS[1:3],    # Create example data
                                 each = 3),
                             "C"),
                   values = 11:20)
data                                              # Print example data

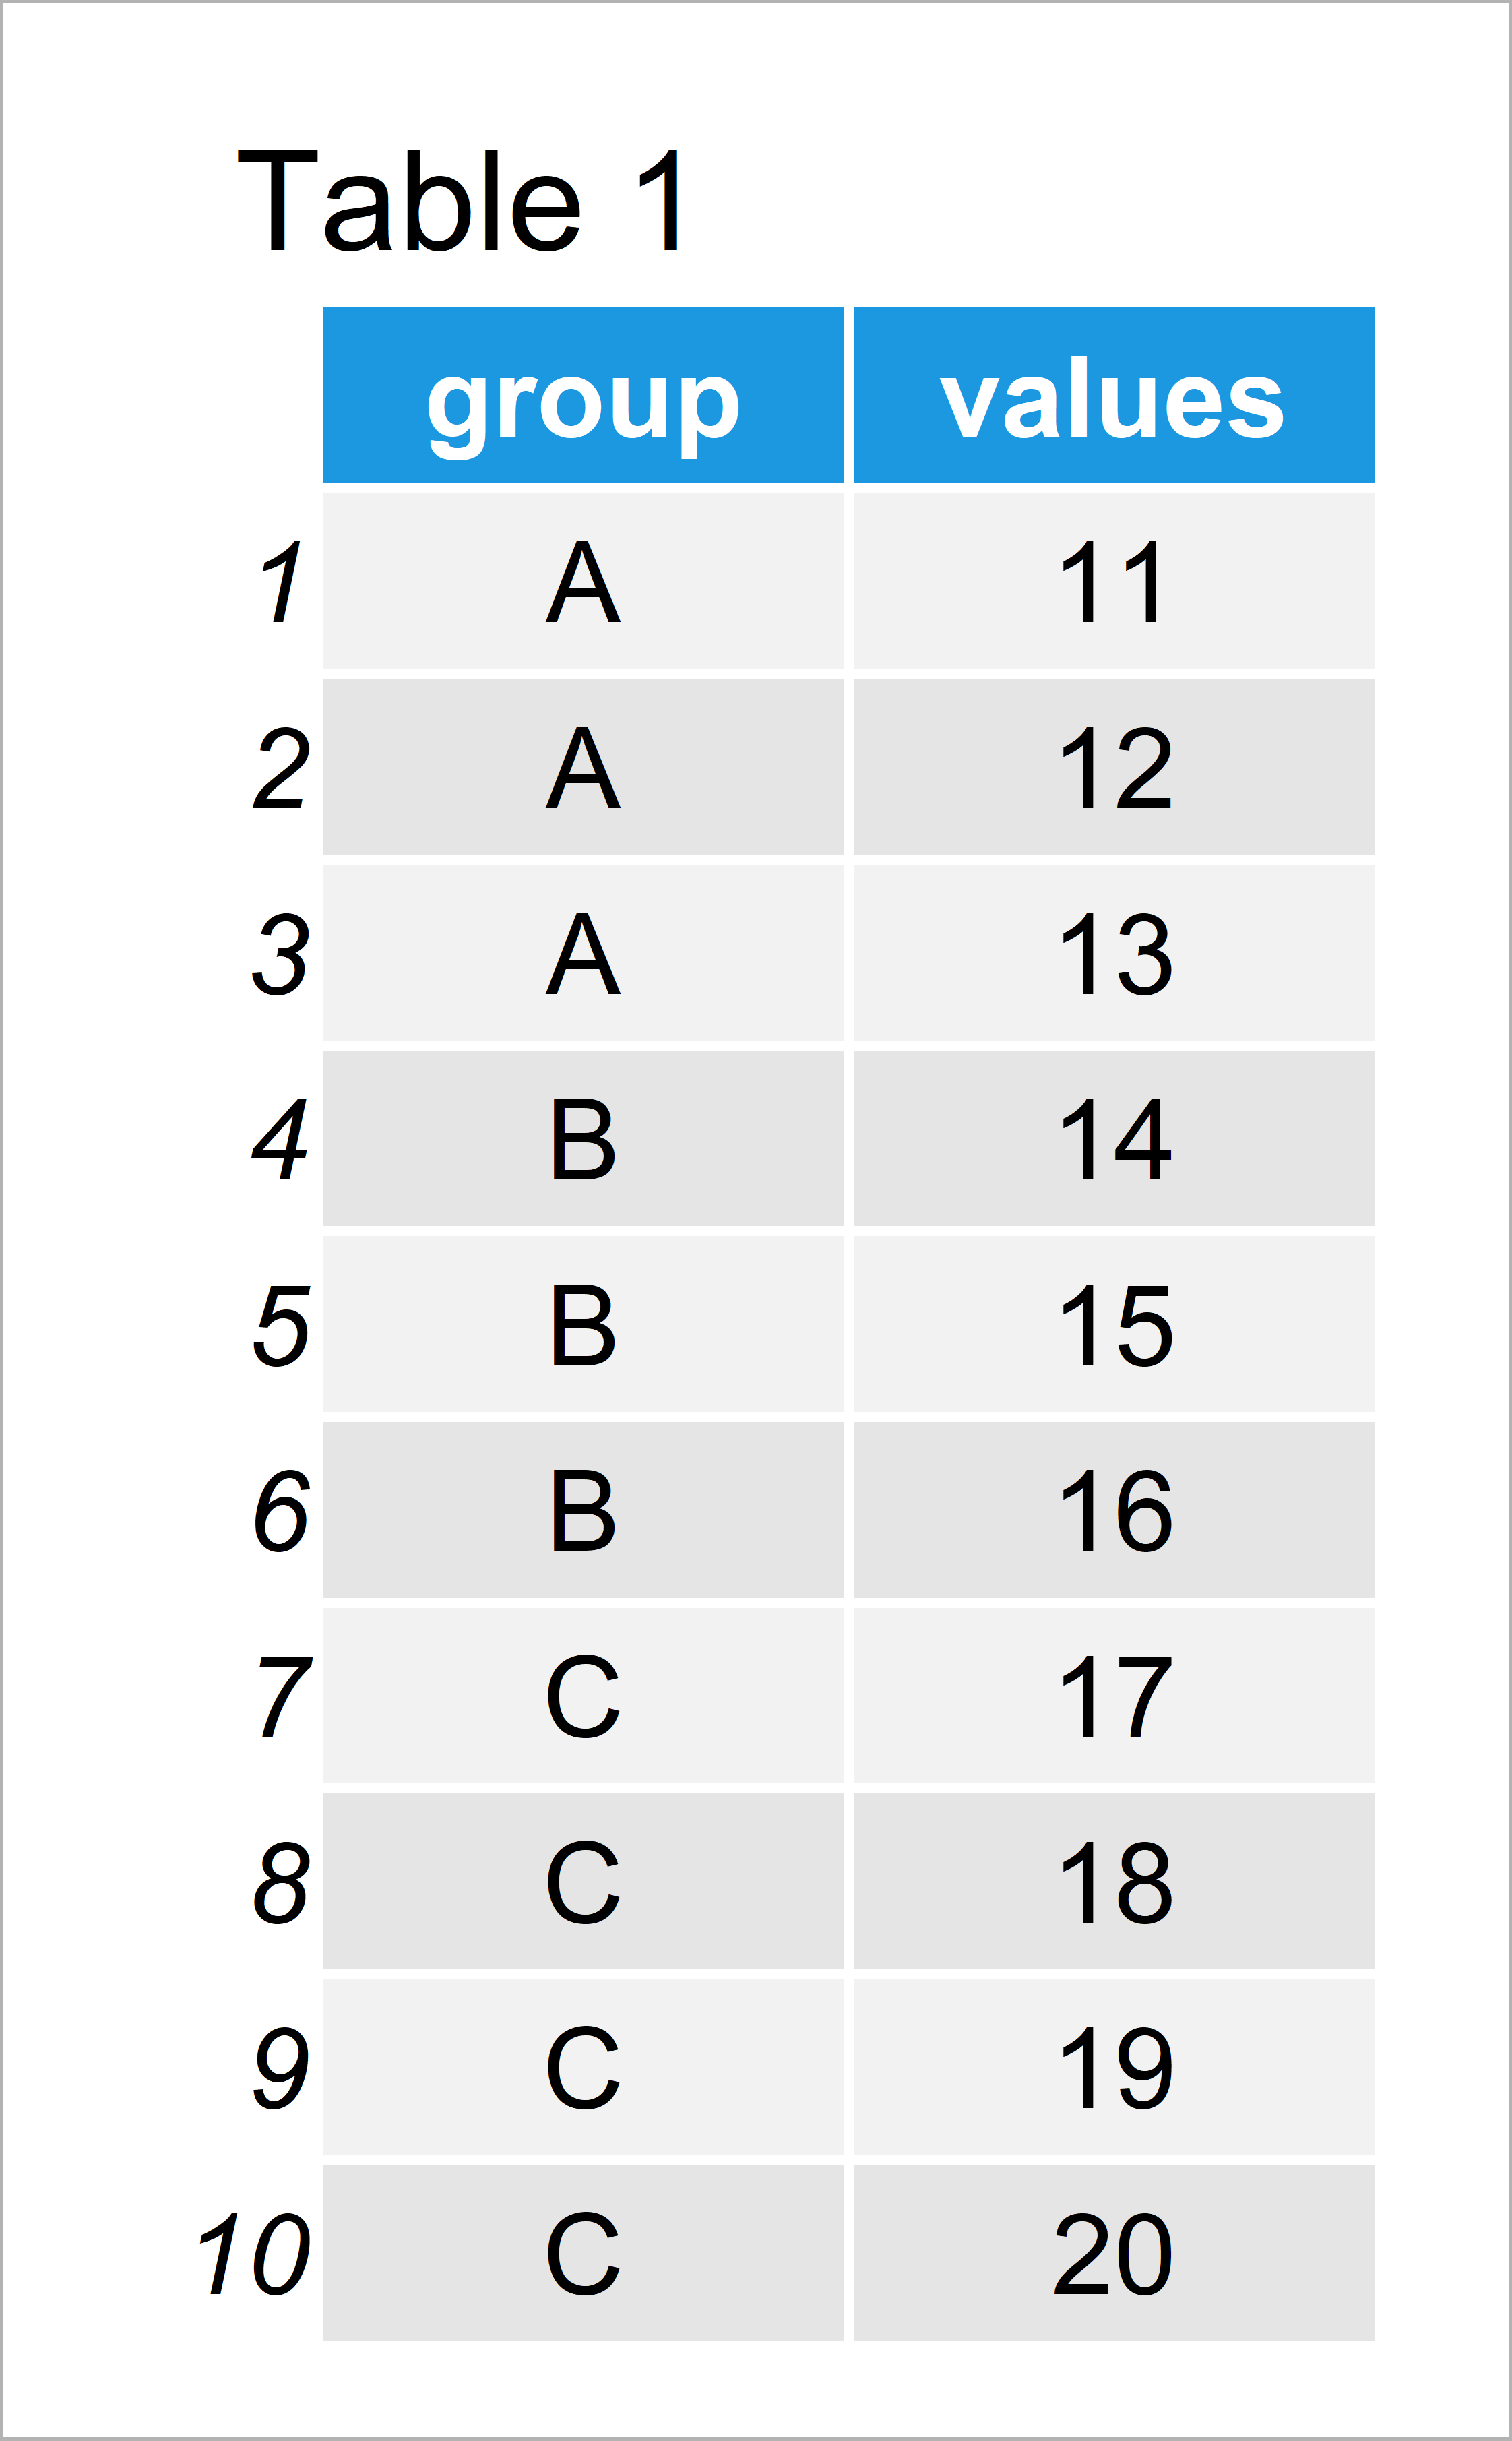
Have a look at the table that has been returned after running the previous R syntax. It shows that our exemplifying data is composed of ten rows and two columns.
The variable group defines the different groups of our data and the variable values contains corresponding values.
Example: Create Lagged Variable by Group Using dplyr Package
In this example, I’ll illustrate how to use the functions of the dplyr package to add a new column with lagged values for each group to our data frame.
First, we need to install and load the dplyr package:
install.packages("dplyr")                         # Install dplyr package
library("dplyr")                                  # Load dplyr
Next, we can use the group_by, mutate, and lag functions of the dplyr package to create a new data frame containing a lagged variable by group:
data_dplyr <- data %>%                            # Add lagged column
  group_by(group) %>%
  dplyr::mutate(lag1 = dplyr::lag(values, n = 1, default = NA)) %>%
  as.data.frame()
data_dplyr                                        # Print updated data

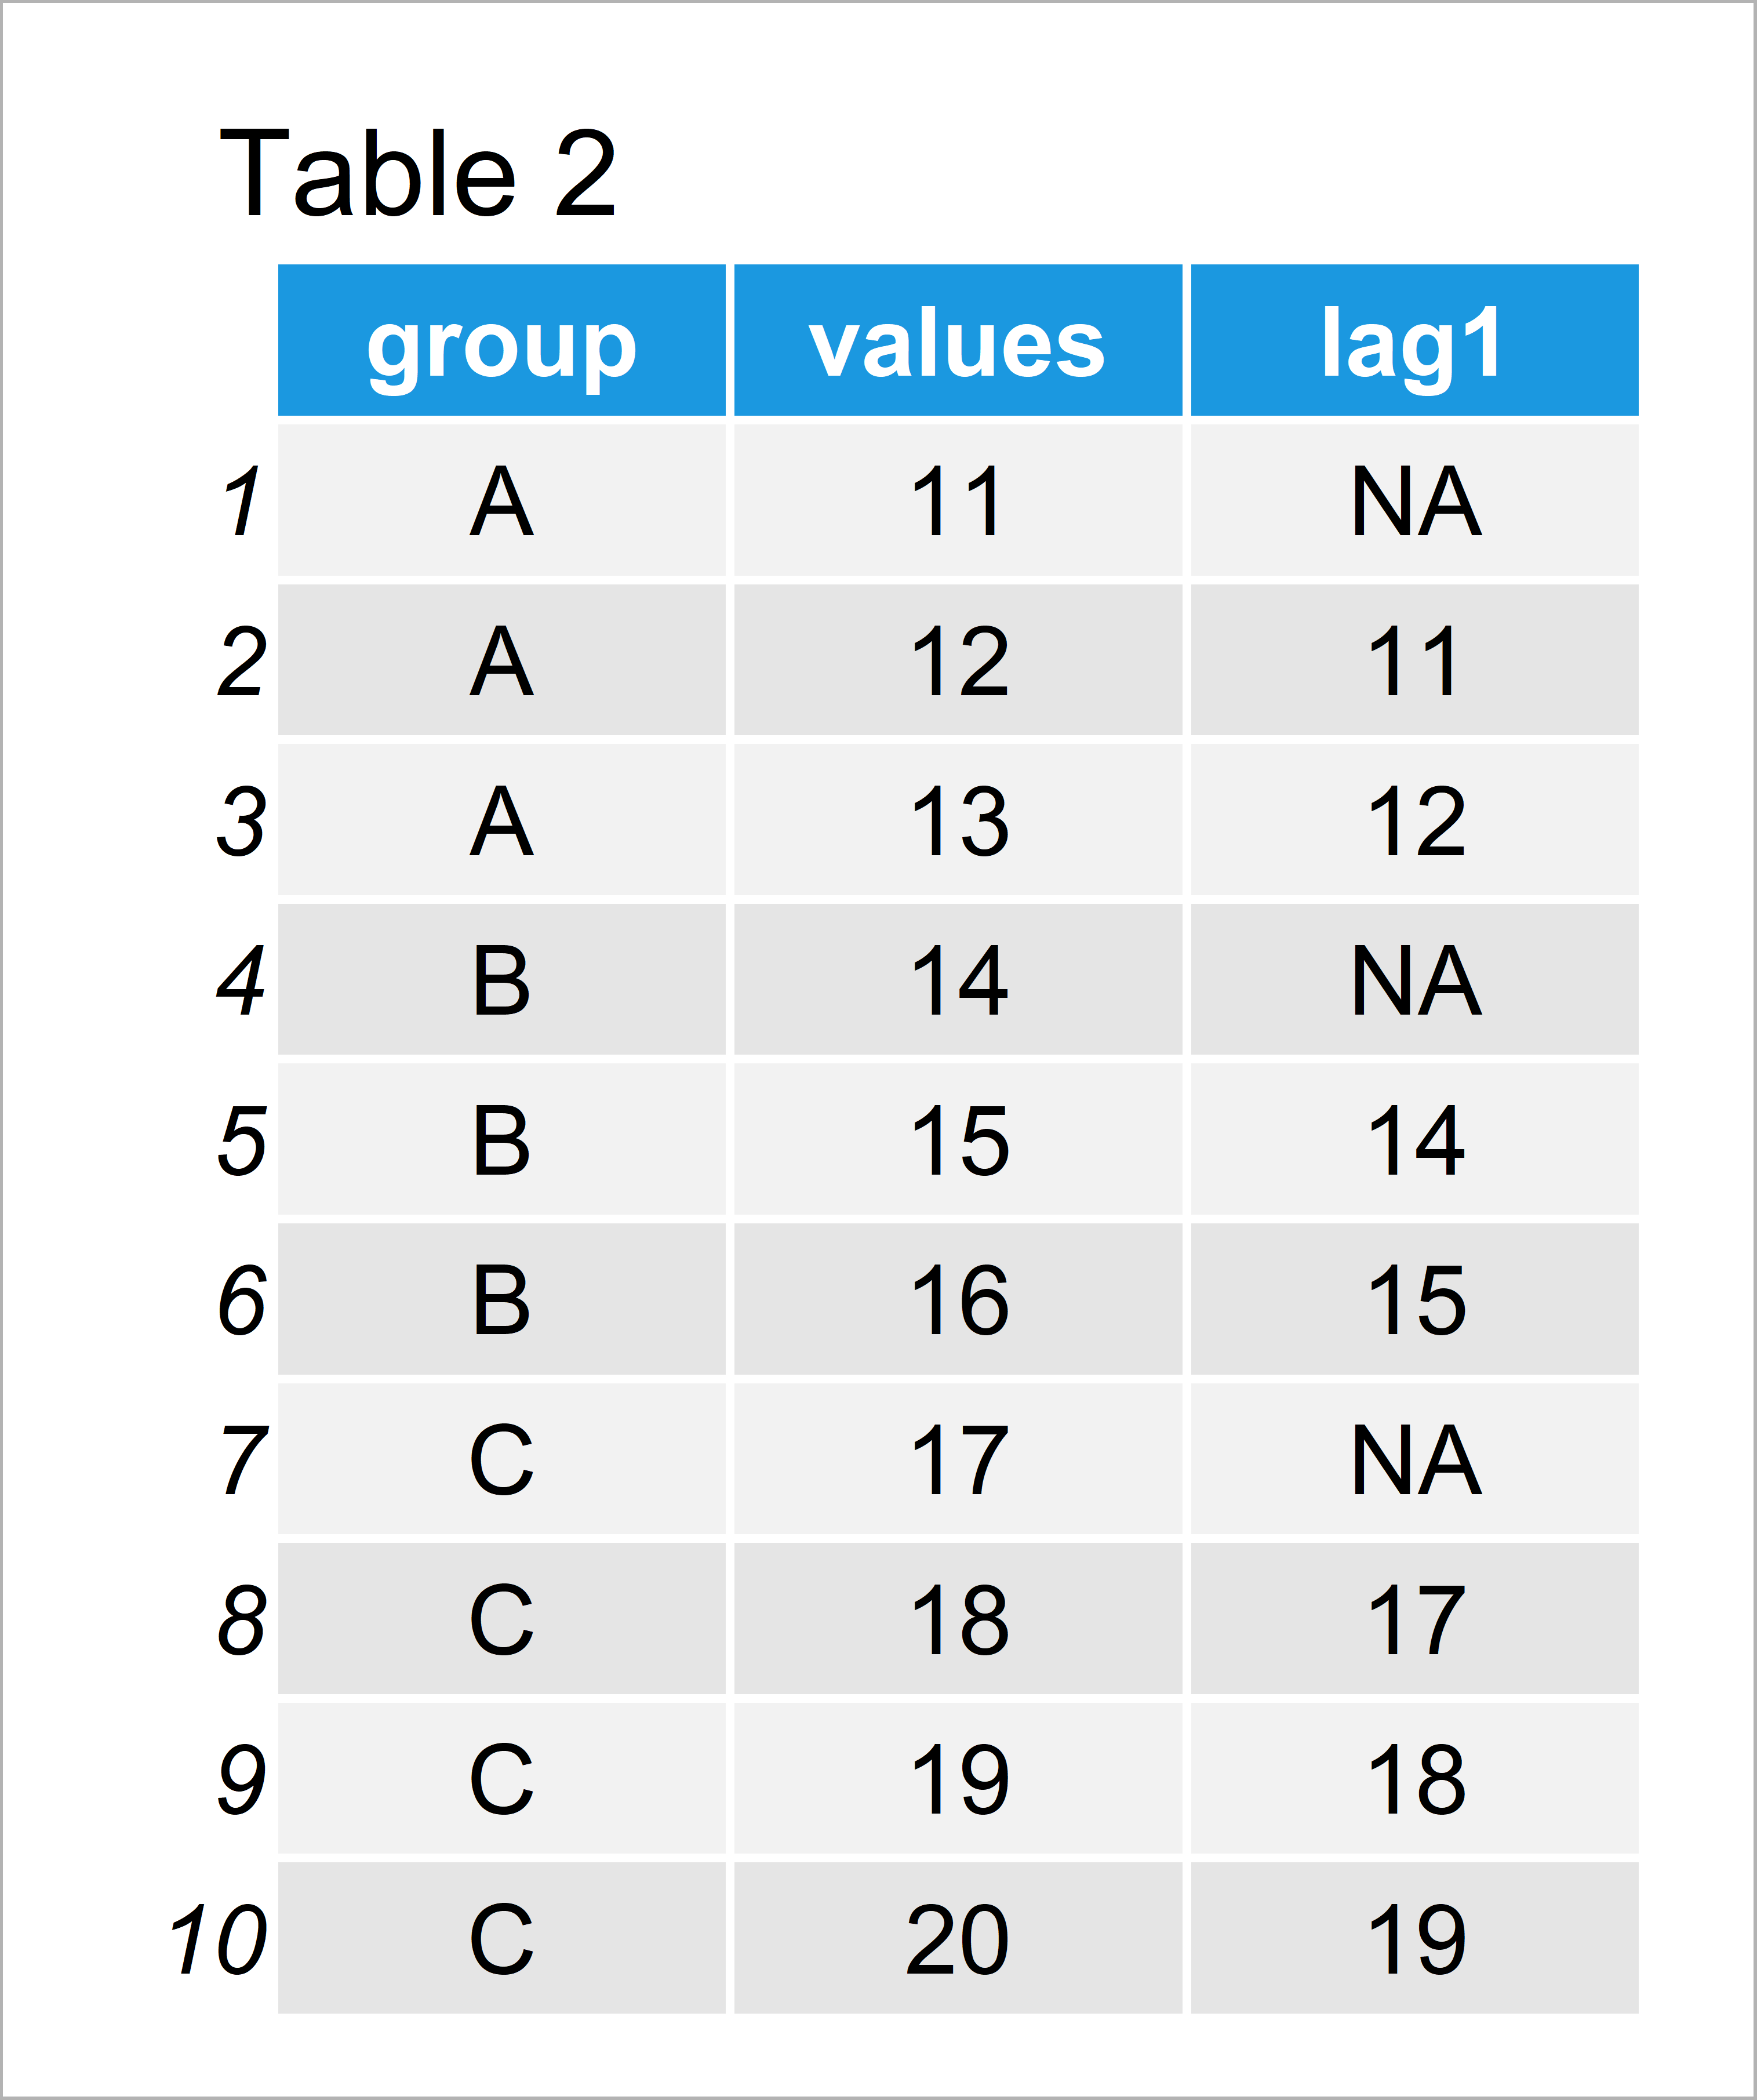
In Table 2 it is shown that we have created a new data frame with a new variable called lag1.
Please note that we have specified the name of the dplyr package in front of the mutate and lag functions, because functions with the same name are also contained in other R add-on packages.
Also note that we have converted the output of the dplyr functions to the data.frame class by using the as.data.frame function. You may remove this line of code in case you prefer to return a tibble instead of a data frame.
Video & Further Resources
I have recently released a video on my YouTube channel, which shows the R programming codes of this article. You can find the video below.
Besides that, you might have a look at the related tutorials of this website.
- lead & lag R Functions of dplyr Package
- Use Previous Row of data.table in R
- Convert Data Frame with Date Column to Time Series Object
- R Programming Examples
You have learned in this tutorial how to create a lagged version of a variable by group in the R programming language. This is a very common task when dealing with time series data. In case you have additional questions, let me know in the comments section.


6 Comments. Leave new
Thanks so much for the tutorial, it’s been really useful!
From here, how would I then go about calculating the first instance of change between the “Values” and “lag1” columns per group?
Hey Tom,
Thanks for the kind words, glad it was helpful!
Could you specify what you mean with “first instance of change”?
Regards,
Joachim
Thanks so much for the helpful tutorial!
How can I create several lagged variables in the same data?
Hey Hadar,
Thank you for the kind comment, glad you found the tutorial helpful!
You may add another line of code for each additional lagged variable. For example:
Regards,
Joachim
Thanks so much for the video. Do you know how can I then calculate lagged regression with this lagged variables?
Hello Carmen,
First of all, sorry for the late response. If you haven’t found an answer yet, could you please be more specific about what you mean by “lagged regression”?
Regards,
Cansu