Count Non-NA Values in R (2 Examples)
In this article you’ll learn how to get the number of non-NA values in R programming.
The tutorial will contain this information:
Let’s get started.
Example 1: Count Non-NA Values in Vector Object
In Example 1, I’ll demonstrate how to find the number of non-missing values in a vector object.
For this example, we first have to create an exemplifying vector:
vec <- c(1, NA, 2, NA, NA, 1, 2, 1, NA)            # Create example vector
vec                                                # Print example vector
# [1]  1 NA  2 NA NA  1  2  1 NA
Next, we can apply the sum and is.na functions to this vector to get the number of non-NA values:
sum(!is.na(vec))                                   # Get number of non-NA values
# [1] 5
As you can see based on the previous output of the RStudio console, our vector object contains five non-NA values.
Example 2: Count Non-NA Values in Columns & Rows of Data Frame
In this example, I’ll explain how to return the number of non-NA values in a data frame.
Let’s create some example data:
data <- data.frame(x1 = c(5, NA, 7, NA, NA, 3),    # Create example data frame
                   x2 = c("a", "b", NA, NA, "a", "c"))
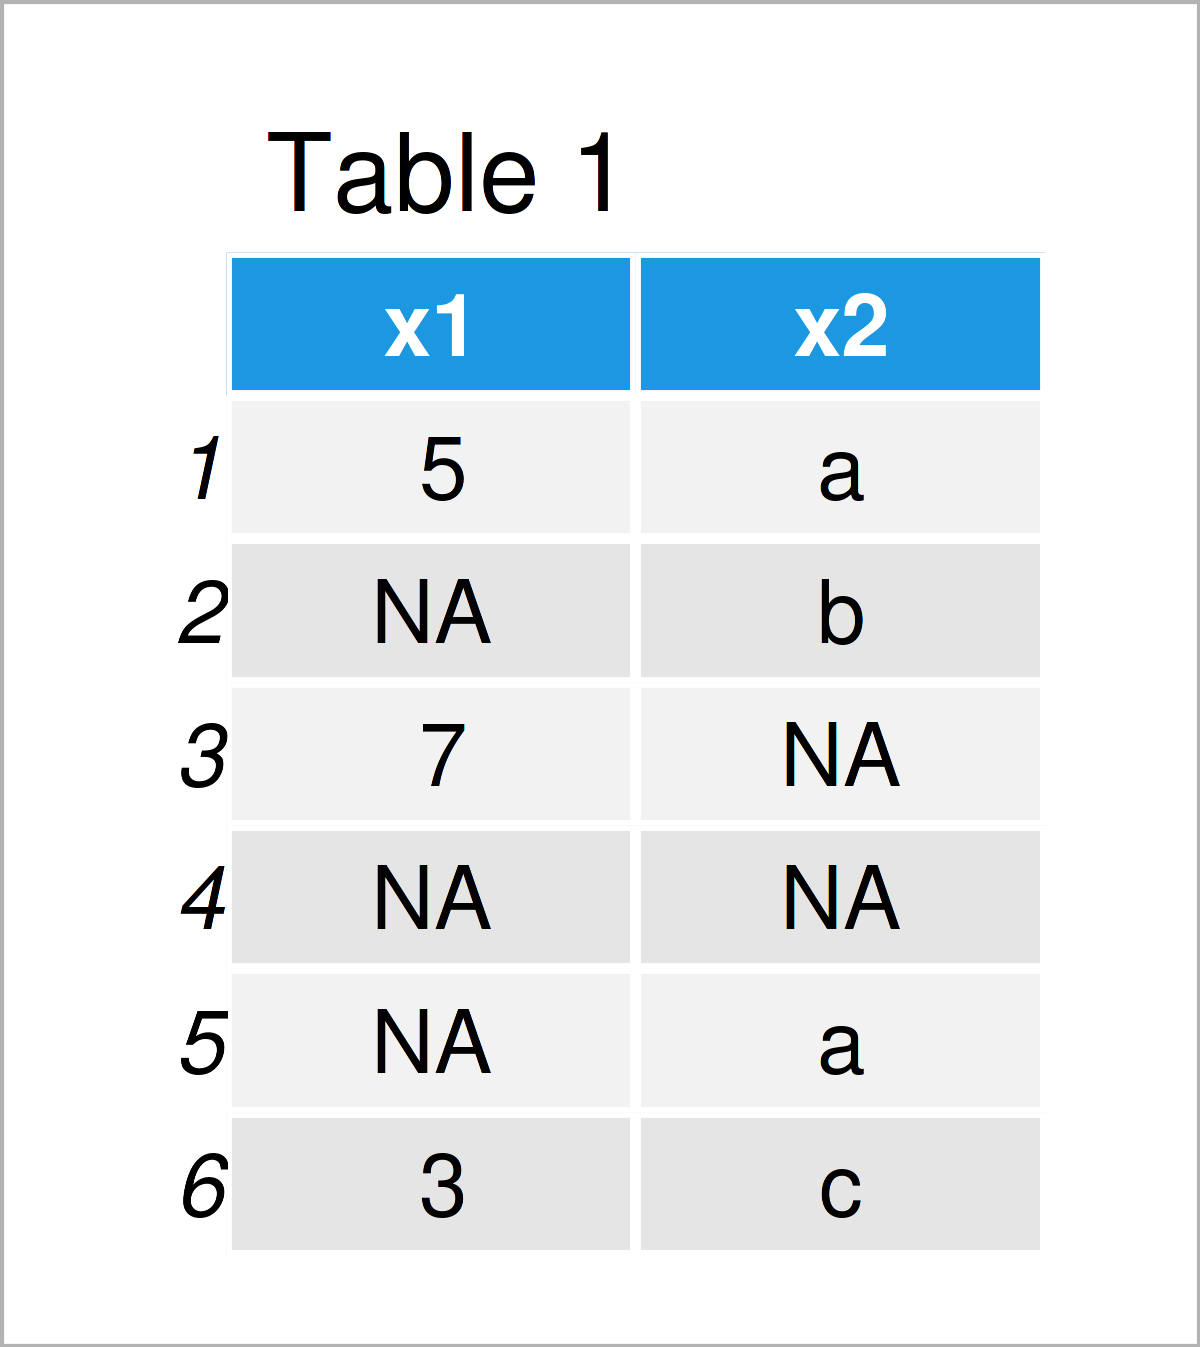
data                                               # Print example data frame

By executing the previous code, we have managed to construct Table 1, i.e. a data frame containing six rows and two columns. Both of the columns contain some NA values.
If we want to count the non-NA values in each column of this data frame, we can apply the colSums and is.na functions as shown below:
colSums(!is.na(data))                              # Get number of non-NA values in columns
# x1 x2
#  3  4
The column x1 contains three non-NA values, and the column x2 contains four non-NA values.
It is also possible to count the non-NA values by rows. For this, we have to exchange the colSums function by the rowSums function:
rowSums(!is.na(data))                              # Get number of non-NA values in rows
# [1] 2 1 1 0 1 2
The previously shown vector shows the number of non-NA values in each of the six rows in our data frame.
Video & Further Resources
Do you need more info on the topics of this article? Then I recommend having a look at the following video on my YouTube channel. In the video, I explain the contents of this article in the R programming language:
In addition, you might want to read some of the related articles on my homepage.
- Count NA Values by Group in R
- Count Unique Values in R
- Count Non-Zero Values in Vector & Data Frame Columns
- Count NA Values in R
- Count Number of Values in Range in R
- R Programming Examples
In this article you have learned how to count the number of non-NA values in the R programming language. If you have any additional questions, kindly let me know in the comments section.


