Change Line Type of Base R Plot (6 Examples)
This article illustrates how to modify the lines types in a plot in the R programming language.
The article contains the following contents:
It’s time to dive into the R syntax…
Introducing Example Data
Consider the following example data:
x <- 1:10                                  # Create example data
y <- c(3, 1, 7, 2, 3, 5, 5, 1, 8, 4)
The previous R code illustrates that our example data are two numeric vectors containing ten elements each.
As a next step, we can draw a plot of our data:
plot(x, y, type = "l") # Draw default line plot
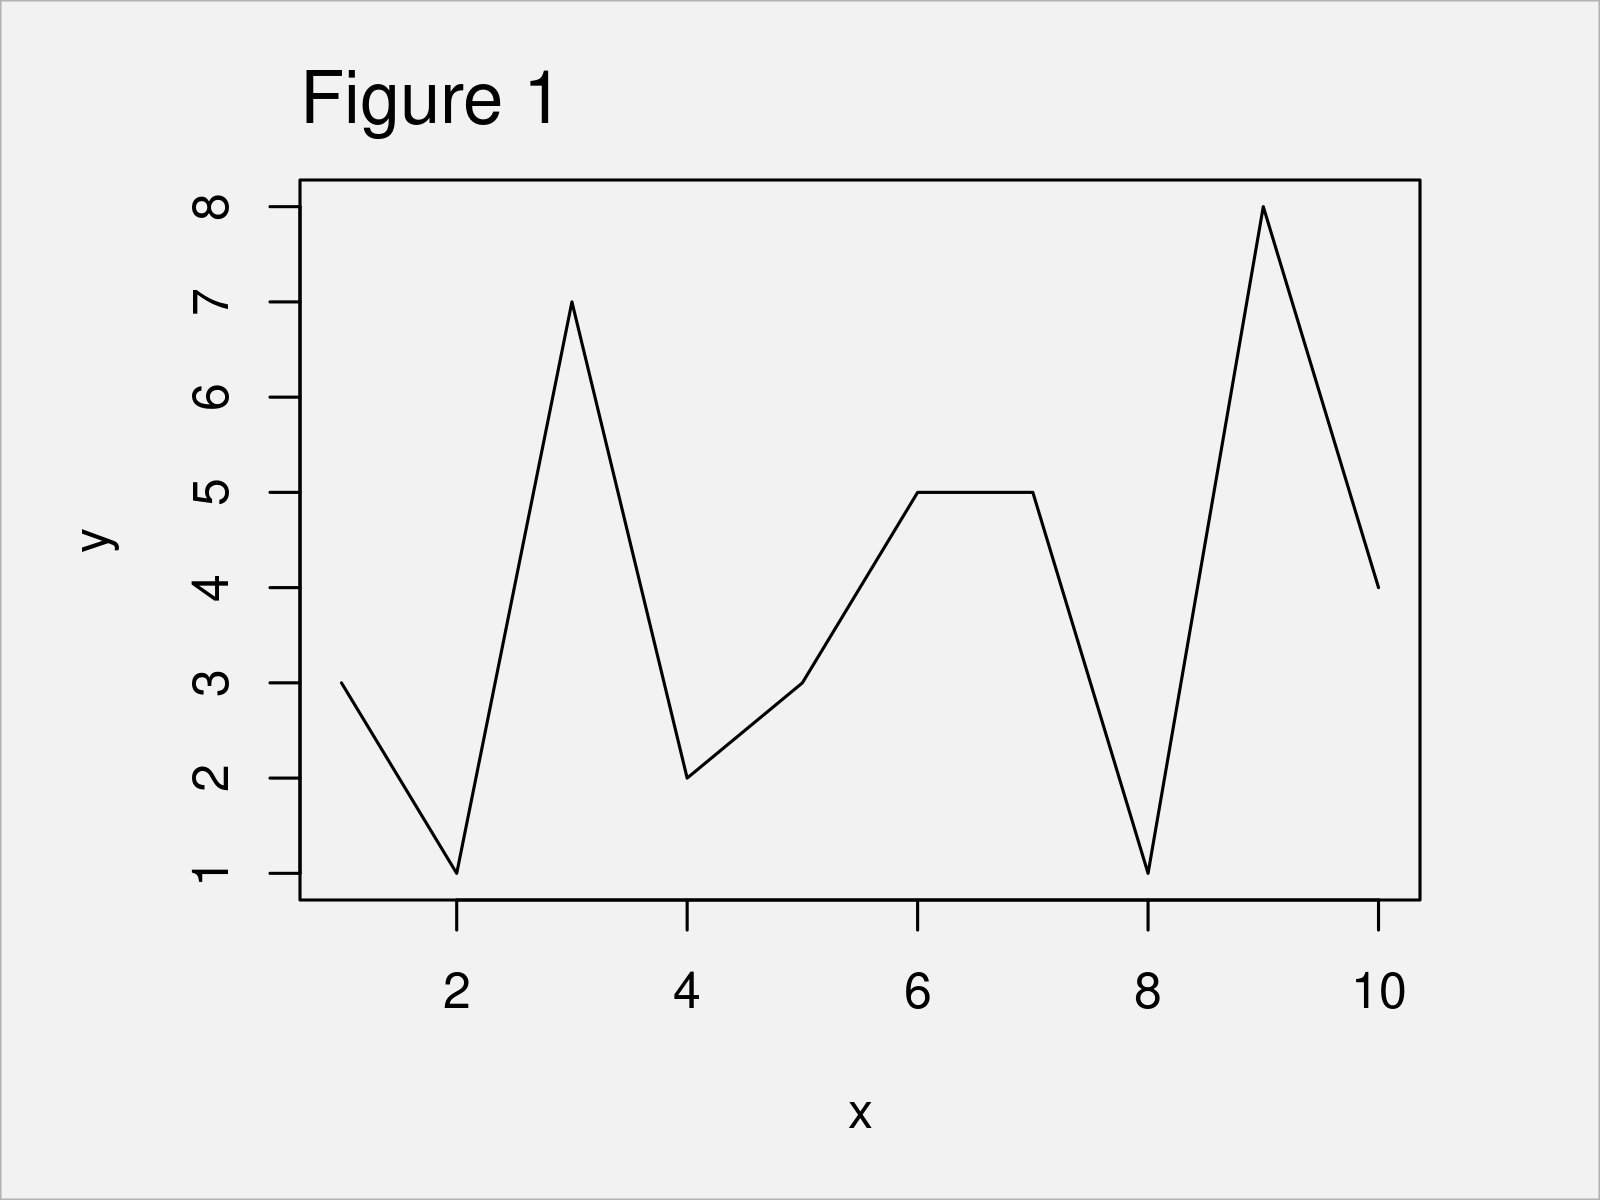
As shown in Figure 1, the previous code has created a line plot with default line type (i.e. a solid line with the color black).
In the following examples, I’ll explain how to change the shape of this line using the lty argument of the plot function.
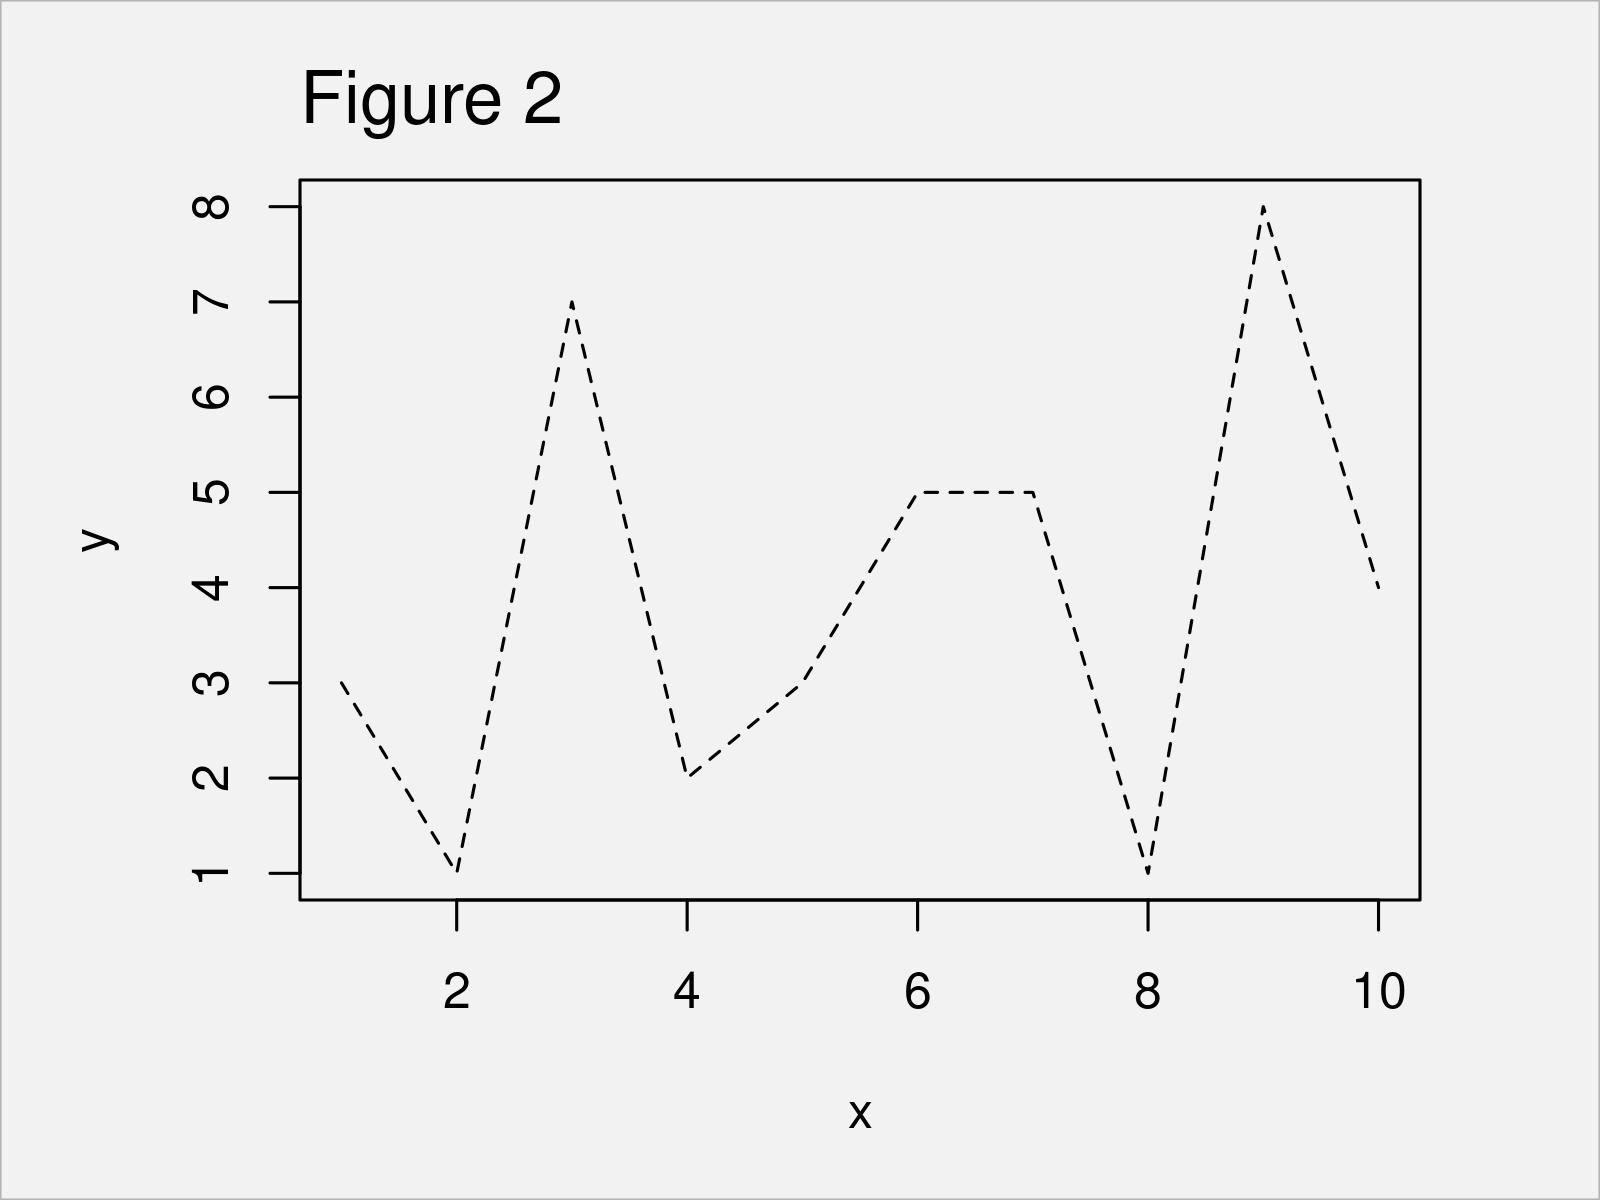
Example 1: Draw Plot with Dashed Line
plot(x, y, type = "l",                     # Dashed line
     lty = "dashed")
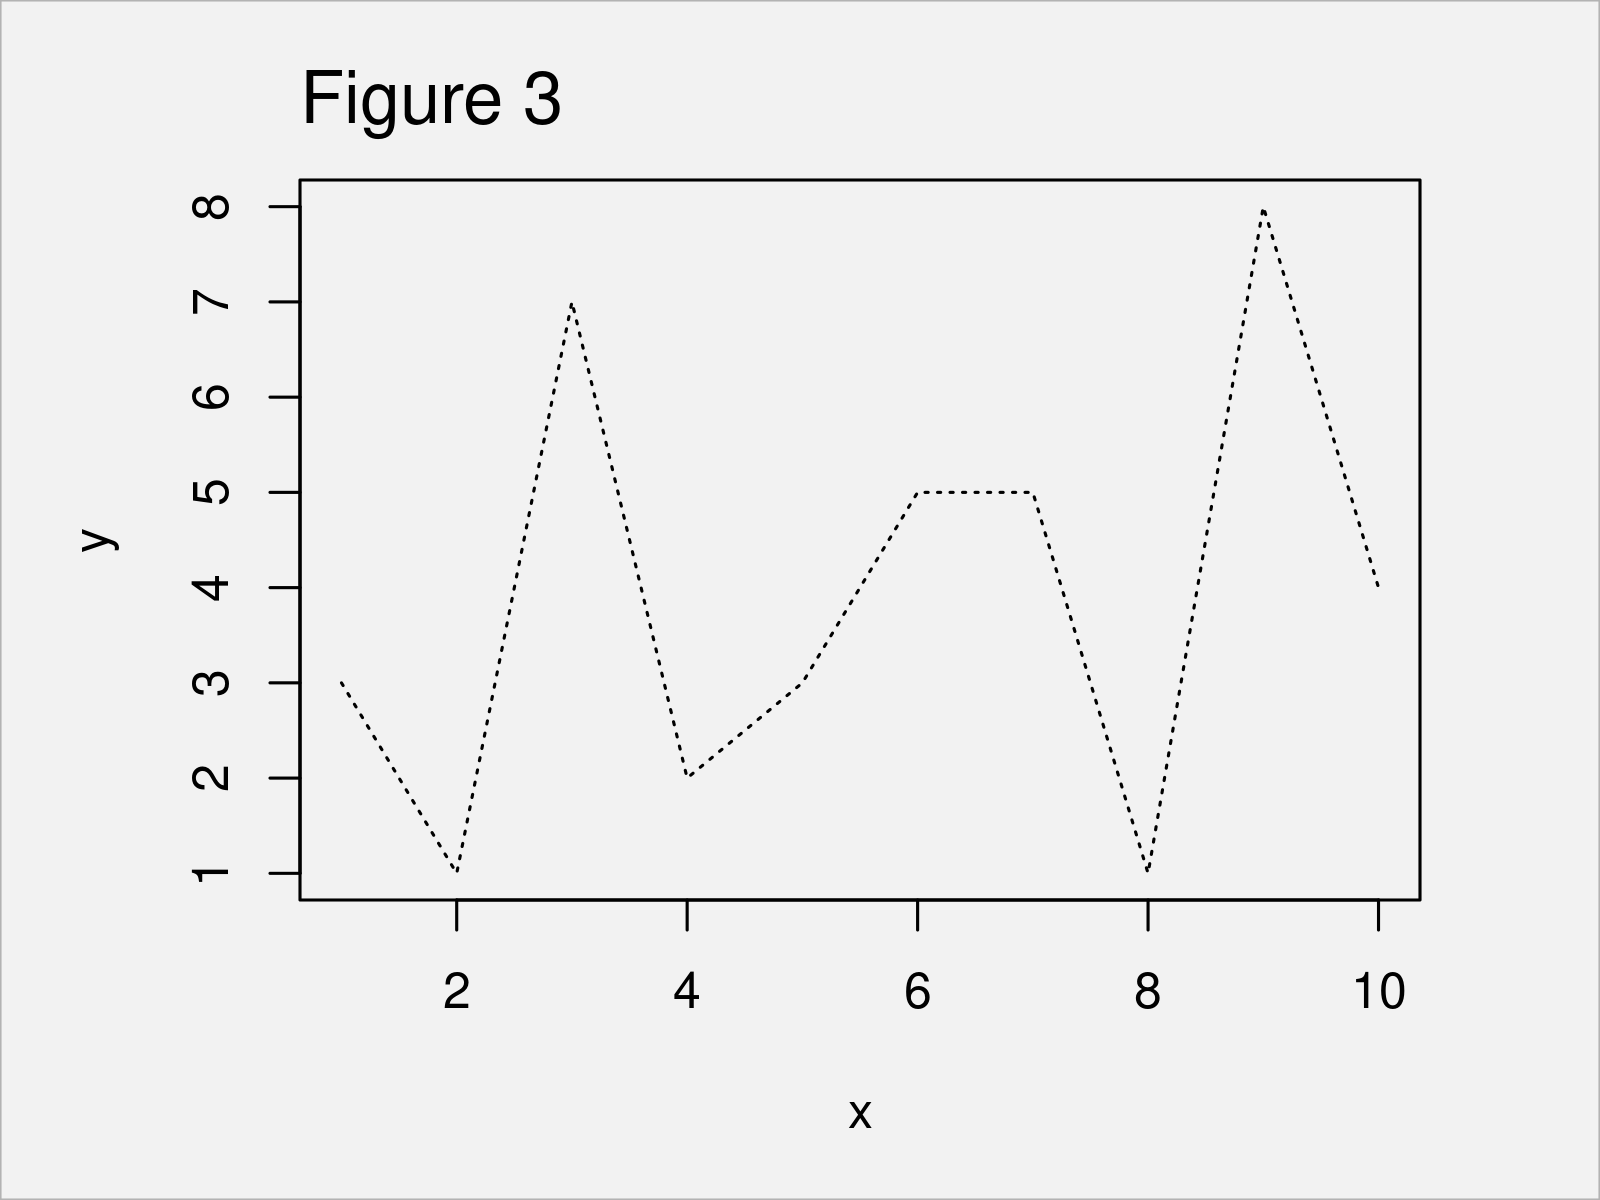
Example 2: Draw Plot with Dotted Line
plot(x, y, type = "l",                     # Dotted line
     lty = "dotted")
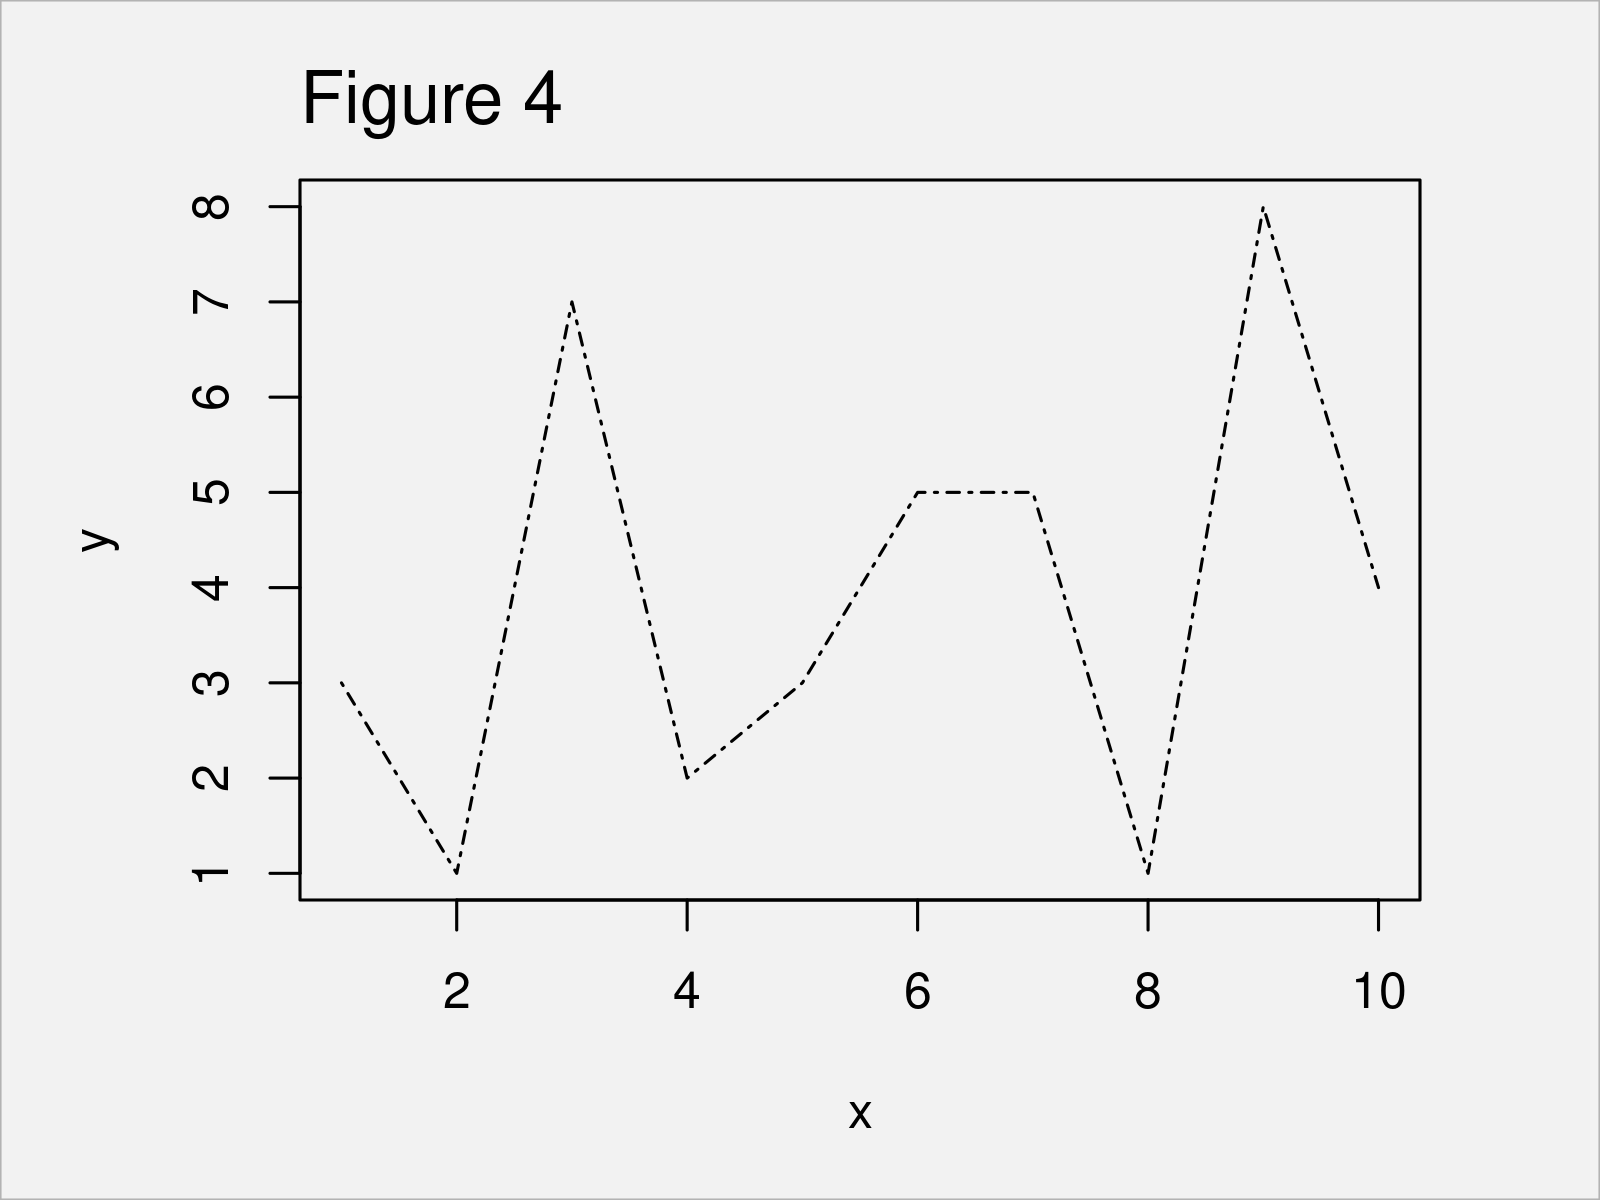
Example 3: Draw Plot with Dotdash Line
plot(x, y, type = "l",                     # Dotdash line
     lty = "dotdash")
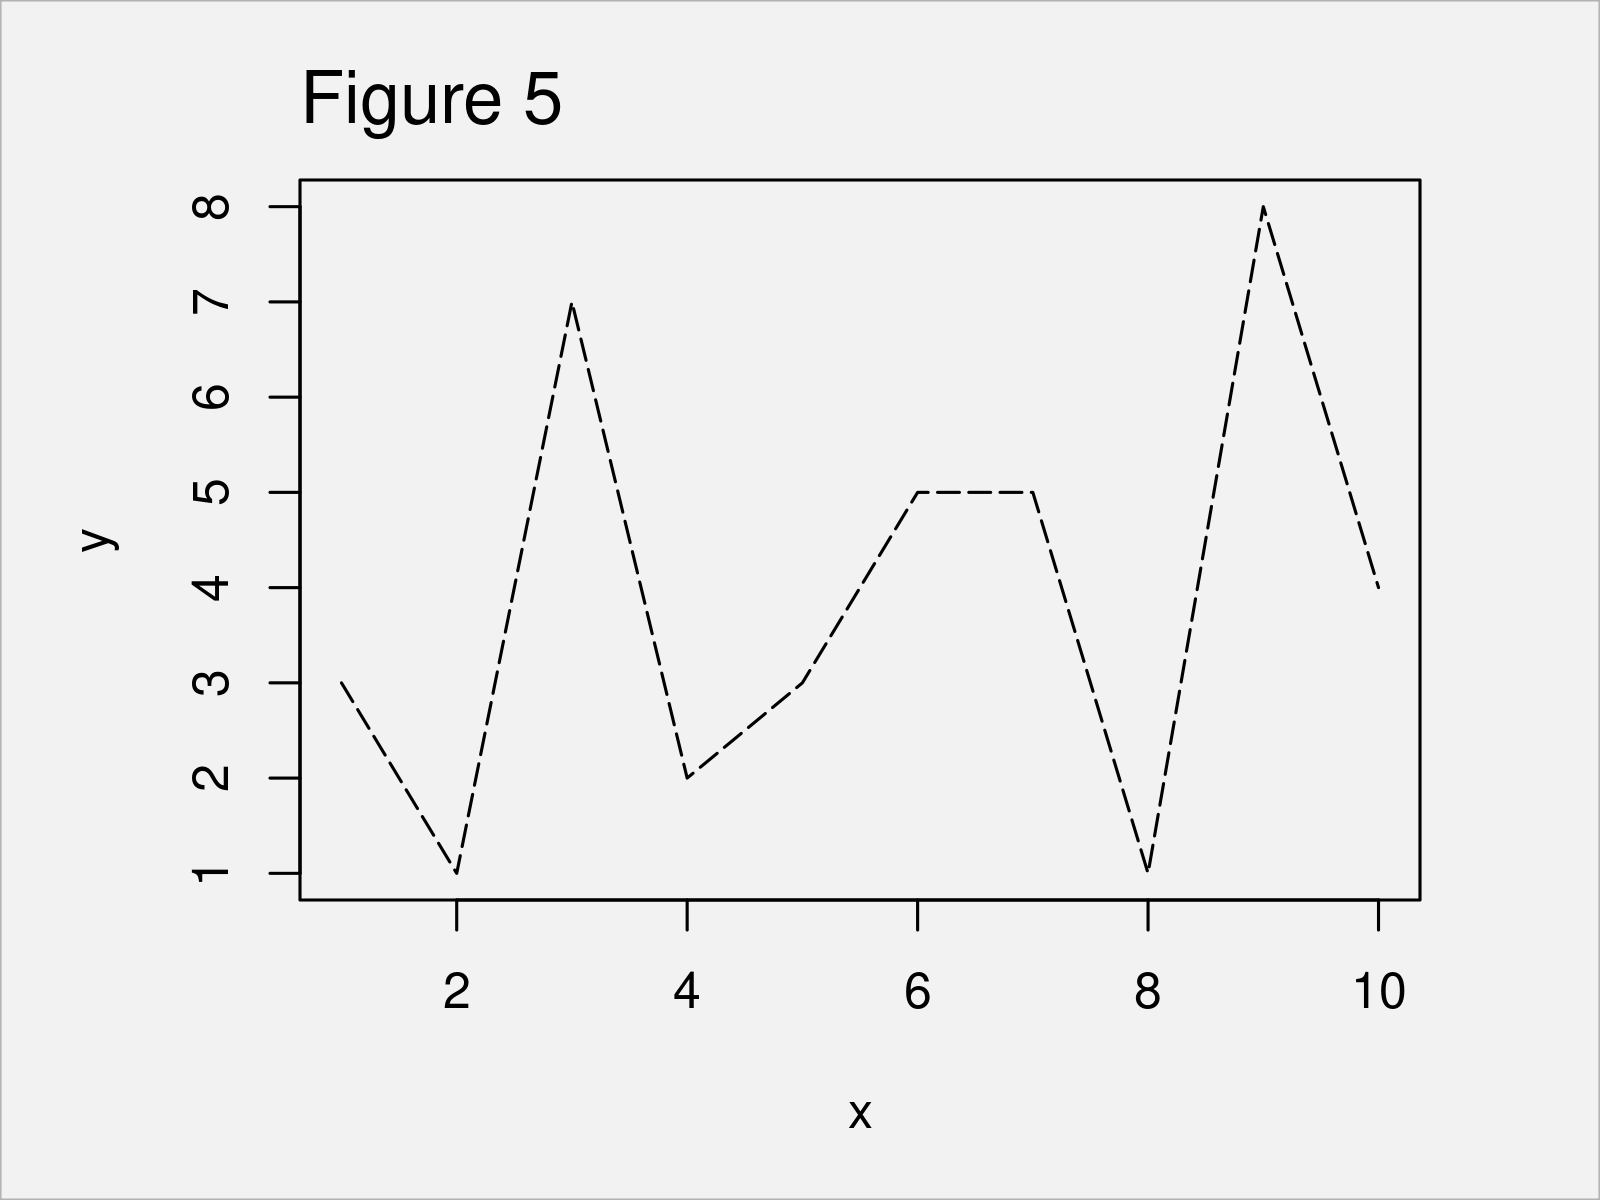
Example 4: Draw Plot with Longdash Line
plot(x, y, type = "l",                     # Longdash line
     lty = "longdash")
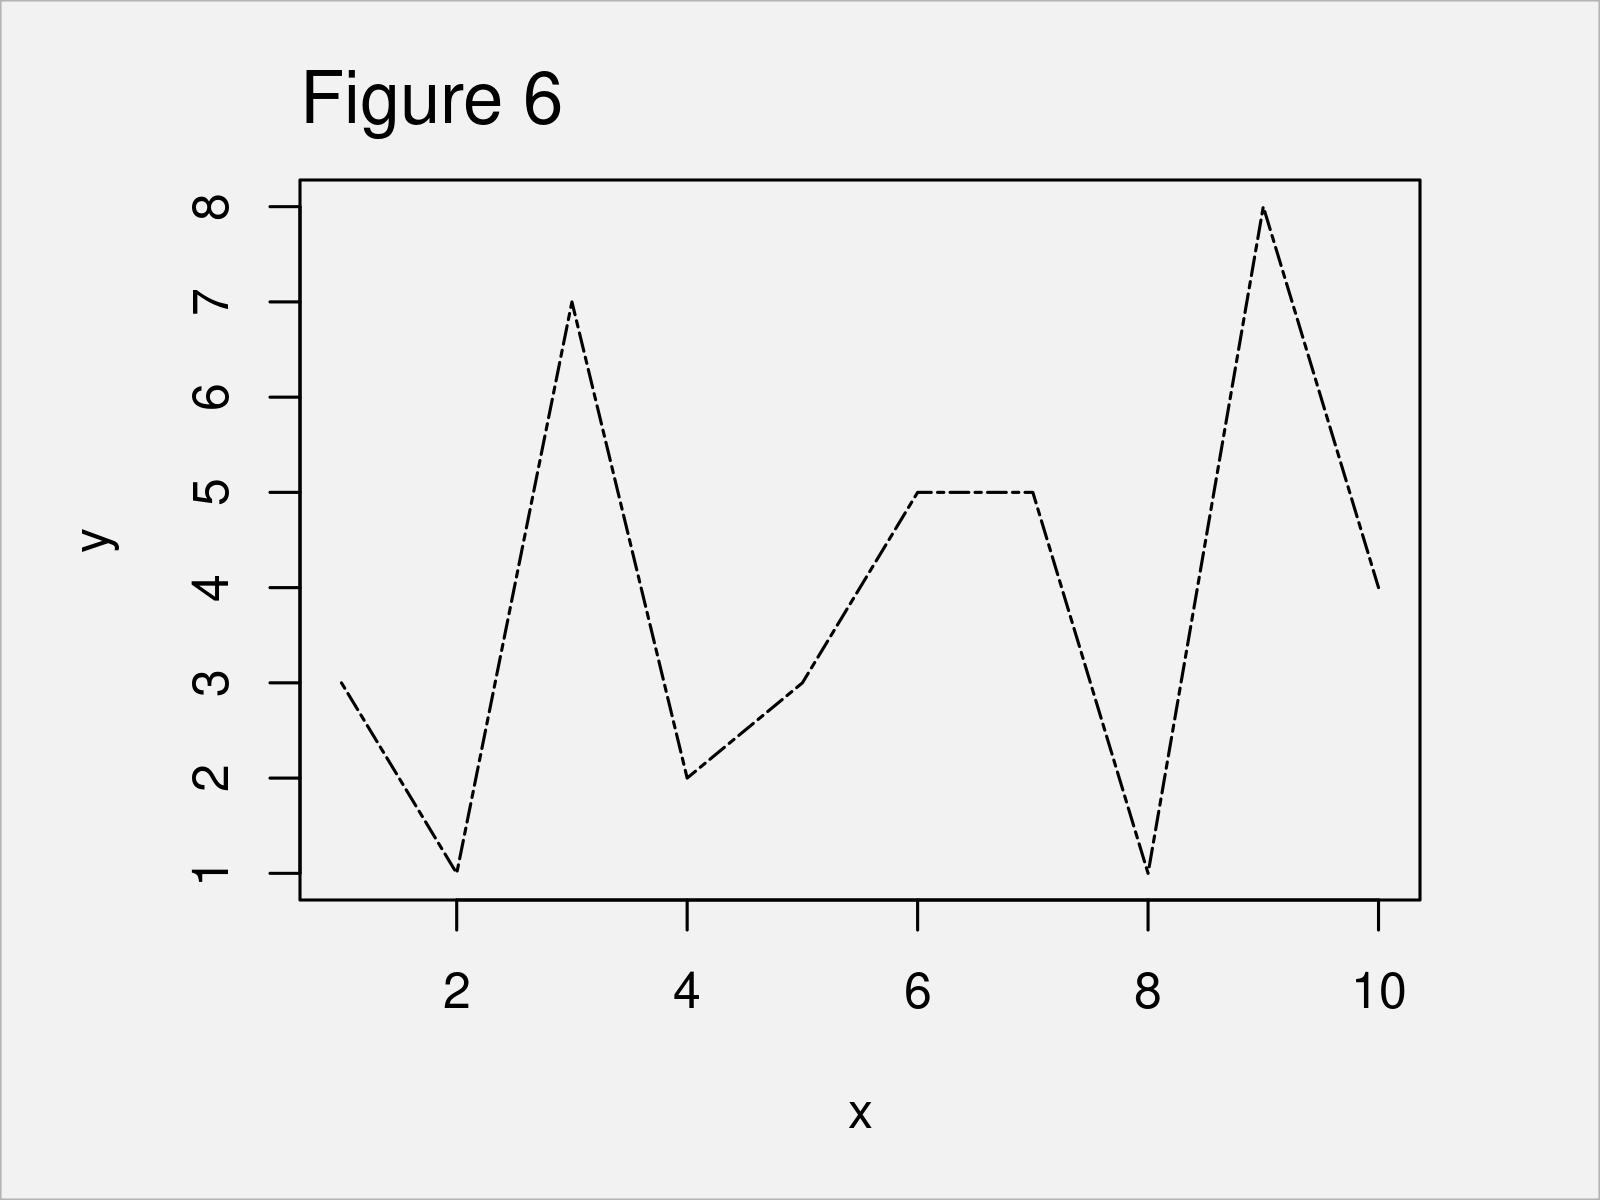
Example 5: Draw Plot with Twodash Line
plot(x, y, type = "l",                     # Twodash line
     lty = "twodash")
Example 6: Draw Plot with Multiple Line Types
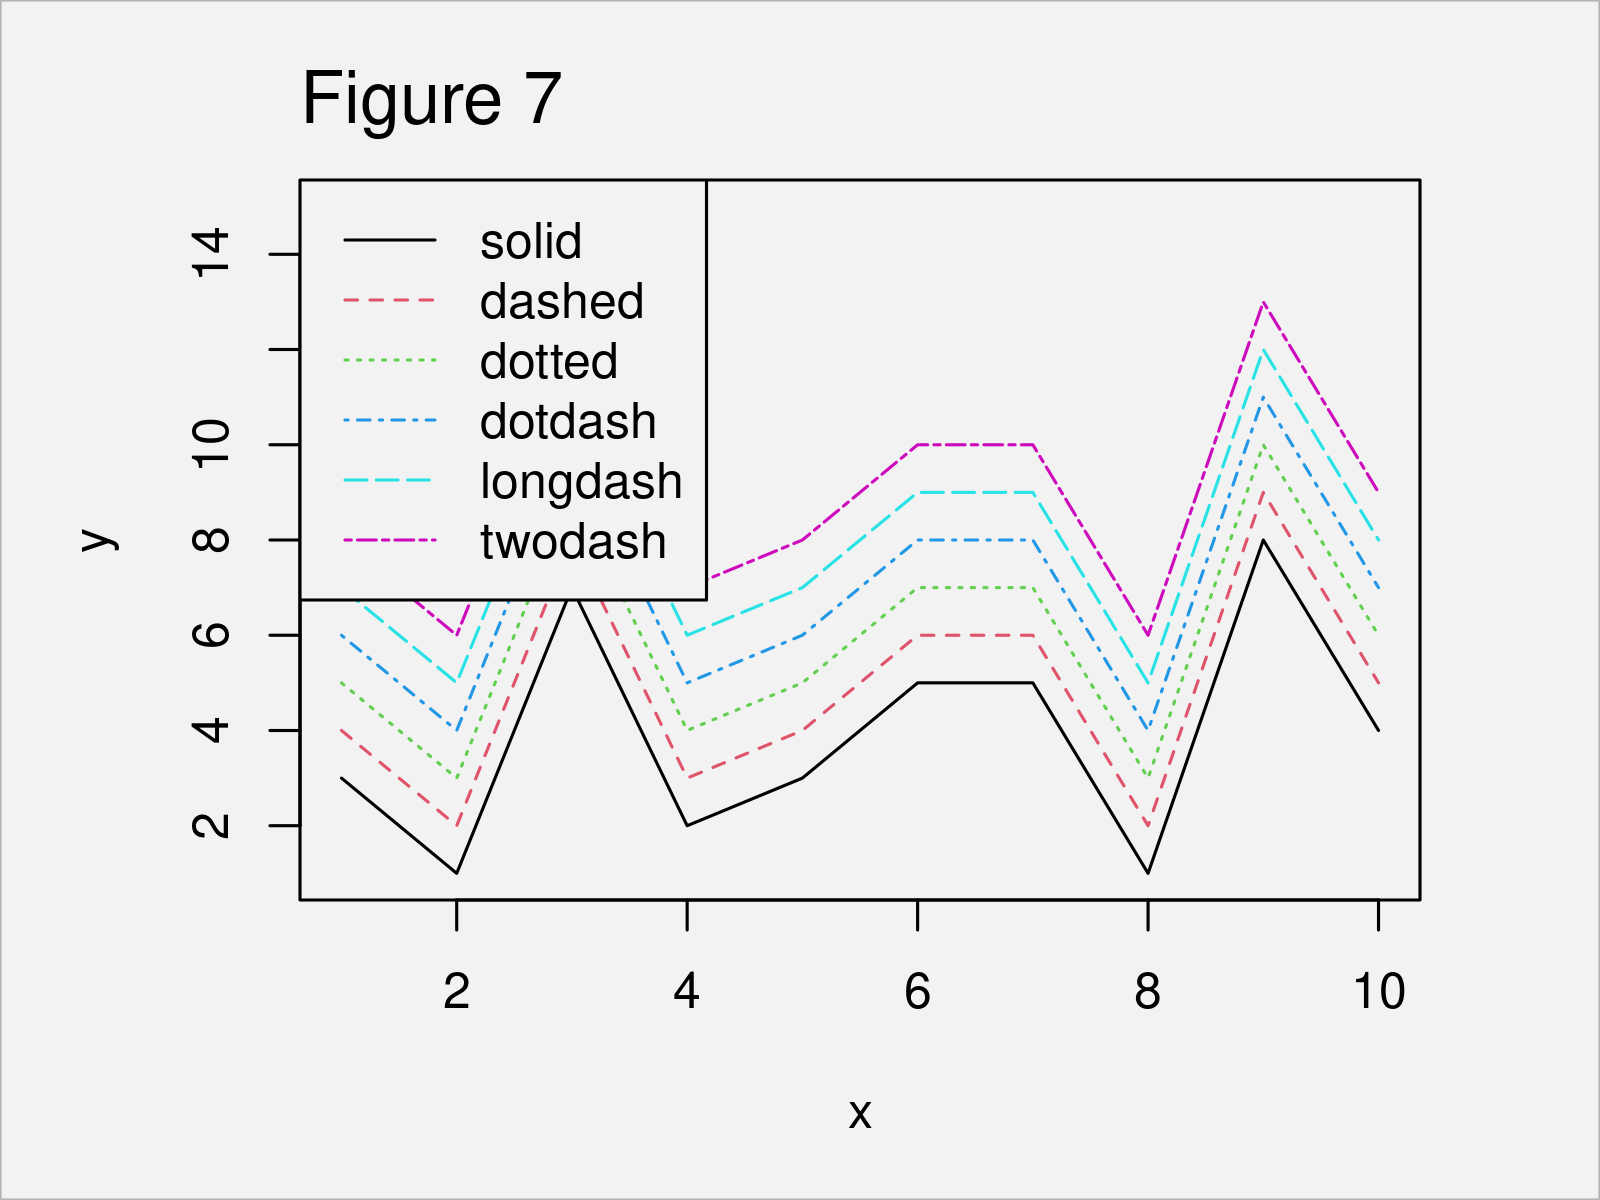
The following syntax demonstrates how to draw all previously shown line types in a single plot.
For this task, we can use the plot and lines functions as shown below. The following syntax is also adding a legend to our graphic, which identifies the different commands for each of the lines.
plot(x, y, type = "l", ylim = c(1, 15))    # Draw all line types in one plot
lines(x, y + 1, type = "l", lty = 2, col = 2)
lines(x, y + 2, type = "l", lty = 3, col = 3)
lines(x, y + 3, type = "l", lty = 4, col = 4)
lines(x, y + 4, type = "l", lty = 5, col = 5)
lines(x, y + 5, type = "l", lty = 6, col = 6)
legend("topleft",
       c("solid", "dashed", "dotted", "dotdash", "longdash", "twodash"),
       col = 1:6,
       lty = 1:6)
Video, Further Resources & Summary
In case you need more information on the R syntax of this article, I recommend having a look at the following video on my YouTube channel. I’m explaining the content of this article in the video:
Furthermore, you could have a look at the related articles on this homepage.
- Control Line Color & Type in ggplot2 Plot Legend
- Change Color, Shape & Size of One Data Point in Plot (Base R & ggplot2)
- Change Colors in ggplot2 Line Plot in R
- Change Line Width in ggplot2 Plot
- Change Spacing of Axis Tick Marks in Base R Plot
- Plots in R
- All R Programming Tutorials
In this R tutorial you have learned how to change the lines types in a graphic. Let me know in the comments section, in case you have any further questions.


