Change Background Color of ggplot2 Text Label Annotation in R (Example)
In this post, I’ll explain how to add background color to a text label in a ggplot2 plot in the R programming language.
The tutorial will contain one example for the creation of plots with text labels. To be more specific, the tutorial is structured as follows:
Let’s start right away.
Example Data, Packages & Default Plot
We’ll use the following data as basement for this tutorial:
data <- data.frame(x = c(5, 1, 3, 7, 3),    # Create example data
                   y = 1:5)
data                                        # Print example data

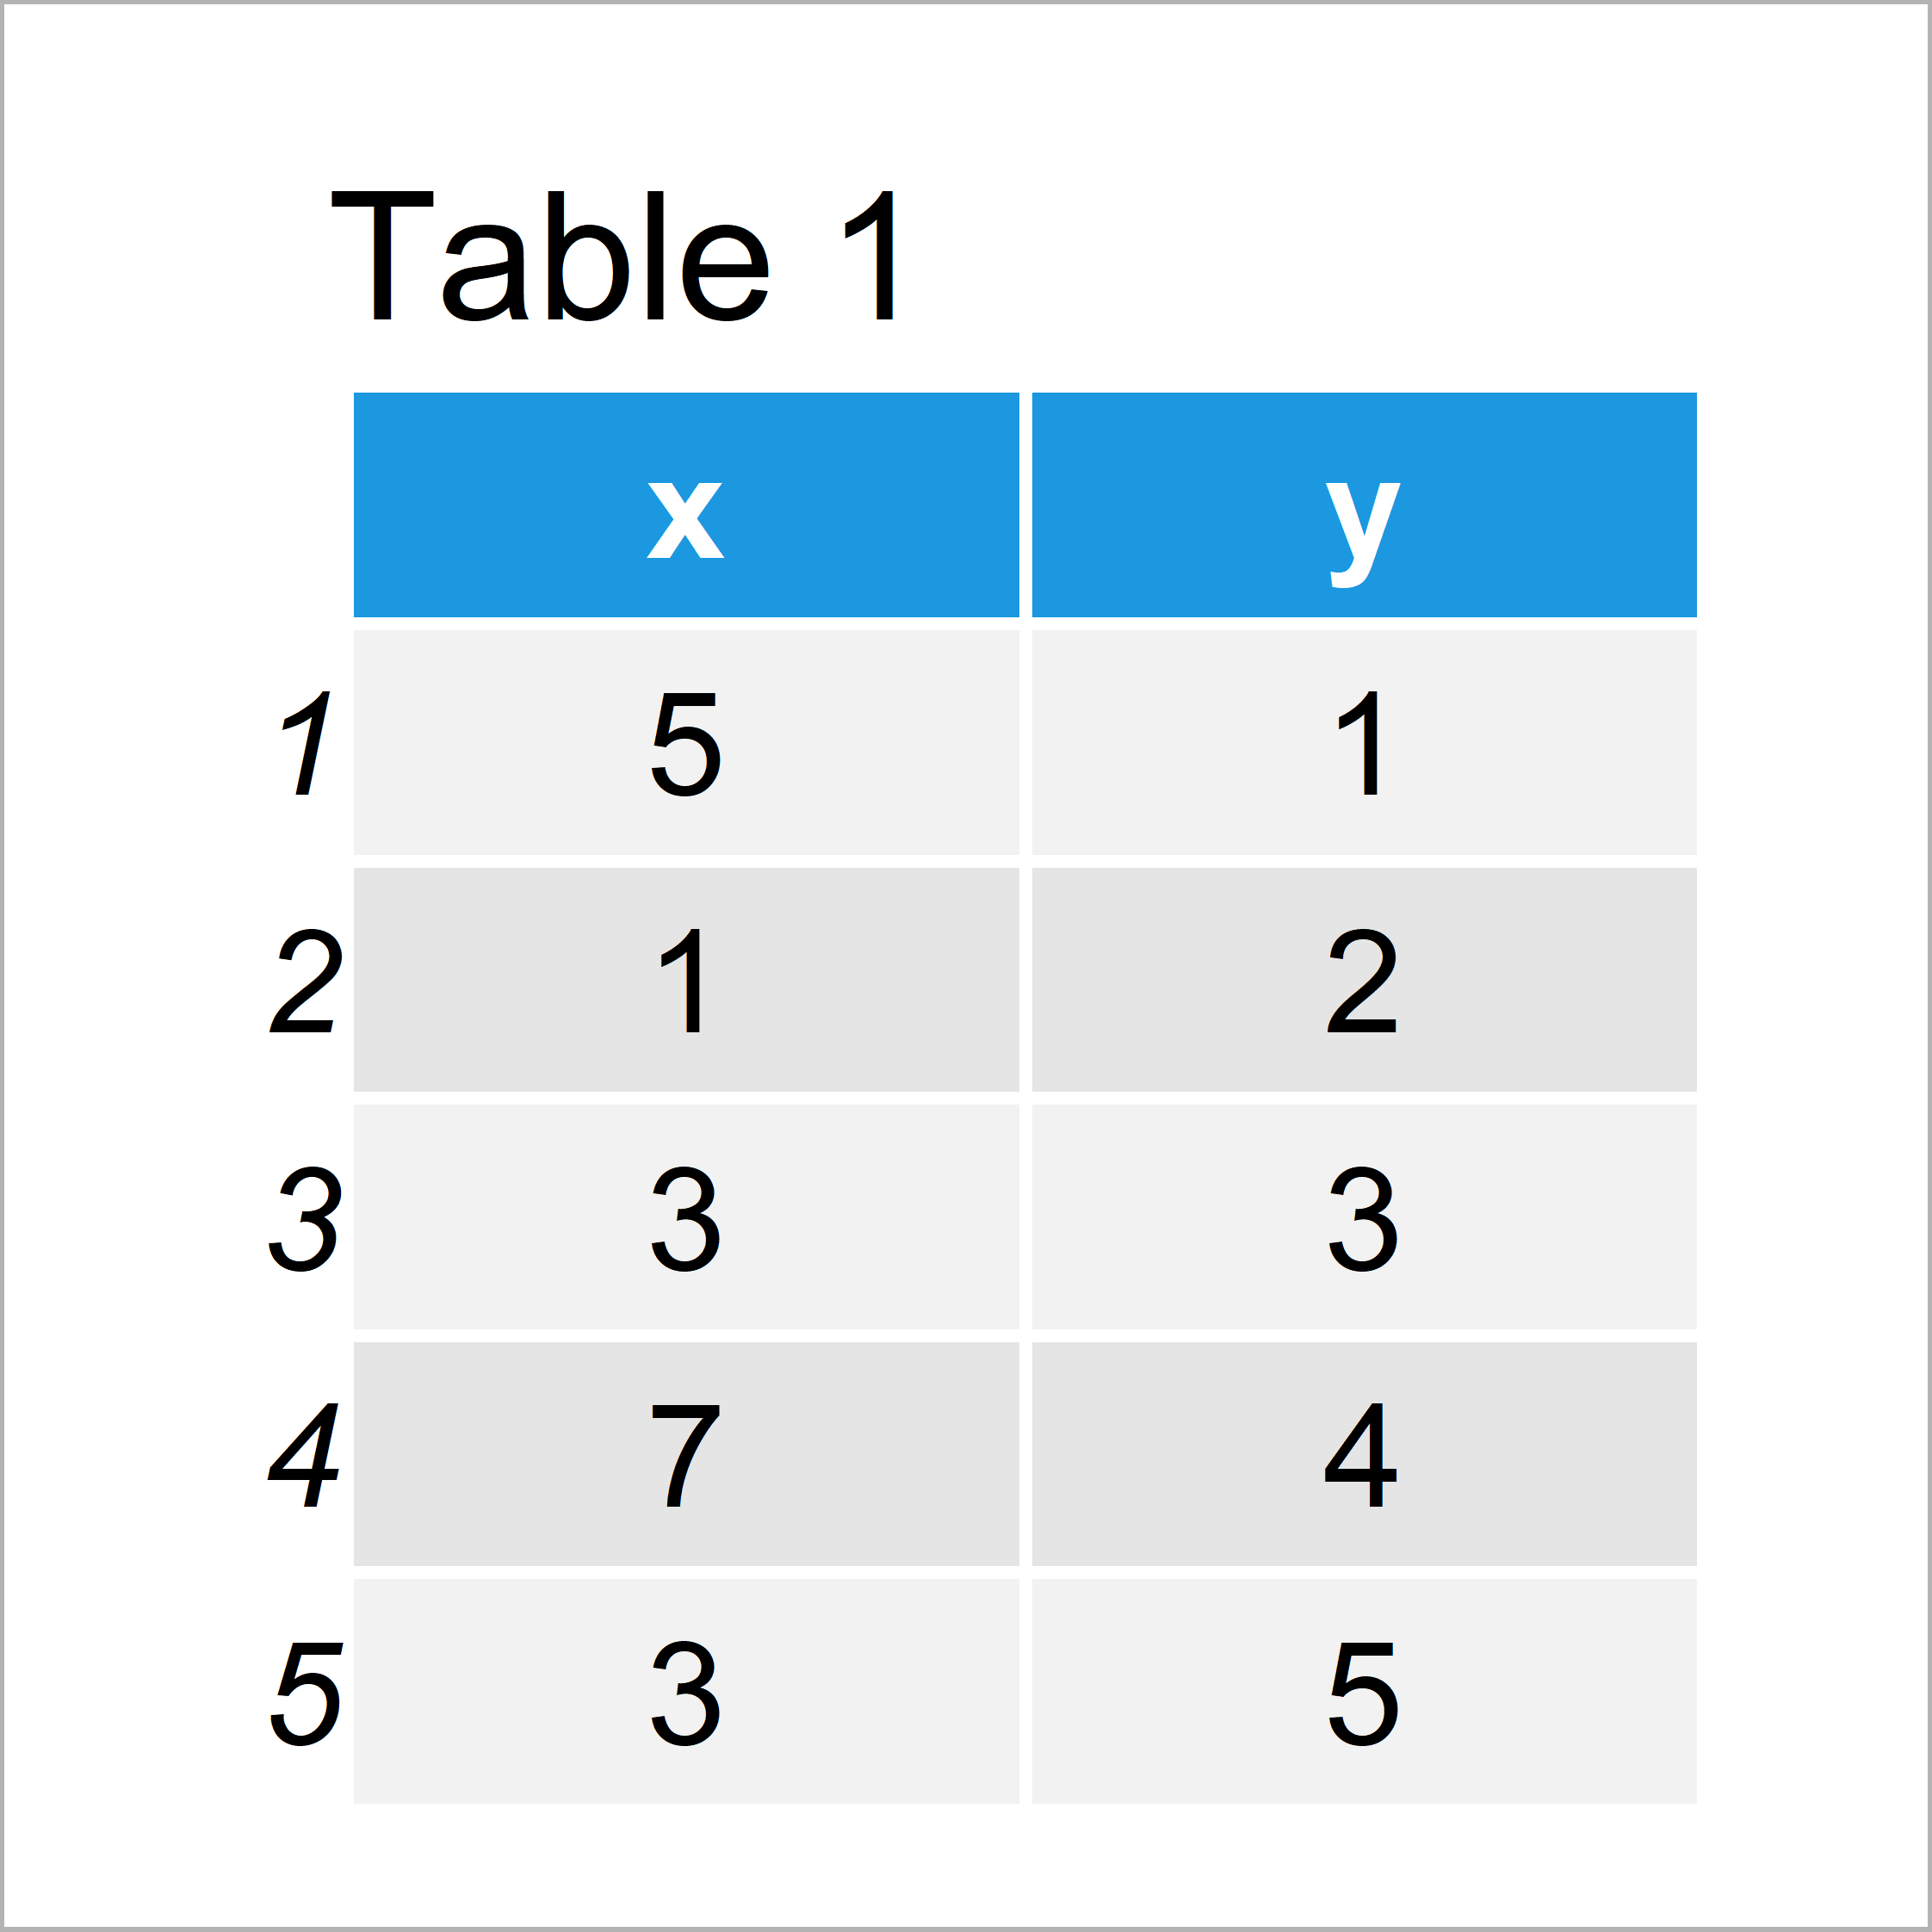
Table 1 shows the structure of our example data – It contains five rows and two columns.
To be able to plot our data using the ggplot2 add-on package, we also have to install and load ggplot2:
install.packages("ggplot2")                 # Install ggplot2 package
library("ggplot2")                          # Load ggplot2 package
Now, we can draw our data in a line plot without any additional text elements as shown below:
ggp <- ggplot(data, aes(x, y)) +            # ggplot2 plot without text
  geom_line()
ggp

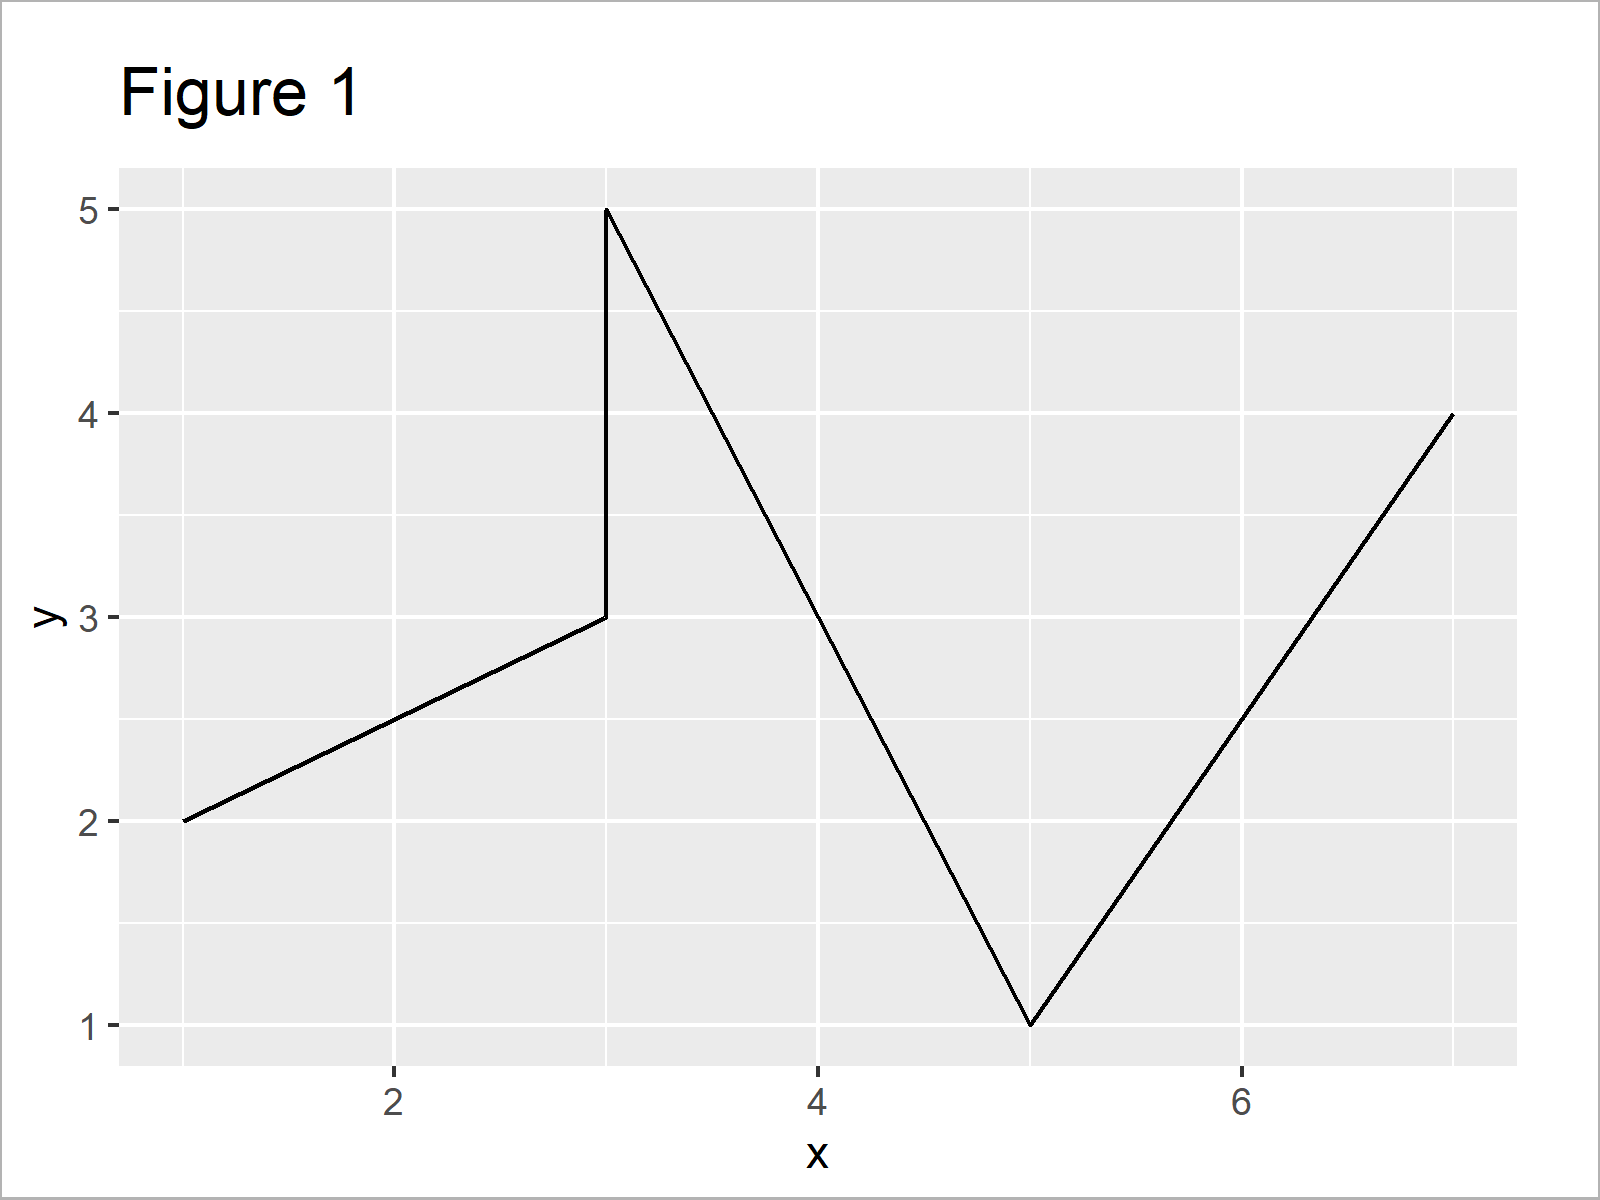
As revealed in Figure 1, the previous R programming syntax has created a ggplot2 graphic without text annotations.
Let’s assume that we want to add some text to our ggplot2 graph. Then, we may use the annotate function as shown below:
ggp +                                       # Applying annotate function
  annotate("text",
           x = 3.5,
           y = 3,
           label = "Text Over Line")

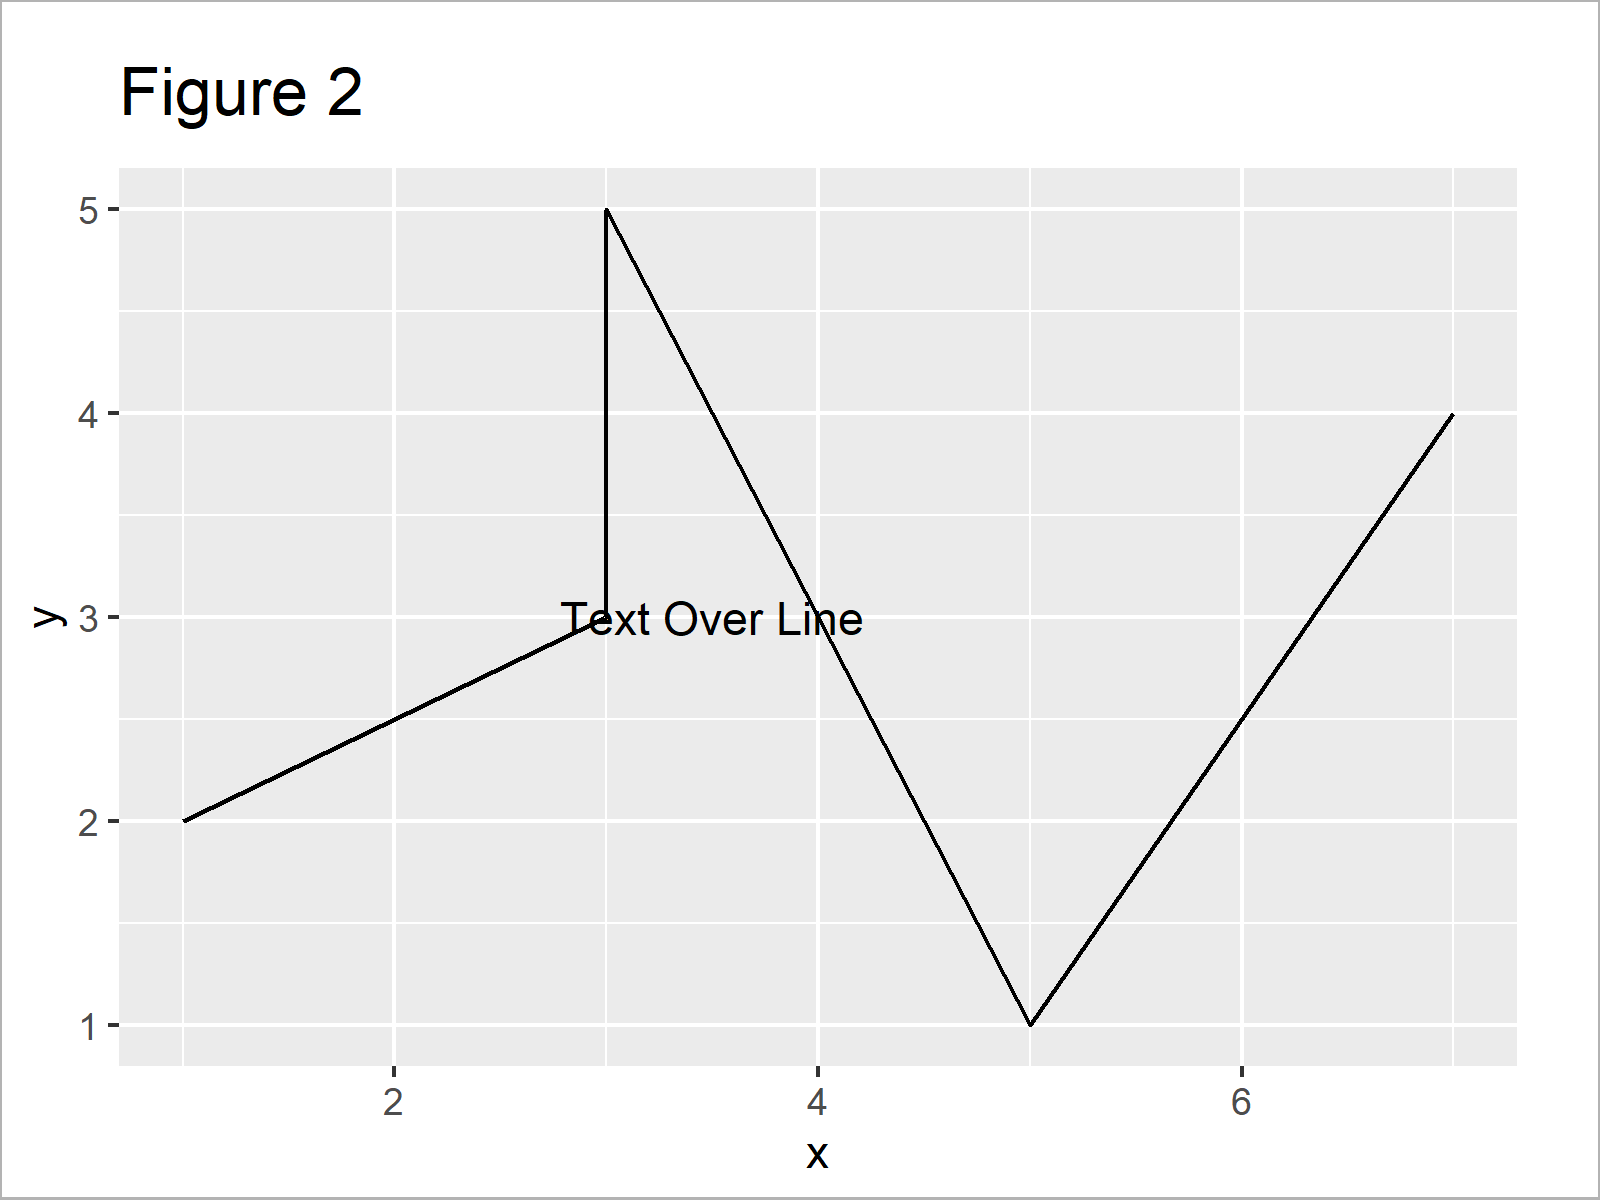
By running the previous syntax we have created Figure 2, i.e. a ggplot2 plot with a text element within the plotting area.
However, as you can see this text element is overlaid by the line of our plot, and hence we cannot read the text well.
For that reason, it might be useful to increase contrast and visibility by adding some background color behind our text field.
In the following example, I’ll explain how to do that – So keep on reading!
Example: Change Background Color of ggplot2 Text Annotation Using geom_label Function
The following R syntax explains how to add background color to a text annotation in a ggplot2 plot.
For this task, we can use the geom_label function instead of the annotate function. Within the geom_label function, we can specify the fill argument to change the background color of our text label:
ggp +                                       # Applying geom_label function
  geom_label(aes(x = 3.5,
                 y = 3,
                 label = "Text Over Line"),
             fill = "yellow")

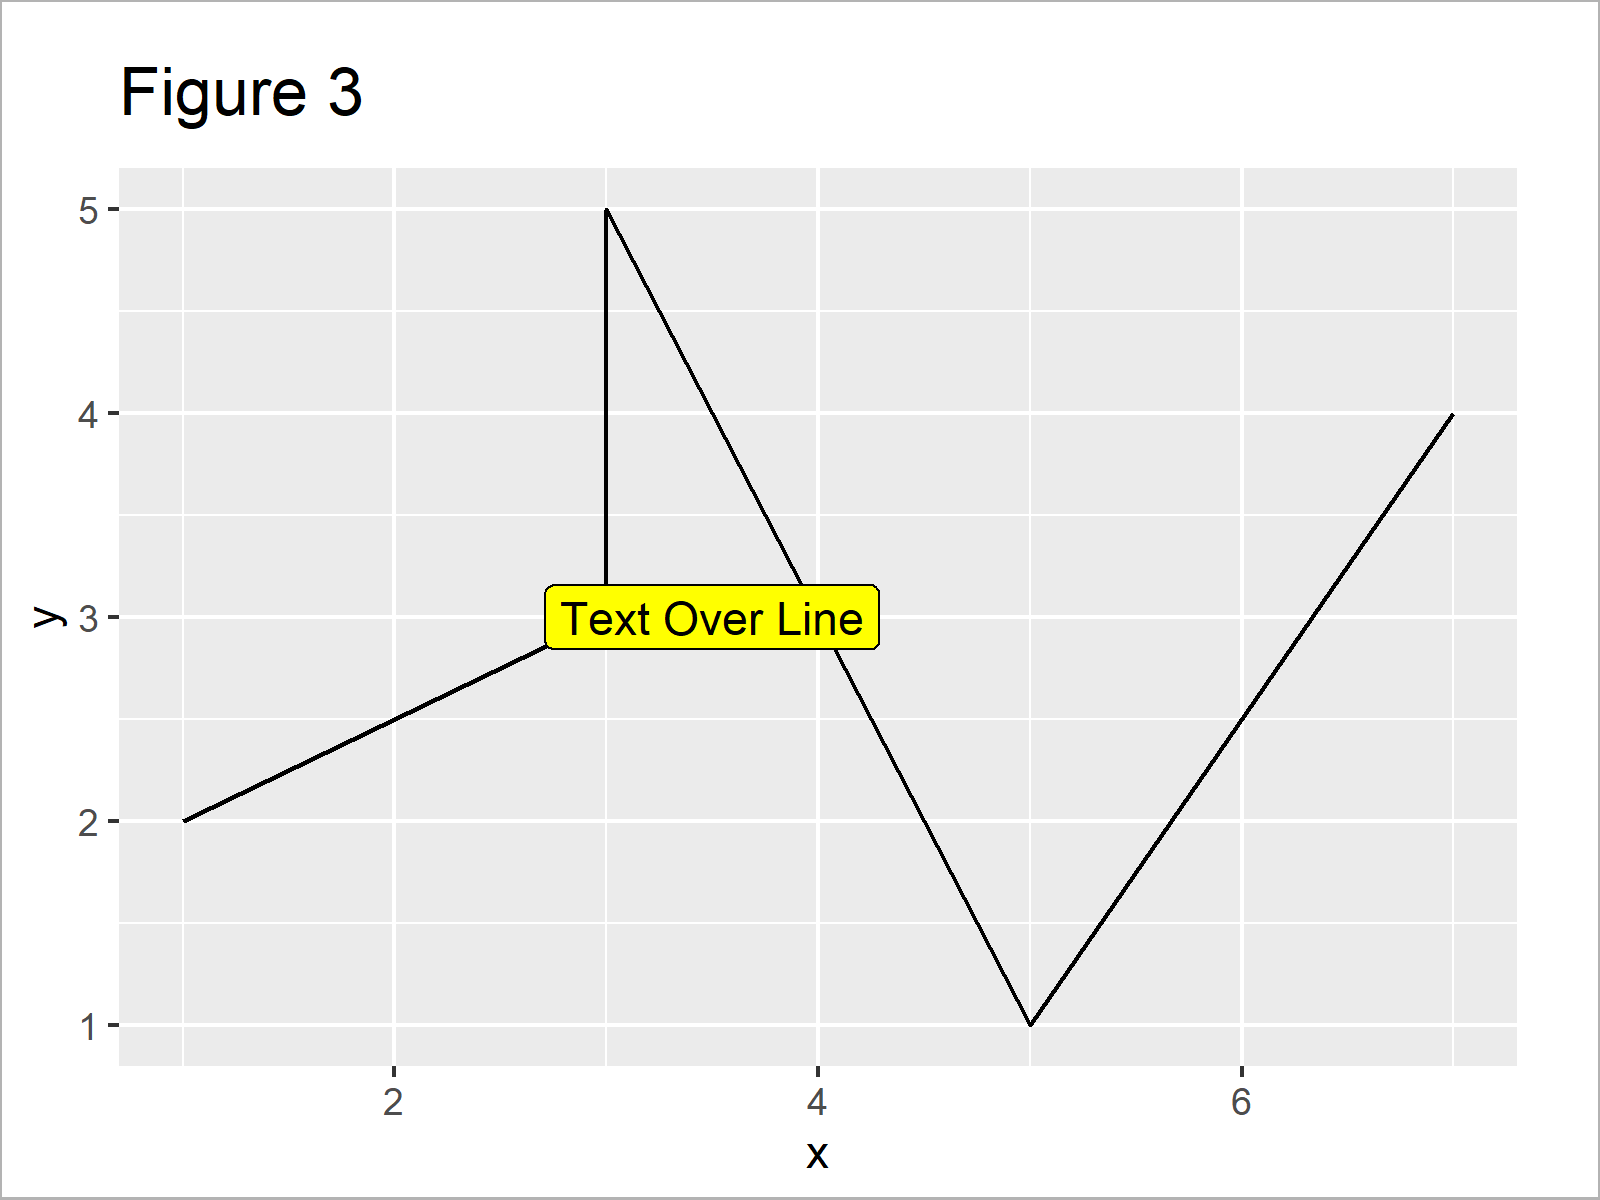
The output of the previous R programming code is visualized in Figure 3 – We have created a plot with text label and different background color.
Video & Further Resources
I have recently released a video on my YouTube channel, which illustrates the topics of this tutorial. You can find the video below.
Furthermore, you may have a look at the related tutorials on my homepage. You can find some tutorials below:
- Change Color of ggplot2 Boxplot
- Change Fill and Border Color of ggplot2 Plot
- Change ggplot2 Color & Fill Using scale_brewer Functions & RColorBrewer Package in R
- Change Background Color of ggplot2 Plot
- Creating Plots in R
- R Programming Examples
You have learned in this article how to modify the background color of a ggplot2 text annotation in R programming. In case you have further questions, don’t hesitate to let me know in the comments section.


