Create Color Range Between Two Colors in R (Example)
In this R programming tutorial you’ll learn how to define a color palette ranging from one color to another.
The tutorial consists of these topics:
Let’s just jump right in!
Example: Create Color Palette Ranging from Blue to Red
If we want to create a color range in R, we can use the colorRampPalette function.
First, we have to use colorRampPalette to define our own function, which specifies the starting and finishing colors of the scale:
fun_color_range <- colorRampPalette(c("#1b98e0", "red")) # Apply colorRampPalette
In the previous R code, we have defined a new function called fun_color_range, which can be used to generate color ranges from the color with the color code #1b98e0 to red.
Now, we can apply this function to return any number n of color codes between these two colors. In the following example, I’m extracting 100 colors:
my_colors <- fun_color_range(100) # Extract 100 color codes
The color codes are now stored in the data object my_colors. We can use this vector of colors within any type of plot we want.
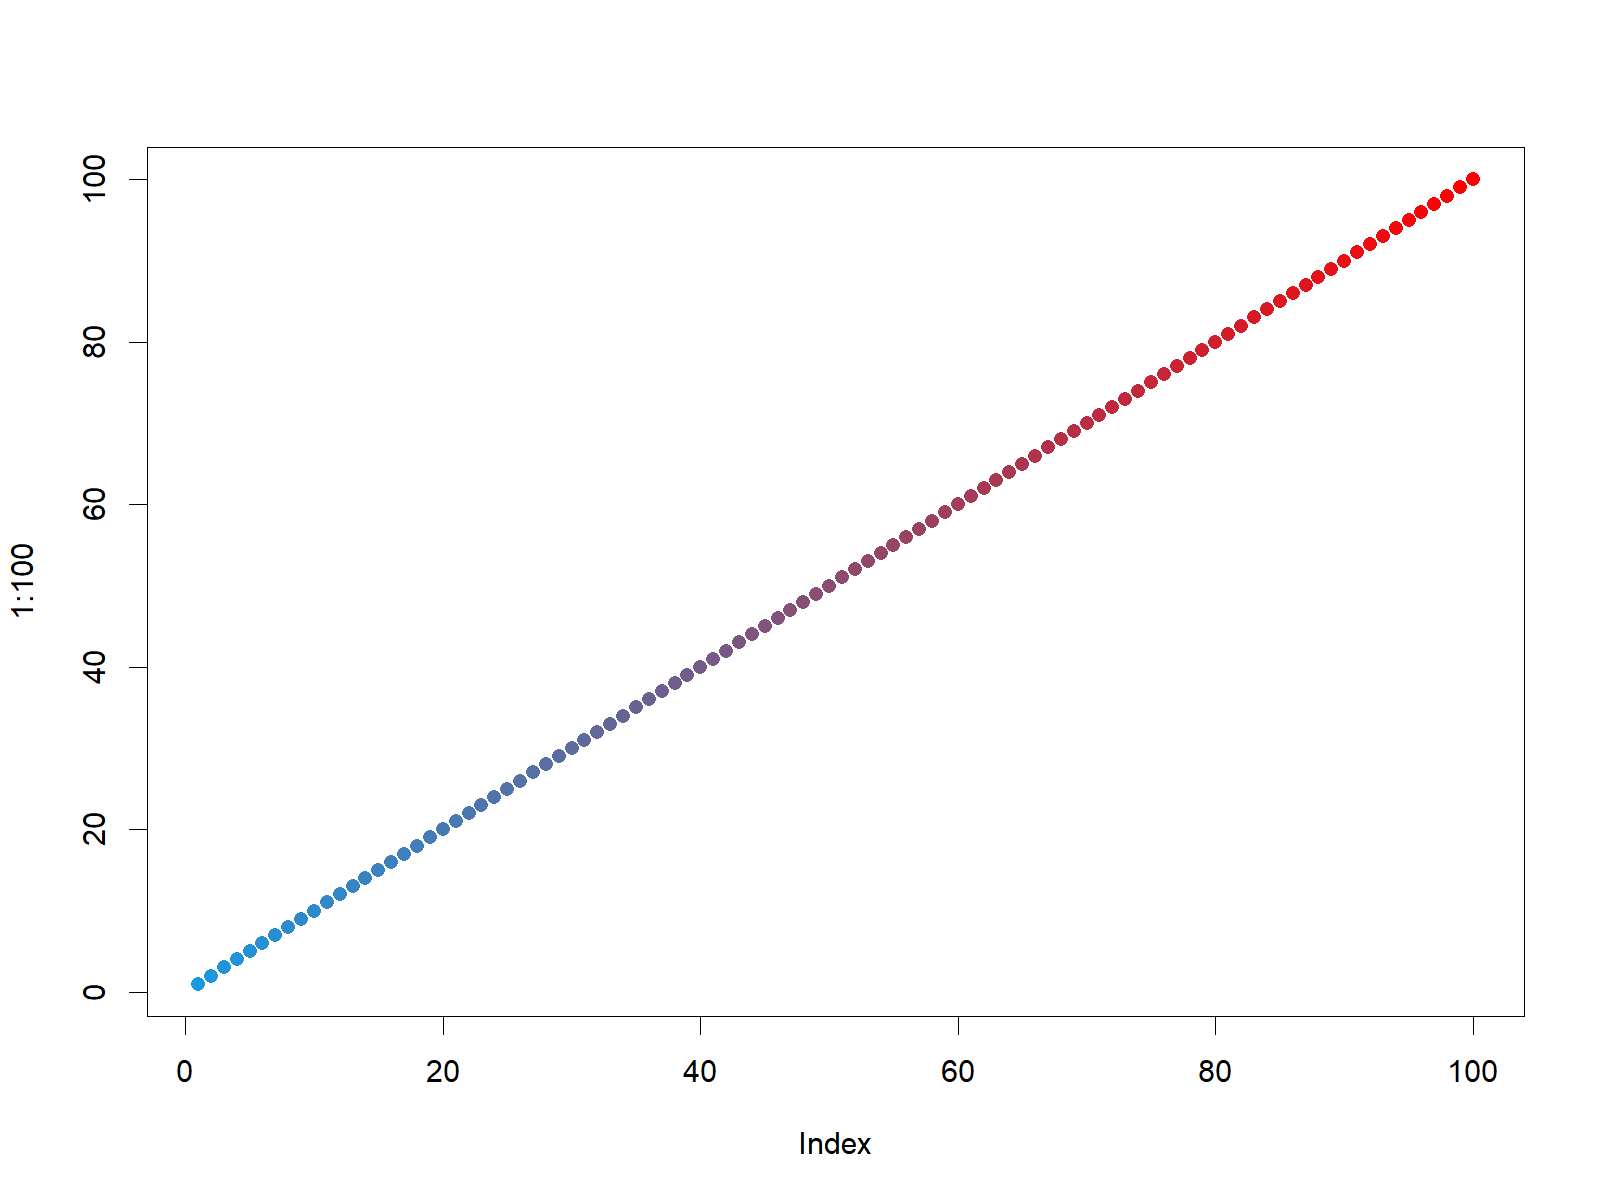
For example, we can create a scatterplot, where each point of the plot has a different color:
plot(1:100,                                                # Example plot
     pch = 16,
     col = my_colors)

Figure 1: Color Range Created colorRampPalette Function.
Figure 1 shows our resulting graphic. A scatterplot with 100 points, whereby each point has a different color.
Video, Further Resources & Summary
Do you need more information on the contents of this article? Then you may watch the following video of my YouTube channel. I illustrate the topics of this article in the video:
In addition, you may have a look at the related posts of this homepage. A selection of posts is listed below.
- Extract Default Color Palette of ggplot2 R Package
- Assign Fixed Colors to Categorical Variable in ggplot2 Plot
- R Graphics Gallery
- R Functions List (+ Examples)
- The R Programming Language
At this point you should know how to gradient of n colors ranging from color 1 to color 2 in the R programming language. If you have further comments and/or questions, please let me know in the comments section. Furthermore, don’t forget to subscribe to my email newsletter to receive updates on new tutorials.


2 Comments. Leave new
I kept getting this: Error in plot.xy(xy, type, …) : object ‘my_colors’ not found
Hi Dan,
I apologize for the delayed reply. I was on a long holiday, so unfortunately I wasn’t able to get back to you earlier. Do you still need help with your syntax?
Regards,
Joachim