Axis in pandas DataFrame Explained (2 Python Examples)
This article demonstrates how to use the axis argument in pandas DataFrames in Python.
The content of the tutorial looks as follows:
Let’s just jump right in.
Example Data & Add-On Libraries
First, we have to import the pandas library:
import pandas as pd # Import pandas library
Next, we’ll also need to define some data that we can use in the examples below:
data = pd.DataFrame({'x1':range(0, 7),    # Create pandas DataFrame
                     'x2':[3, 1, 7, 5, 7, 9, 5],
                     'x3':range(1, 8)})
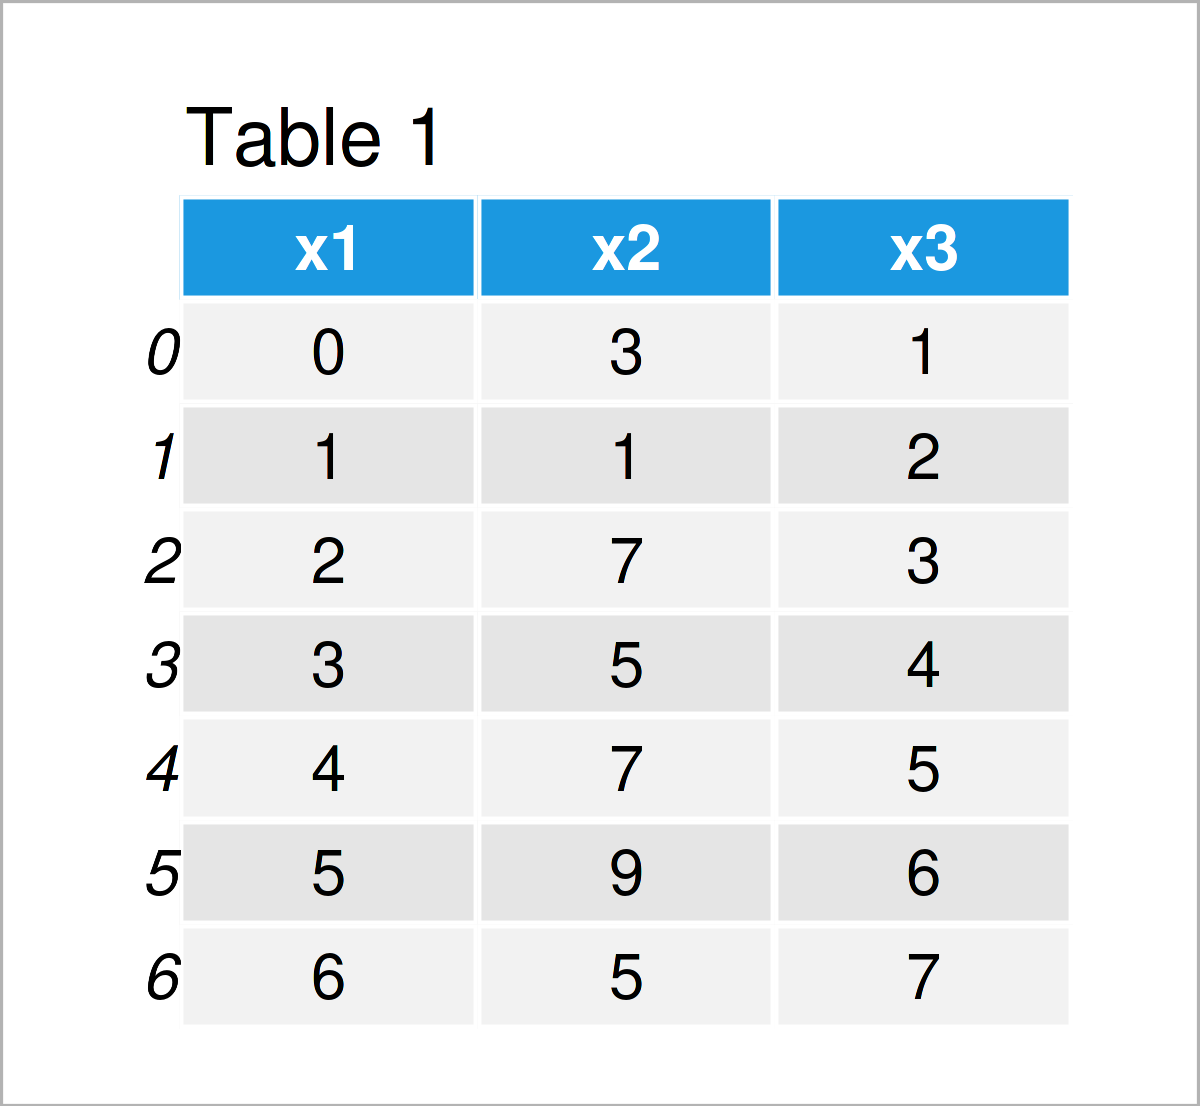
print(data)                               # Print pandas DataFrame

The previous table visualizes that our example pandas DataFrame is constituted of seven rows and three variables.
In the following two examples, I’ll show what the axis argument in pandas means and how it is used. I’ll illustrate that based on the mean function.
Let’s do this!
Example 1: Calculate Values by Column Using axis = 0
In this example, I’ll explain how to compute mean values for each column of a pandas DataFrame.
If we want to do that, we have to specify the axis argument within the mean function to be equal to 0, since axis = 0 indicates that we want to perform our calculation column-wise.
Consider the Python code and its output below:
print(data.mean(axis = 0))                # Column-wise mean
# x1    3.000000
# x2    5.285714
# x3    4.000000
# dtype: float64
As you can see, we have returned the average values of each column.
Note that we could have skipped the axis argument in this example, since axis = 0 is the default specification for the axis argument. However, specifying this argument explicitly might help to make your code more readable.
Example 2: Calculate Values by Row Using axis = 1
In Example 2, I’ll illustrate how to get the mean of each row of a pandas DataFrame.
To accomplish this, we have to set the axis argument to be equal to 1, since this specifies that a calculation should be conducted row-wise.
Have a look at the following Python syntax:
print(data.mean(axis = 1))                # Row-wise mean
# 0    1.333333
# 1    1.333333
# 2    4.000000
# 3    4.000000
# 4    5.333333
# 5    6.666667
# 6    6.000000
# dtype: float64
This time, the Python console has printed the mean value for each row.
Note that this tutorial has illustrated how to apply the axis argument in combination with the mean function. However, we could also use this argument within other functions. For instance, we could use axis = 0 and axis = 1 within the drop function where we would use the axis argument to specify if we want to remove rows or columns.
Video, Further Resources & Summary
Would you like to know more about the usage of the axis argument in pandas DataFrames? Then I recommend watching the following video that I have published on my YouTube channel. In the video, I’m explaining the Python programming codes of this tutorial:
Furthermore, you might read some of the other Python programming posts on this website.
- Loop Through Index of pandas DataFrame in Python
- Iterate Through Rows of pandas DataFrame in Python
- Add Column from Another pandas DataFrame in Python
- Remove Rows with NaN from pandas DataFrame in Python
- Introduction to the pandas Library in Python
- Introduction to Python Programming
Summary: This tutorial has explained how to apply the axis argument in pandas DataFrames in Python programming. If you have any further questions, please tell me about it in the comments.


