Mean of Columns & Rows of pandas DataFrame in Python (2 Examples)
On this page you’ll learn how to calculate the column and row means of a pandas DataFrame in the Python programming language.
The content of the tutorial looks as follows:
You’re here for the answer, so let’s get straight to the exemplifying Python syntax:
Example Data & Libraries
If we want to use the functions of the pandas library, we first need to import pandas:
import pandas as pd # Import pandas
Next, I’ll also have to create some example data:
data = pd.DataFrame({'x1':[6, 2, 7, 9, 7, 1, 9],  # Create example DataFrame
                     'x2':[2, 5, 9, 2, 5, 2, 3],
                     'x3':range(10, 3, - 1)})
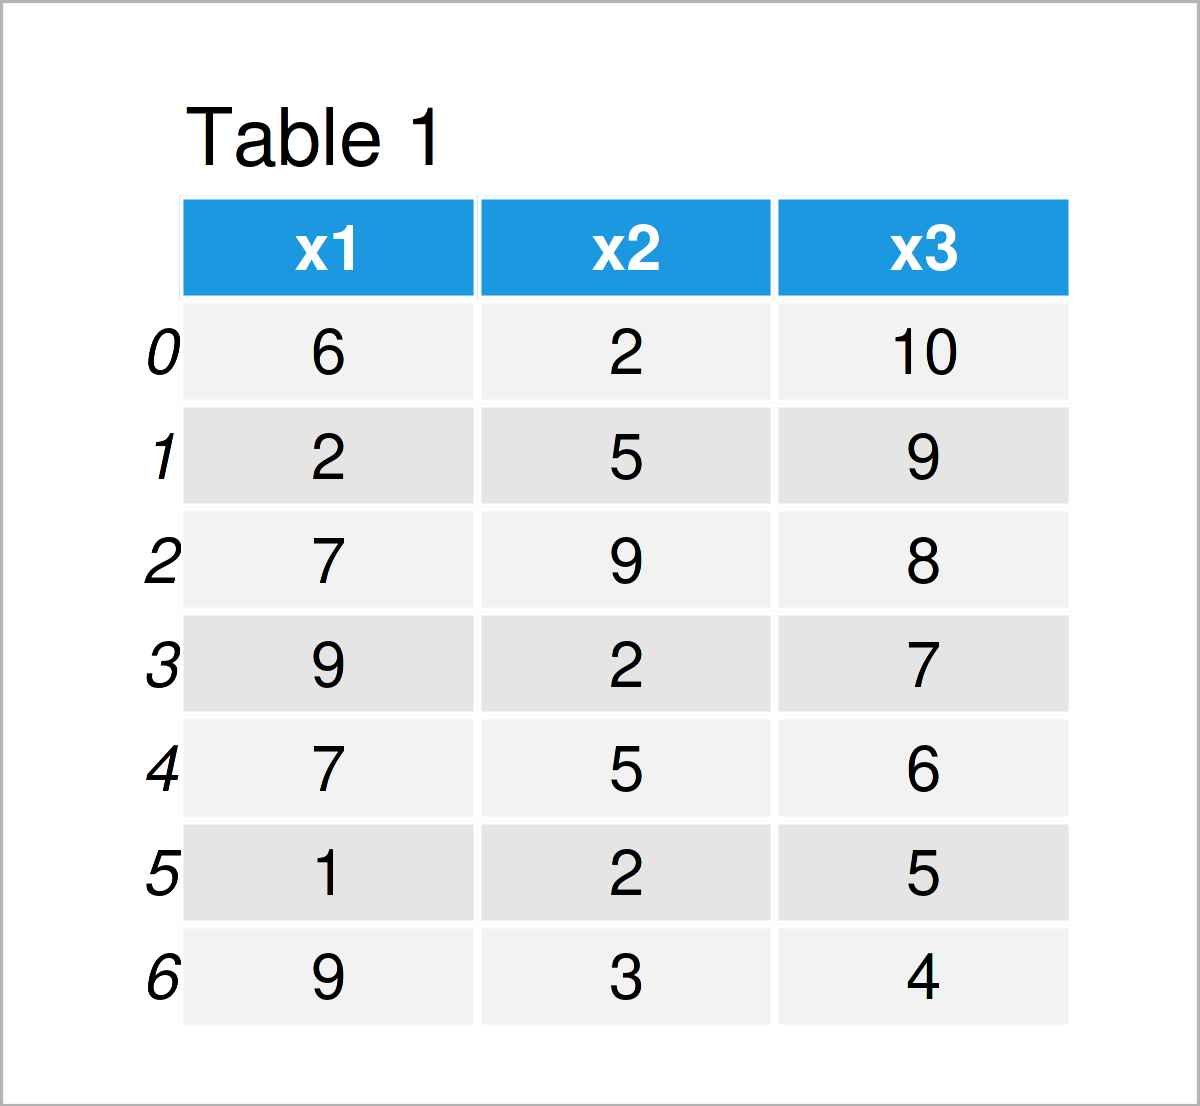
print(data)                                       # Print example DataFrame

As you can see based on Table 1, our example data is a DataFrame made of seven rows and the three columns “x1”, “x2”, and “x3”.
Example 1: Calculate Mean of Each Column in pandas DataFrame
The following syntax shows how to get the average of each variable in a pandas DataFrame using the Python programming language.
For this, we can apply the mean function as shown below:
print(data.mean())                                # Get column means
# x1    5.857143
# x2    4.000000
# x3    7.000000
# dtype: float64
As you can see based on the previous console output, the means of our columns are 5.857143, 4.0, and 7.0.
Example 2: Calculate Mean of Each Row in pandas DataFrame
In this example, I’ll show how to return the average of each row of a pandas DataFrame.
To do this, we can use the mean function once again (as in Example 1), but this time we have to specify the axis argument to be equal to 1.
Have a look at the Python syntax below:
print(data.mean(axis = 1))                        # Get row means
# 0    6.000000
# 1    5.333333
# 2    8.000000
# 3    6.000000
# 4    6.000000
# 5    2.666667
# 6    5.333333
# dtype: float64
The previous output shows the mean values of each of the rows of our example data set.
Video & Further Resources on this Topic
Do you need further info on the Python code of this article? Then you might have a look at the following video on my YouTube channel. In the video, I’m explaining the content of this post in more detail:
Would you like to learn more about metrics such as the mean, mode, and median? Then you might check out the video of the PortEXE YouTube channel that you can find below.
In addition, you might read the related articles on this homepage:
- Basic Course for the pandas Library in Python
- Replace NaN Values by Column Mean in Python
- Sum of Columns & Rows of pandas DataFrame
- All Python Programming Tutorials
To summarize: You have learned in this article how to get the column and row means of a pandas DataFrame in Python. Tell me about it in the comments section, if you have any further questions.


2 Comments. Leave new
Question: Suppose x1 is the end-of-month housing price and a historical data from Jan. 2022 through April 2023. Would you please show me how to compute the end-of-month quarterly average of housing prices? That is, March, June, September, December 2022 and March 2023?
Thanks.
Hello Tom,
I was on a vacation. I can return to addressing the comments now that I am back from vacation. It has been a while since you posted the comment, do you still need help?
Best,
Cansu