ave Function in R (2 Examples)
This tutorial demonstrates how to calculate averages using the ave function in the R programming language.
The article will consist of two examples for the usage of the ave function. More precisely, the tutorial will consist of this:
Let’s dive into it!
Creation of Example Data
The first step is to create some data that we can use in the examples below:
data <- data.frame(value = c(3, 1, 5, 5, 6, 2, 8, 1),  # Create example data frame
                   group = rep(letters[1:4], each = 2))
data                                                   # Print example data frame

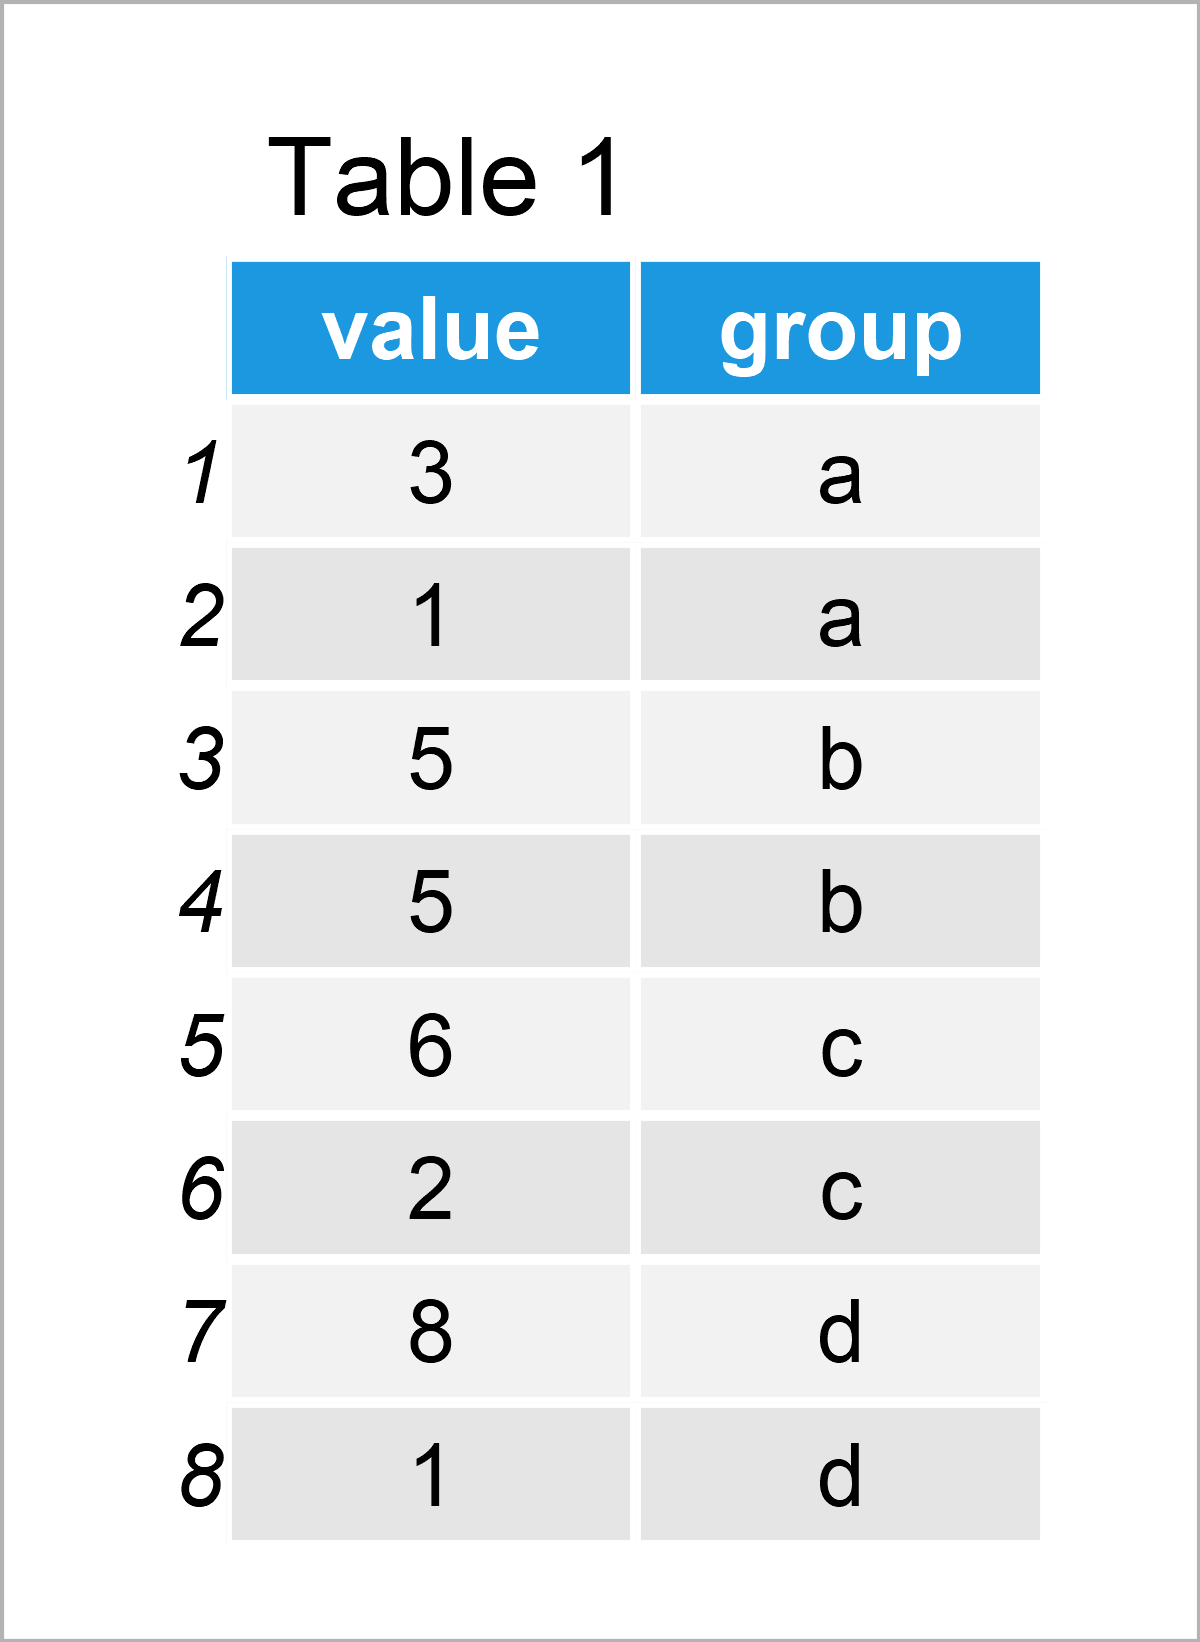
As you can see based on Table 1, our example data is a data frame containing eight rows and two columns. The variable value is numerical and the variable group has the character class.
Example 1: Apply ave() Function to Entire Data Frame Column
The following R programming code explains how to calculate the mean value of an entire data frame column (or a vector object).
Usually, we would use the mean function for this task:
mean_all <- mean(data$value)                           # Apply mean function
mean_all                                               # Result of mean function
# [1] 3.875
However, we may also use the ave function as shown below:
ave_all <- ave(data$value,                             # Apply ave function
               FUN = mean)
ave_all                                                # Result of ave function
# [1] 3.875 3.875 3.875 3.875 3.875 3.875 3.875 3.875
Are you already noticing the difference between the mean and ave functions?
The mean function returns the output only once. In contrast, the ave function returns the output once per input value.
There’s more to learn about the ave function! So keep on reading…
Example 2: Apply ave() Function to by Group & Add to Data Frame
Example 2 shows how to use the ave function to calculate averages by group.
For this, we have to specify our group column within the ave function as well.
Consider the R programming syntax below:
ave_group <- ave(data$value,                           # Apply ave function by group
                 data$group,
                 FUN = mean)
ave_group                                              # Print average by group
# [1] 2.0 2.0 5.0 5.0 4.0 4.0 4.5 4.5
As you can see, we have returned the mean value for each group.
This is especially useful, if we want to add those grouped mean values as a new column to our data frame:
data_new <- data.frame(data,                           # Combine data and ave output
                       ave_group)
data_new                                               # Print new data frame

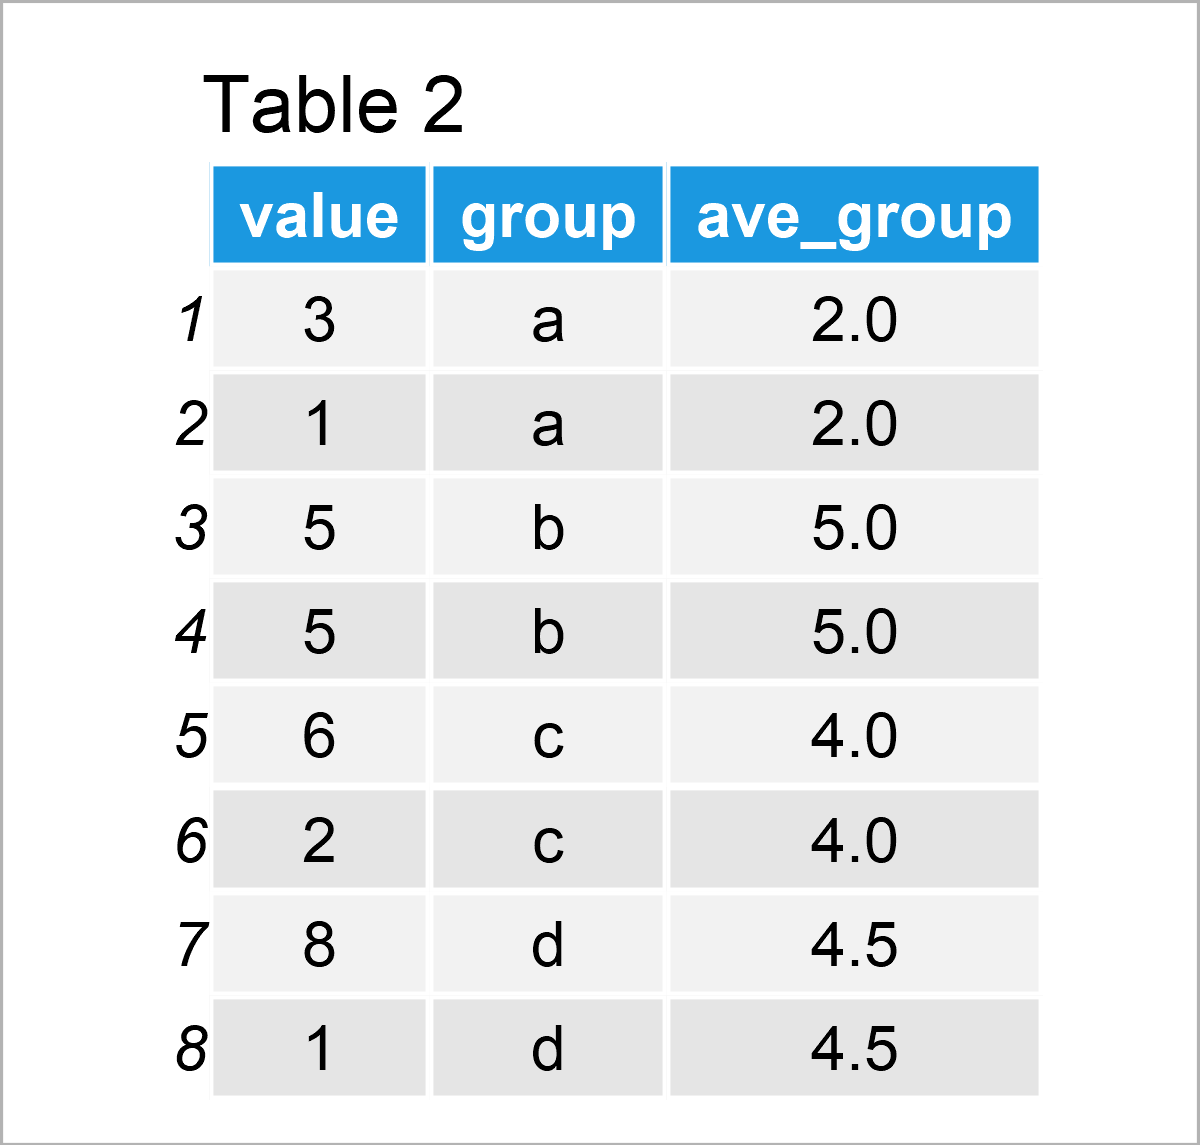
After running the previously shown code the data frame visualized in Table 2 has been created.
We have added the mean value for each group to our data frame.
In this example, we have used a character column to group our data. However, it’s also possible to calculate the grouped mean over level combinations of factors.
Video, Further Resources & Summary
Have a look at the following video which I have published on my YouTube channel. I show the examples of this tutorial in the video.
In addition, you may want to have a look at the related articles on this website:
- Weighted Mean in R
- Replace Missing Values by Column Mean
- Cumulative Mean in R
- Important Functions in R (Programming Examples)
- All R Programming Examples
At this point you should have learned how to compute the average using the ave function in the R programming language. Please let me know in the comments section, if you have further questions. Furthermore, please subscribe to my email newsletter to receive updates on the newest articles.


