R Error in xy.coords(x, y, xlabel, ylabel, log) : ‘x’ and ‘y’ length differ
In this R tutorial you’ll learn how to handle the error in xy.coords that ‘x’ and ‘y’ lengths differ.
The content of the post is structured like this:
So now the part you have been waiting for – the examples:
Example 1: Reproduce the Error Message in xy.coords – ‘x’ and ‘y’ lengths differ
This example illustrates how to replicate the R programming error in xy.coords that ‘x’ and ‘y’ lengths differ.
Let’s assume that we want to draw a scatterplot using the plot function. Then, we might try to use an R code as shown below:
plot(1:5, 1:6)                     # Try to draw plot with different data length
# Error in xy.coords(x, y, xlabel, ylabel, log) :
#   'x' and 'y' lengths differ
As you can see, the previous R code returned the error message in xy.coords that ‘x’ and ‘y’ lengths differ to the RStudio console.
The reason for this is that the two input vectors we have inserted in the plot function have a different length.
So how can we solve this problem?
Example 2: Fix the Error Message in xy.coords – ‘x’ and ‘y’ lengths differ
Example 2 explains how to avoid the error in xy.coords that ‘x’ and ‘y’ lengths differ.
The easiest solution is that we shorten the longer vector of our two input vectors (i.e. the second vector):
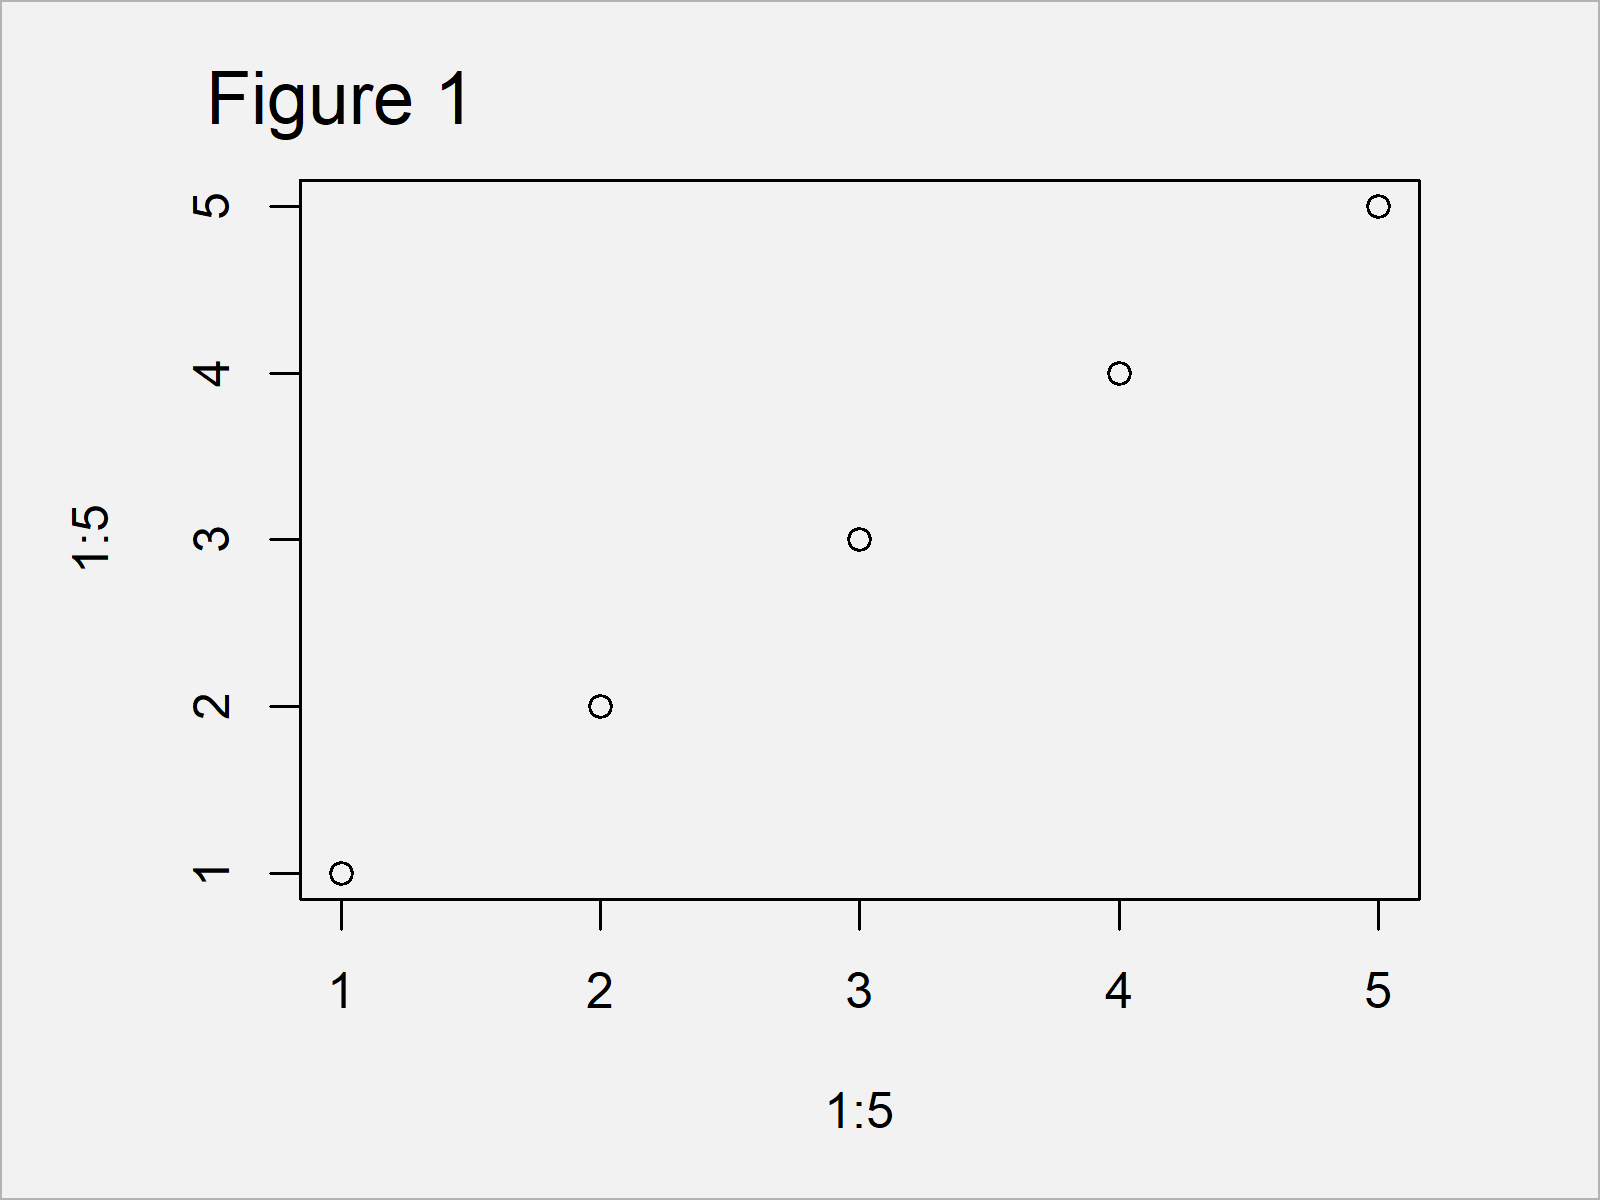
plot(1:5, 1:5) # Same length of vectors

Figure 1 shows the output of the previous R programming syntax – A scatterplot created by the plot() function.
Please note that it is very important to check why both input vectors had a different length in the beginning.
Are there any missing values in one of the vectors? Is there a theoretical justification for the different vector sizes? Do the elements of both vectors match the same observation?
You should be able to answer these questions to make sure that your graphic is showing correct data points.
Video, Further Resources & Summary
Do you want to know more about errors in R? Then I recommend having a look at the following video of my YouTube channel. I explain the R programming codes of this article in the video:
Furthermore, you could have a look at some of the other articles on this website.
At this point you should know how to deal with the Error in xy.coords that ‘x’ and ‘y’ lengths differ in the R programming language. In case you have any further questions, let me know in the comments. Besides that, please subscribe to my email newsletter to receive updates on the newest articles.


