addmargins Function in R (2 Examples)
In this article, I’ll illustrate how to put margins on tables or arrays using the addmargins function in the R programming language.
The tutorial will consist of two examples for the annotation of margin values on table objects using the addmargins function. To be more precise, the tutorial contains this information:
Let’s get started:
Introducing Example Data
We’ll use the data below as basement for this R tutorial:
data <- data.frame(x1 = c(LETTERS[1:3],       # Create example data frame
                          "B", "B", "C"),
                   x2 = letters[1:2])
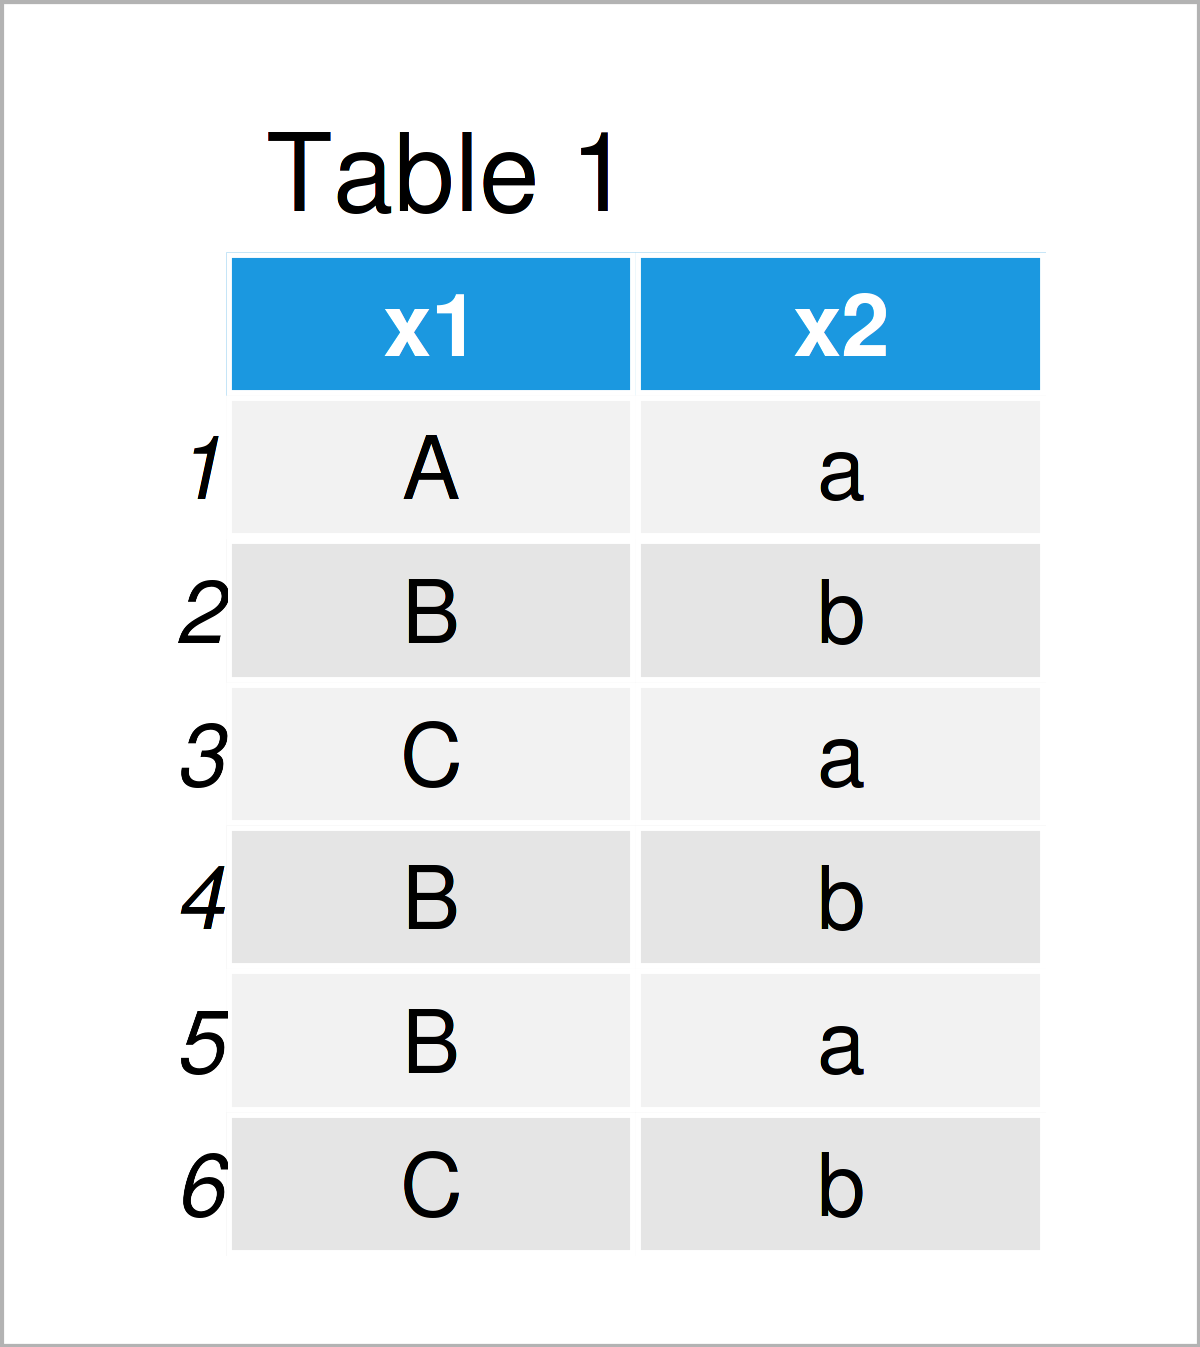
data                                          # Print example data frame

Have a look at the previous table. It illustrates that the example data frame is made up of six rows and two variables.
Next, we can create a table object (i.e. a contingency table) based on these data:
my_tab <- table(data)                         # Create contingency table
my_tab                                        # Print contingency table
#    x2
# x1  a b
#   A 1 0
#   B 1 2
#   C 1 1
The previous RStudio console output illustrates our table without margins.
Example 1: Put Sum Margins to Contingency Table Using addmargins() Function
In Example 1, I’ll demonstrate how to use the addmargins function to add the sum of each row and column to the margins of a table.
Consider the following R code:
tab_sum <- addmargins(my_tab, FUN = sum)      # Apply addmargins function
tab_sum                                       # Table with sum margins
#      x2
# x1    a b sum
#   A   1 0   1
#   B   1 2   3
#   C   1 1   2
#   sum 3 3   6
As you can see, we have a annotated another row and column that contain the sum margins of our data.
Example 2: Put Mean Margins to Contingency Table Using addmargins() Function
In Example 1, we have used the sum function to put margins on our contingency table.
However, it is also possible to use other functions within the addmargins command.
The following R code shows how to annotate mean values to a table object:
tab_mean <- addmargins(my_tab, FUN = mean)    # Apply addmargins function
tab_mean                                      # Table with mean margins
#       x2
# x1       a   b mean
#   A    1.0 0.0  0.5
#   B    1.0 2.0  1.5
#   C    1.0 1.0  1.0
#   mean 1.0 1.0  1.0
The structure of the previous table is similar as in Example 1. However, this time we have added mean margins instead of sum margins.
Video, Further Resources & Summary
Do you want to know more about the annotation of margin values on table objects using the addmargins function? Then you might want to have a look at the following video on my YouTube channel. I’m explaining the R programming codes of this tutorial in the video:
In addition, you could read some of the other posts on https://www.statisticsglobe.com/.
- Create Tables in R
- Contingency Table in R
- Frequency Table in R
- Proportions Table in R
- Useful Commands in R (+ Examples)
- All R Programming Examples
In summary: At this point you should know how to put margins on tables or arrays using the addmargins function in the R programming language. Don’t hesitate to let me know in the comments below, in case you have additional questions or comments.


