prop.table Function in R (3 Examples)
In this post, I’ll demonstrate how to apply the prop.table function in the R programming language.
The article consists of three examples for the creation of a proportions table. To be more specific, the tutorial contains the following content:
Let’s dive right in!
Example Data
I’ll use the following data as basement for this R tutorial:
data <- data.frame(x1 = c(letters[1:4], letters[3:6], "c"),  # Create example data
                   x2 = LETTERS[1:3])
data                                                         # Print example data

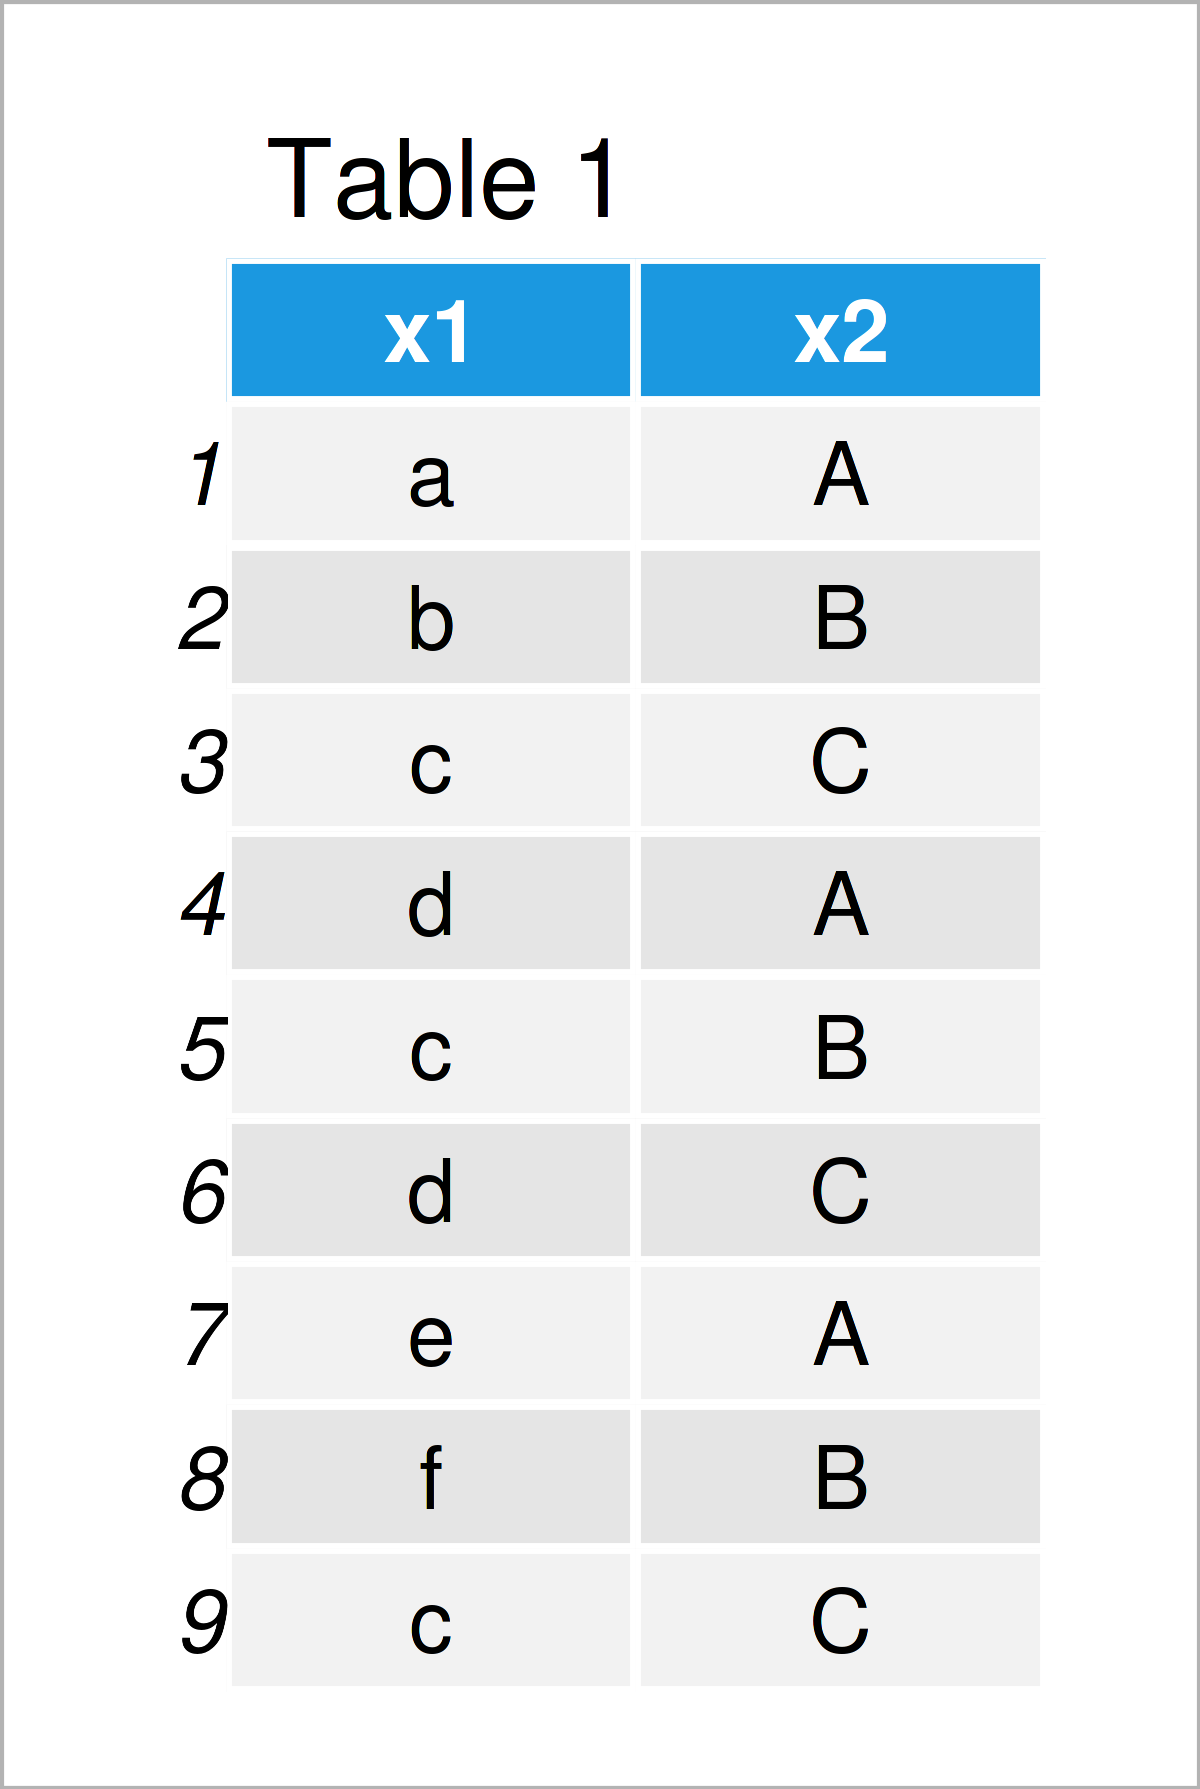
Table 1 shows that our example data is made of nine rows and two columns.
In the next step, we can create a frequency table (or more precisely a contingency table) based on our example data frame:
my_tab <- table(data)                                        # Create frequency table
my_tab                                                       # Print frequency table
#    x2
# x1  A B C
#   a 1 0 0
#   b 0 1 0
#   c 0 1 2
#   d 1 0 1
#   e 1 0 0
#   f 0 1 0
The previous output of the RStudio console shows the frequency counts of each combination of the two columns x1 and x2.
Next, we can use this table object to create a relative proportions table. Let’s do this!
Example 1: Create Proportions Table with Sum of All Cells as Margin
Example 1 explains how to convert a frequency table to a proportions table.
For this task, we can use the prop.table function as explained below:
prop_tab1 <- prop.table(my_tab)                              # Apply prob.table function
prop_tab1                                                    # Print proportions table
#    x2
# x1          A         B         C
#   a 0.1111111 0.0000000 0.0000000
#   b 0.0000000 0.1111111 0.0000000
#   c 0.0000000 0.1111111 0.2222222
#   d 0.1111111 0.0000000 0.1111111
#   e 0.1111111 0.0000000 0.0000000
#   f 0.0000000 0.1111111 0.0000000
The previous output shows the proportions (or probabilities) relative to the sum of the entire input table.
For instance, the combination of A and a contains 11.11 percent of the sum of the entire contingency table.
Example 2: Create Proportions Table with Sum of Rows as Margin
In Example 1, we have used the sum of all table cells as margin.
Example 2 explains how to get the value of each table cell divided by the sum of the row cells.
For this, we can set the margin argument of the prop.table function to 1:
prop_tab2 <- prop.table(my_tab, margin = 1)                  # Row margins
prop_tab2                                                    # Print proportions table
#    x2
# x1          A         B         C
#   a 1.0000000 0.0000000 0.0000000
#   b 0.0000000 1.0000000 0.0000000
#   c 0.0000000 0.3333333 0.6666667
#   d 0.5000000 0.0000000 0.5000000
#   e 1.0000000 0.0000000 0.0000000
#   f 0.0000000 1.0000000 0.0000000
Example 3: Create Proportions Table with Sum of Columns as Margin
In Example 3, I’ll show how to return the value of each cell divided by the corresponding column sum.
For this, we can set the margin argument to be equal to 2:
prop_tab3 <- prop.table(my_tab, margin = 2)                  # Column margins
prop_tab3                                                    # Print proportions table
#    x2
# x1          A         B         C
#   a 0.3333333 0.0000000 0.0000000
#   b 0.0000000 0.3333333 0.0000000
#   c 0.0000000 0.3333333 0.6666667
#   d 0.3333333 0.0000000 0.3333333
#   e 0.3333333 0.0000000 0.0000000
#   f 0.0000000 0.3333333 0.0000000
Video, Further Resources & Summary
Have a look at the following video on my YouTube channel. In the video, I explain the content of this tutorial:
The YouTube video will be added soon.
In addition, you may want to have a look at some of the other articles on my website.
- Extend Contingency Table with Proportions & Percentages
- Proportions with dplyr Package in R
- Contingency Table in R
- Frequency Table in R
- List of R Functions
- R Programming Overview
In summary: In this tutorial, I have demonstrated how to calculate and create a conditional proportions table using the prop.table function in R.
Please note that we could also use the proportions function instead of the prop.table function. The proportions command would return exactly the same results.
In case you have additional questions, let me know in the comments.


