reorder Function in R (2 Examples)
This tutorial shows how to use the reorder function in R programming.
Table of contents:
Let’s take a look at some R codes in action.
Example 1: Change Ordering of Factor Levels Using reorder() Function
In Example 1, I’ll show how to reorder the levels of a factor using the reorder function.
First, we have to create an exemplifying factor vector:
vec <- factor(c("c", "b", "a"))                    # Create example vector
vec                                                # Print example vector
# [1] c b a
# Levels: a b c
As you can see based on the previous output, our factor has the levels a, b, and c. These levels are sorted alphabetically.
We might now use the reorder function to change the ordering of our factor levels without changing the actual values in our vector:
vec_reorder <- reorder(vec, c(2, 1, 3))            # Apply reorder function to vector
vec_reorder                                        # Print output of reorder function
# [1] c b a
# attr(,"scores")
# a b c
# 3 1 2
# Levels: b c a
Have a look at the previous output: It shows that the ordering of our factor levels has been changed to b, c, and a.
Example 2: Sort Boxplot Using reorder() Function
In Example 2, I’ll demonstrate how to use the reorder function to sort a boxplot graphic by the median.
First, we have to create a data frame object:
data <- data.frame(value = c(1, 7, 1, 2, 6, 4),    # Create example data frame
                   group = rep(letters[1:3], each = 2))
data                                               # Print example data frame

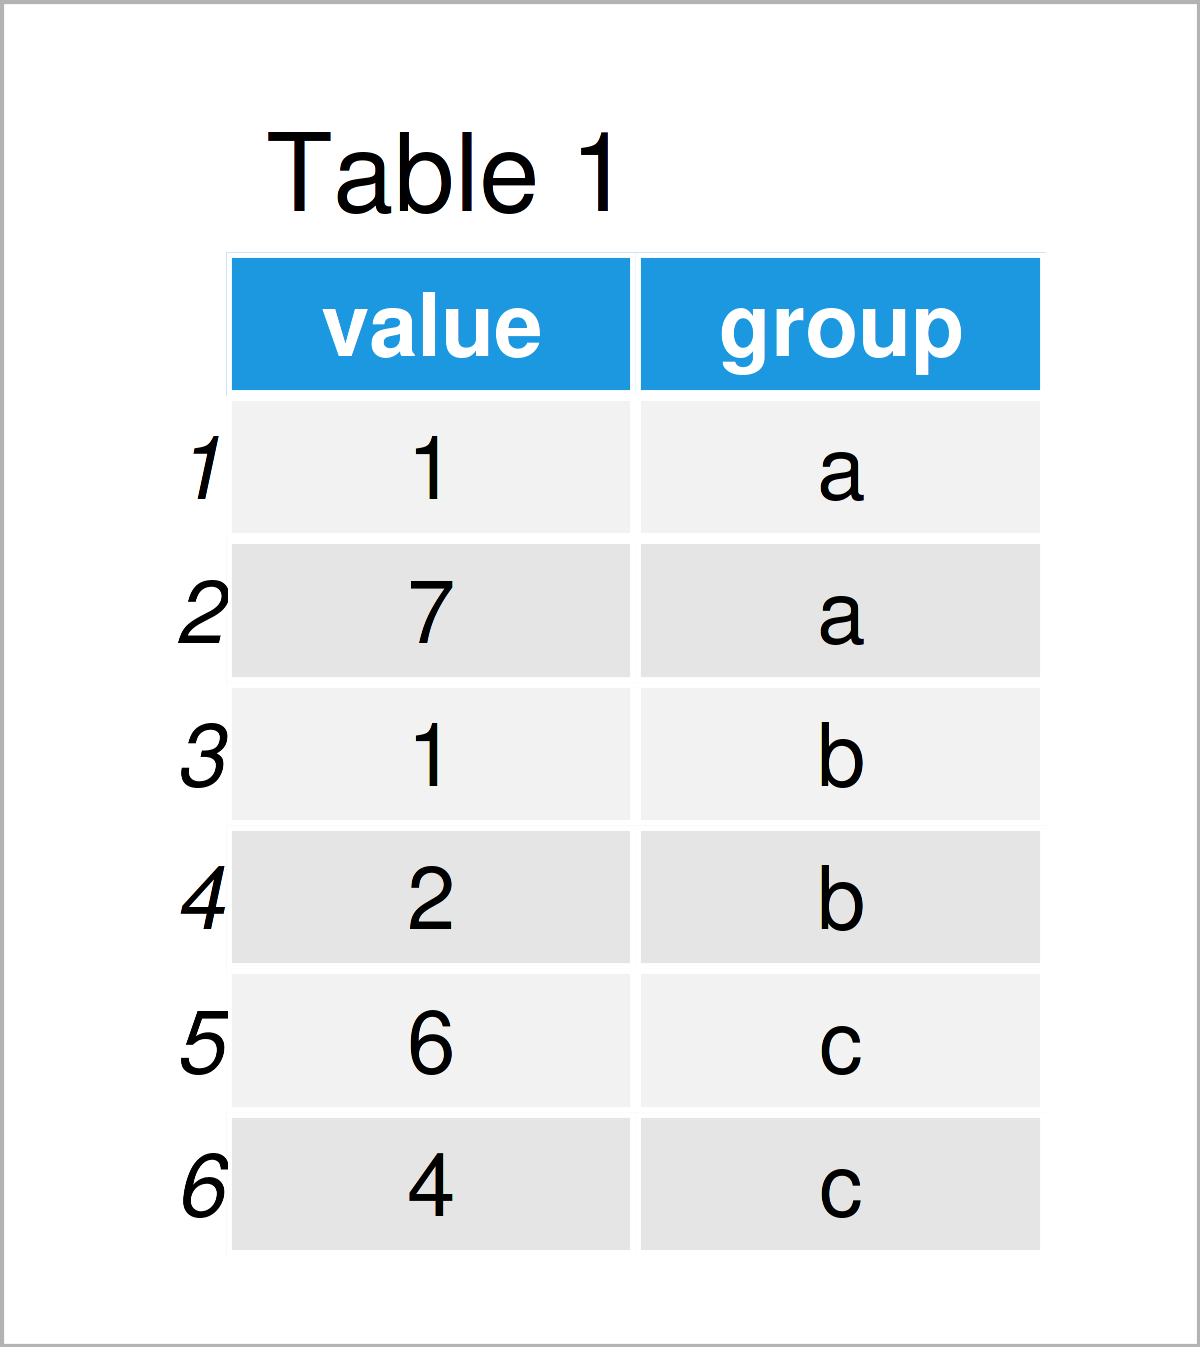
By running the previous R programming code, we have created Table 1, i.e. a data frame containing a value and a group column.
Next, we can apply the reorder function in combination with the with() an median functions to reorder the groups in our data frame according to the median values in each group:
group_reorder <- with(data,                        # Reorder groups by median
                      reorder(group,
                              value,
                              median))
group_reorder                                      # Print output of reorder function
# [1] a a b b c c
# attr(,"scores")
#   a   b   c
# 4.0 1.5 5.0
# Levels: b a c
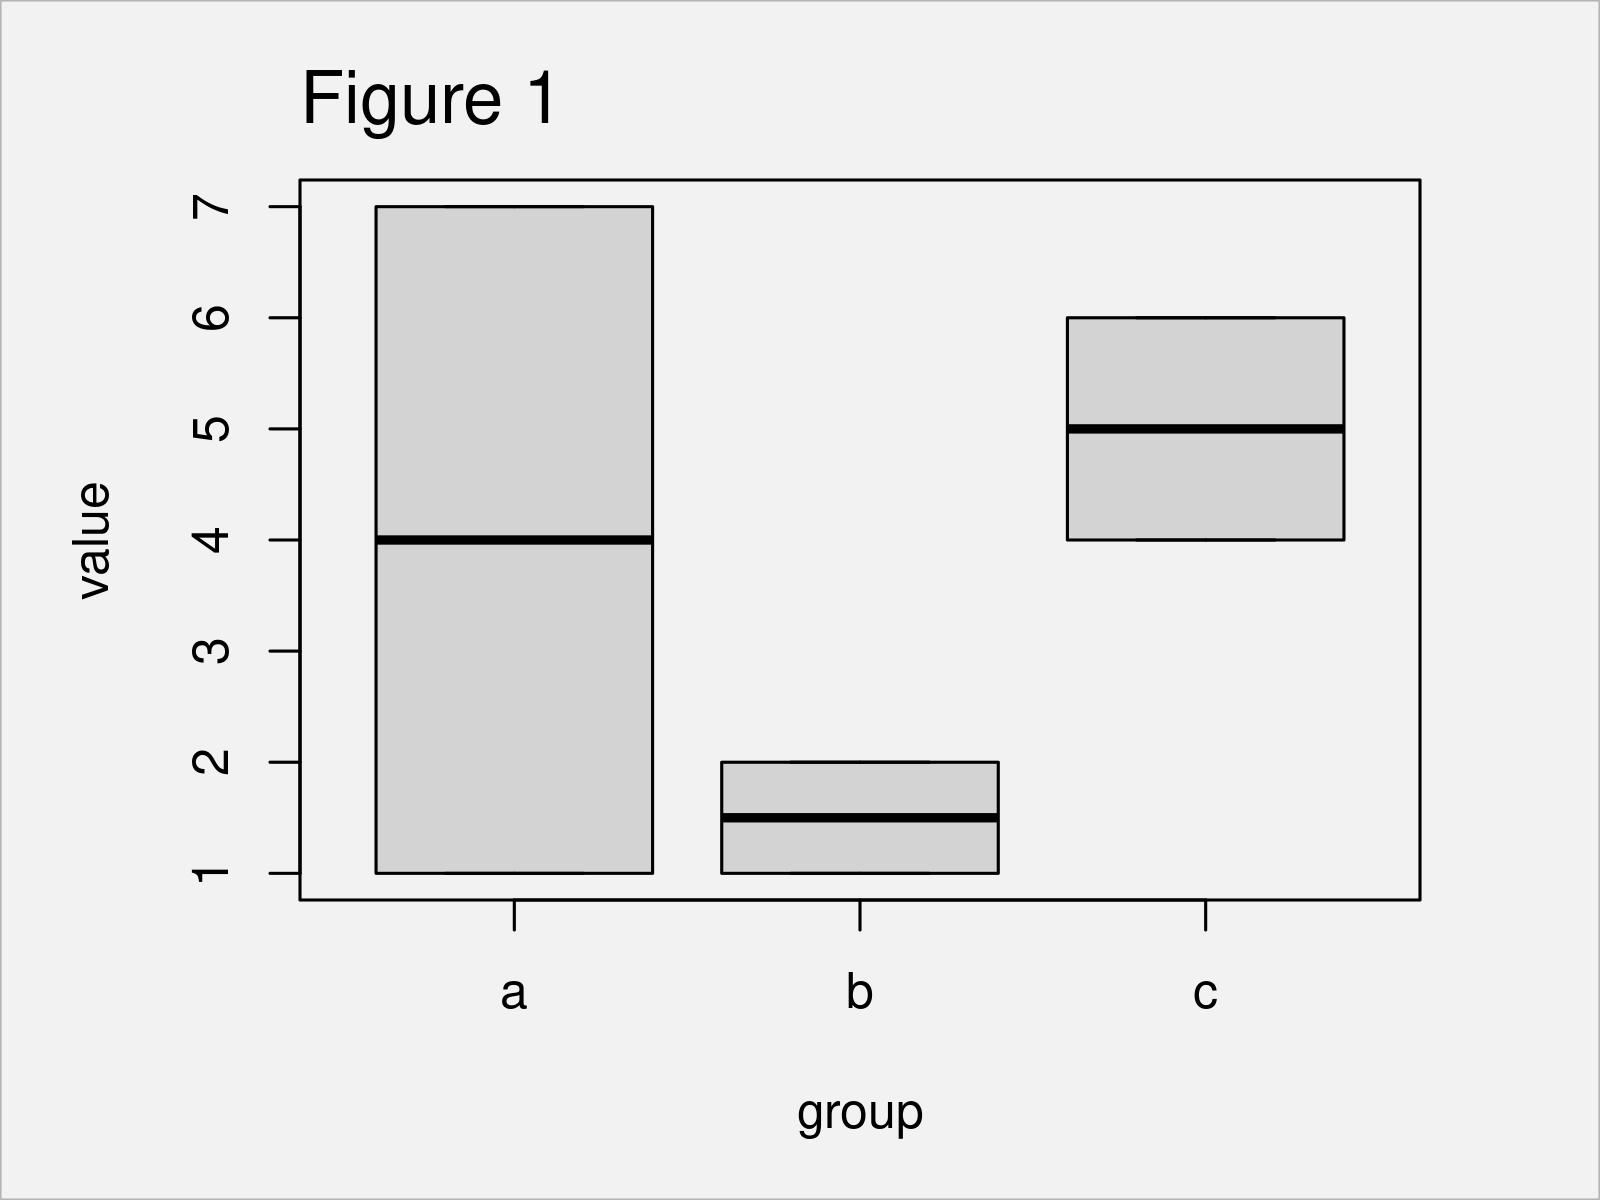
Let’s draw a boxplot with default ordering first:
boxplot(value ~ group, data) # Draw boxplot with default ordering

As shown in Figure 1, we have created a Base R boxplot with default ordering of the boxes using the previously shown syntax.
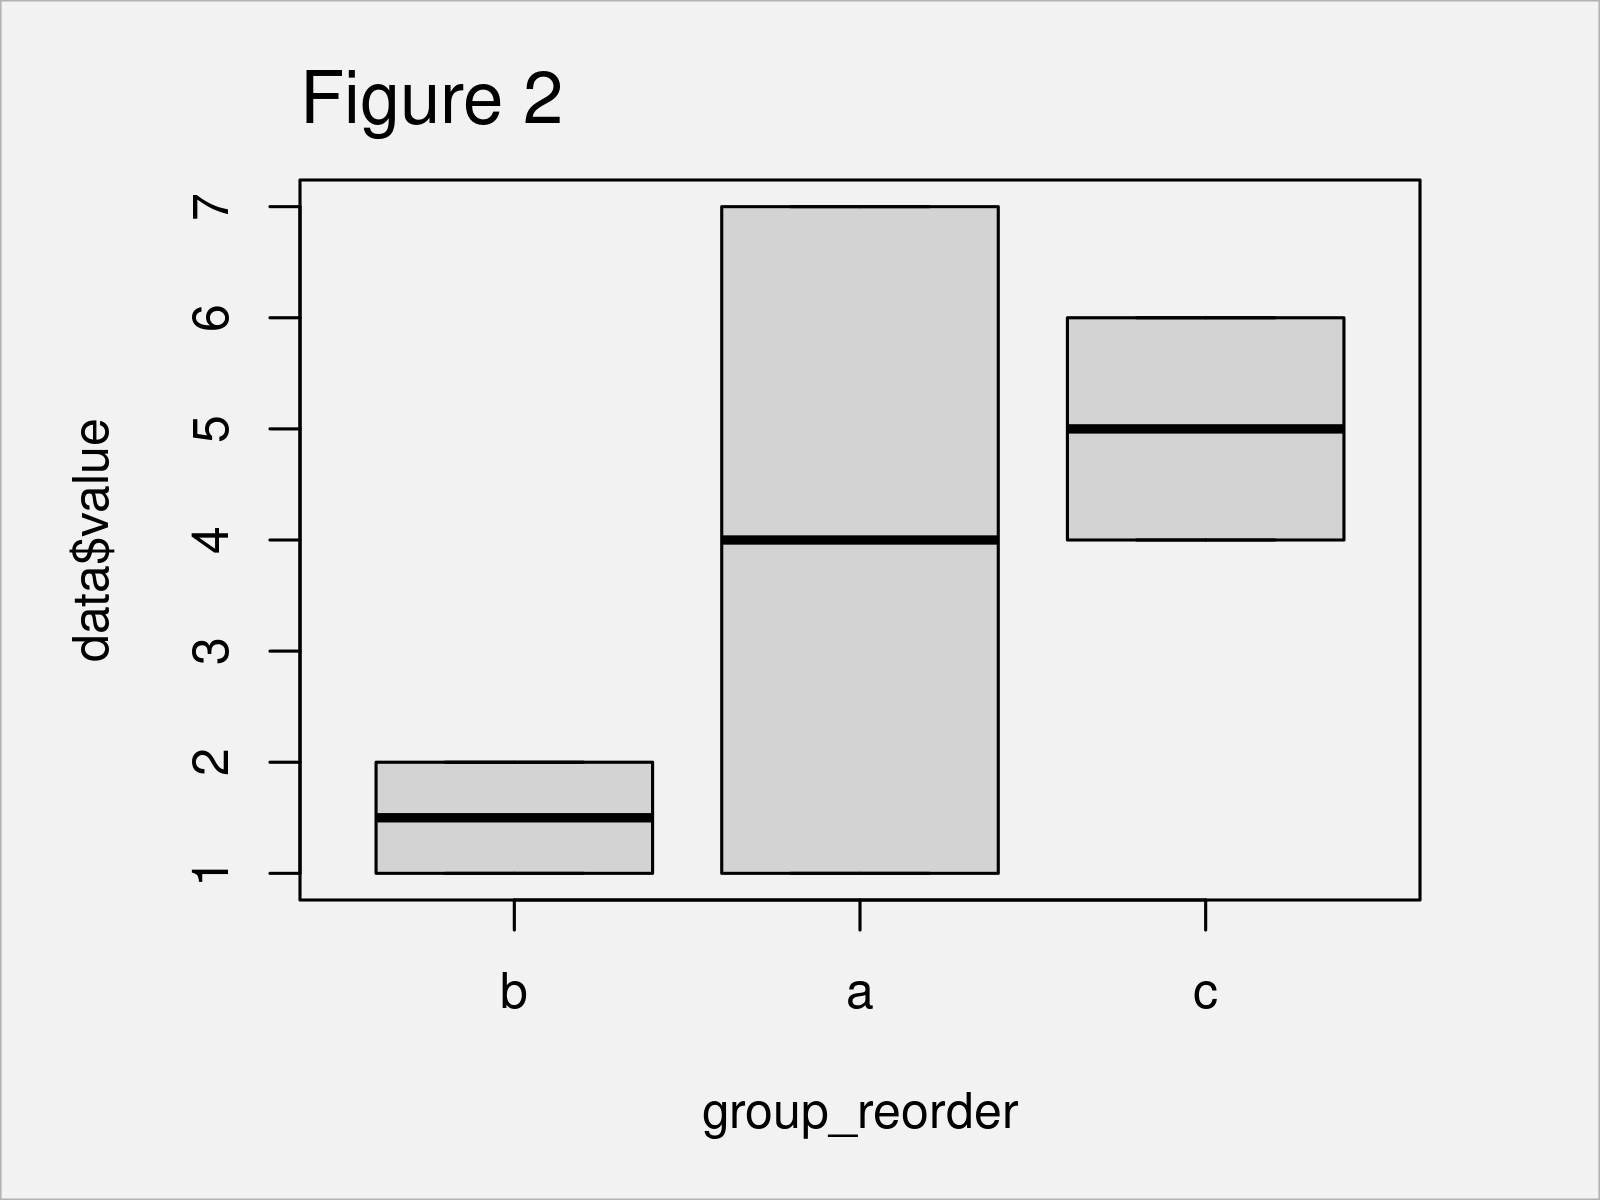
We might now change the ordering of our boxes according to the median values using the group_order object that we have created before:
boxplot(data$value ~ group_reorder) # Draw reordered boxplot

The output of the previously shown R code is shown in Figure 2: A boxplot sorted by the median.
Video, Further Resources & Summary
Have a look at the following video on my YouTube channel. I show the R programming codes of this article in the video instruction:
In addition to the video, you might have a look at the related articles on this website. A selection of articles is listed below.
- Convert & Create Ordered Factor in R
- Change Drawing Order of Points in ggplot2 Plot
- Order Data Frame Rows According to Vector
- Randomly Reorder Data Frame by Row and Column
- List of R Functions
- All R Programming Tutorials
In summary: At this point you should know how to apply the reorder function in R. In case you have further questions, don’t hesitate to let me know in the comments section. Furthermore, don’t forget to subscribe to my email newsletter for updates on new tutorials.


