Remove Outliers from Data Set in R (Example)
In this article you’ll learn how to delete outlier values from a data vector in the R programming language.
Table of contents:
Let’s dive into it.
Creation of Example Data
Have a look at the following example data:
set.seed(937573)                               # Create randomly distributed data
x <- rnorm(1000)
x[1:5] <- c(7, 10, - 5, 16, - 23)              # Insert outliers
x                                              # Print data
# [1]   7.000000000  10.000000000  -5.000000000  16.000000000 -23.000000000  -0.413450746   0.801720348 ...
The previous output of the RStudio console shows the structure of our example data – It’s a numeric vector consisting of 1000 values.
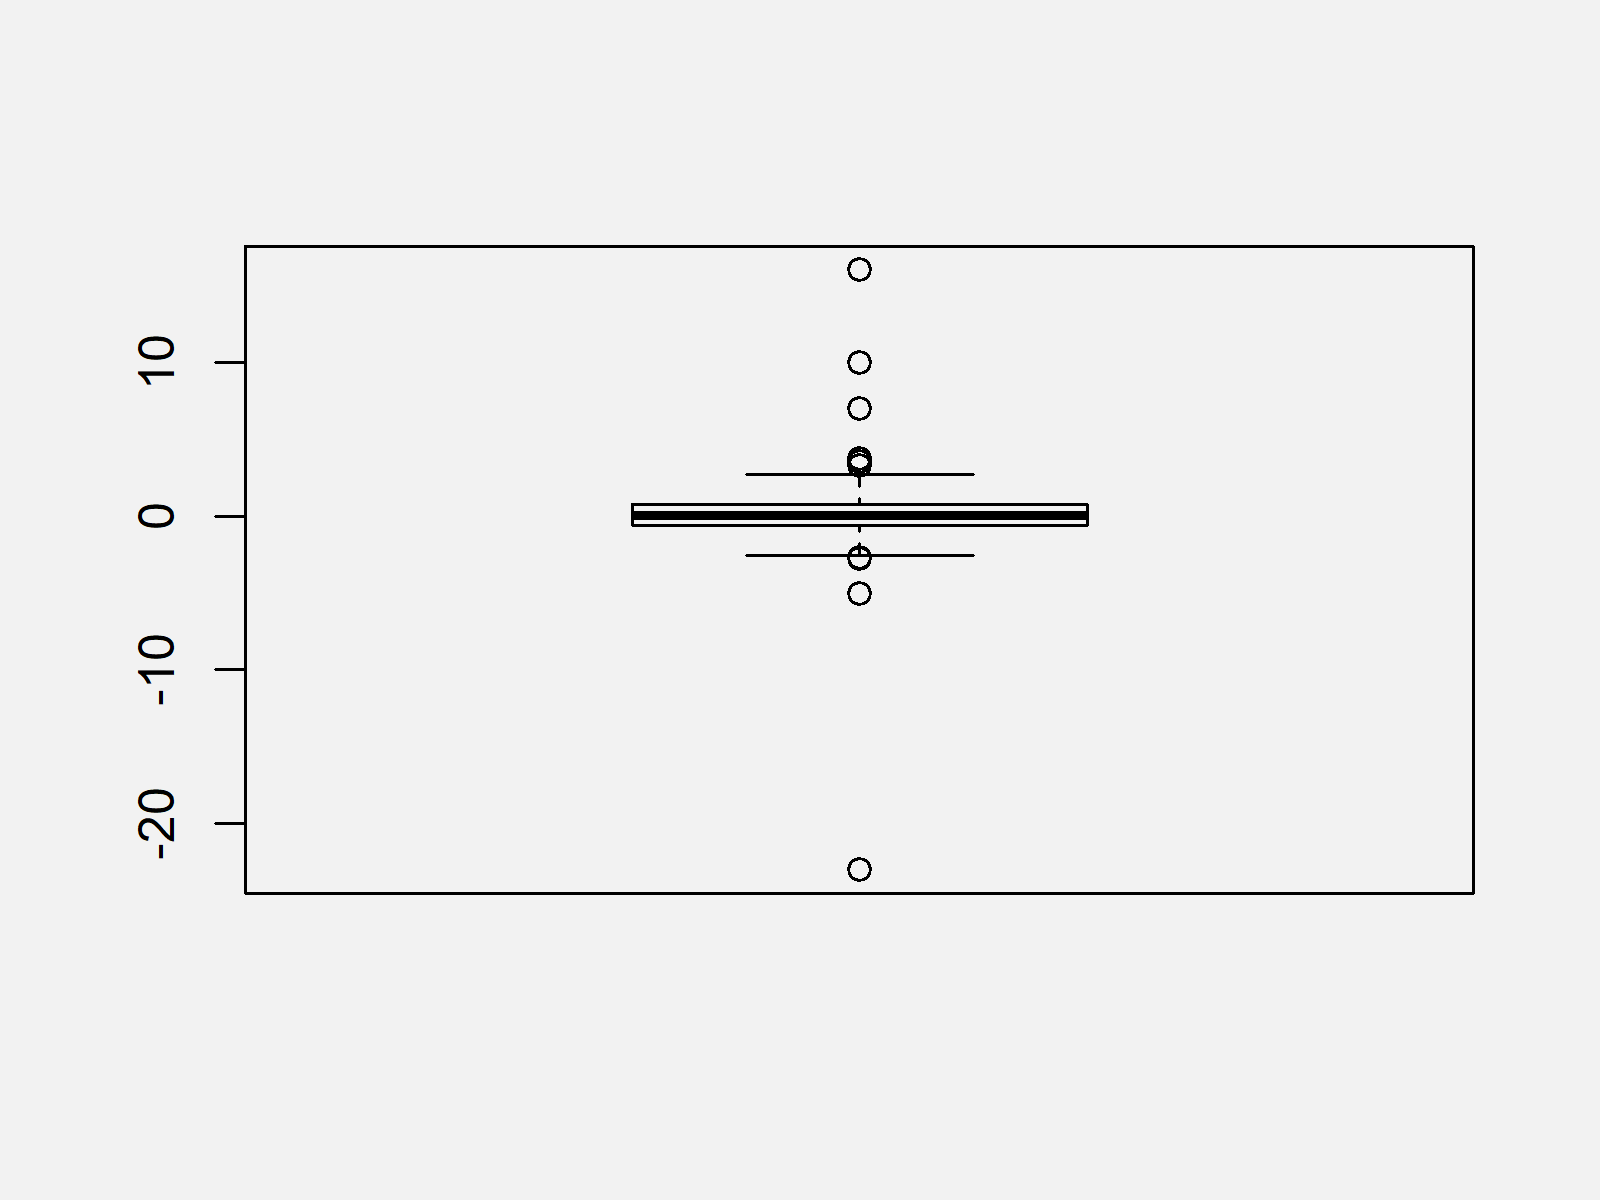
Now, we can draw our data in a boxplot as shown below:
boxplot(x) # Create boxplot of all data

As shown in Figure 1, the previous R programming syntax created a boxplot with outliers.
Example: Removing Outliers Using boxplot.stats() Function in R
In this Section, I’ll illustrate how to identify and delete outliers using the boxplot.stats function in R. The following R code creates a new vector without outliers:
x_out_rm <- x[!x %in% boxplot.stats(x)$out] # Remove outliers
Let’s check how many values we have removed:
length(x) - length(x_out_rm)                   # Count removed observations
# 10
We have removed ten values from our data. Note that we have inserted only five outliers in the data creation process above. In other words: We deleted five values that are no real outliers (more about that below).
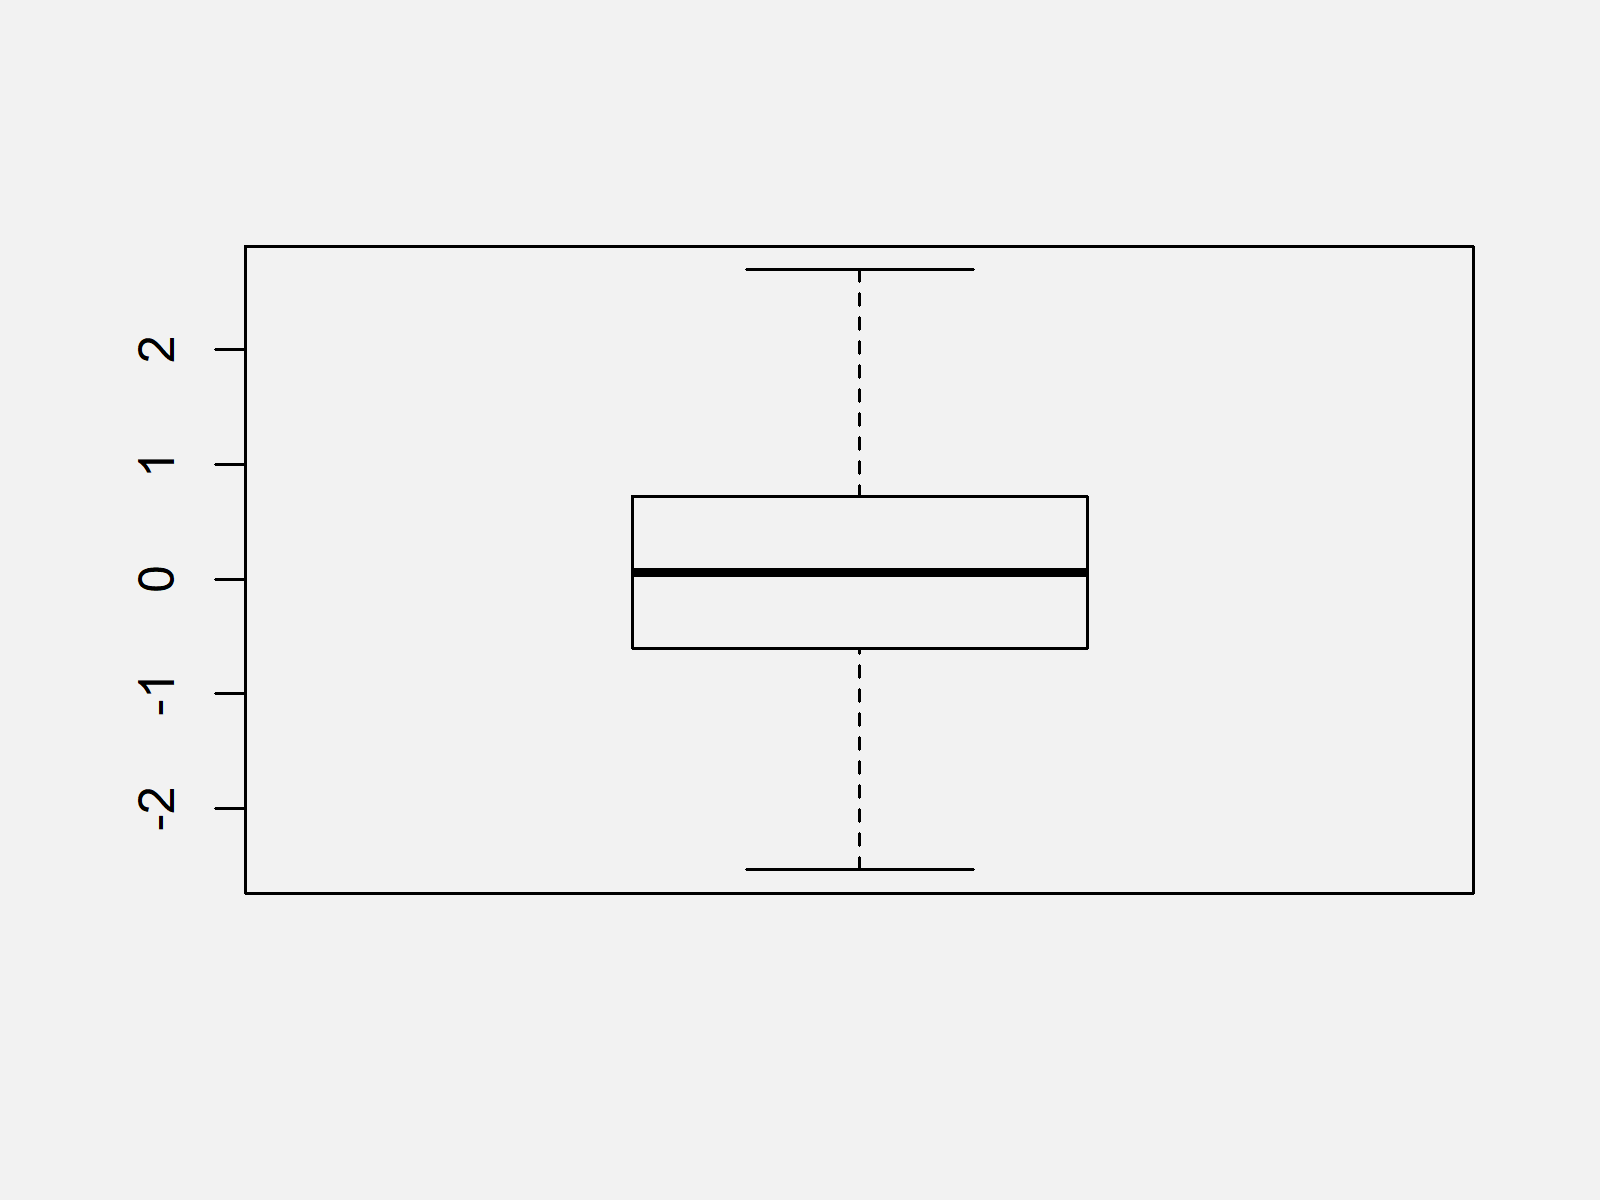
However, now we can draw another boxplot without outliers:
boxplot(x_out_rm) # Create boxplot without outliers

The output of the previous R code is shown in Figure 2 – A boxplot that ignores outliers.
Important note: Outlier deletion is a very controversial topic in statistics theory. Any removal of outliers might delete valid values, which might lead to bias in the analysis of a data set.
Furthermore, I have shown you a very simple technique for the detection of outliers in R using the boxplot function (have a look at the documentation of boxplots.stats for more details). However, there exist much more advanced techniques such as machine learning based anomaly detection.
I strongly recommend having a look at the outlier detection literature (e.g. this article) to make sure that you are not removing the wrong values from your data set.
Video, Further Resources & Summary
I have recently published a video on my YouTube channel, which explains the topics of this tutorial. You can find the video below.
Furthermore, you may read the related tutorials on this website.
- Remove Duplicated Rows from Data Frame in R
- Ignore Outliers in ggplot2 Boxplot in R
- Create a Box-and-Whisker Plot
- R Programming Examples
This tutorial showed how to detect and remove outliers in the R programming language. Please let me know in the comments below, in case you have additional questions.


2 Comments. Leave new
Why criteria does boxplot.stats use to determine outliers? Thank you!
Hi Danielle!
The boxplot.stats() function computes the interquartile ranges. The attribute of boxplot.stats$out will return the values of the data points that are considered outliers based on the computed interquartile range. FYI: Any data points that fall below the first quartile minus 1.5 times the IQR (the lower fence), or above the third quartile plus 1.5 times the IQR (the upper fence), are considered outliers.
Regards,
Cansu