Read All Worksheets of Excel File into List in R (Example)
In this tutorial, I’ll illustrate how to import all sheets of an Excel file to a list in R.
The tutorial will consist of this:
Here’s how to do it…
Example Data & Packages
As the first step, we have to construct an example Excel file with multiple worksheets. For this, we have to install and load the xlsx package:
install.packages("xlsx")                               # Install xlsx package
library("xlsx")                                        # Load xlsx package
Next, we can create an Excel file with three sheets using the following R syntax:
write.xlsx2(iris, "data_all.xlsx", row.names = FALSE)  # Create Excel file with multiple sheets
# [1] "Sheet1" "Sheet2" "Sheet3"
write.xlsx2(mtcars, "data_all.xlsx", row.names = FALSE, append = TRUE, sheetName = "Sheet2")
write.xlsx2(beaver1, "data_all.xlsx", row.names = FALSE, append = TRUE, sheetName = "Sheet3")

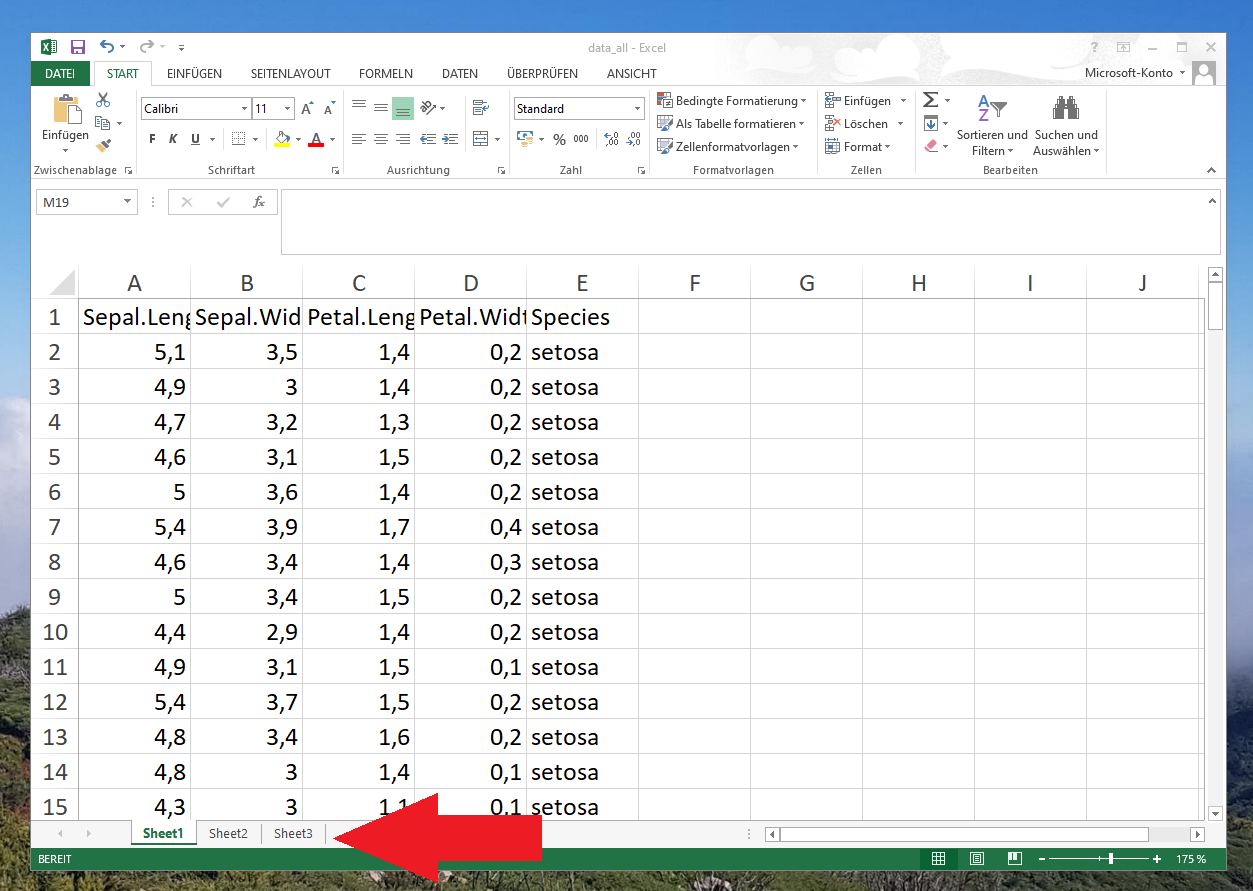
Have a look at the previous screenshot. It shows that the example Excel file has three different worksheets.
Example: Importing All Sheets of Excel File Using readxl Package
The following R syntax explains how to import all sheets of our Excel file into a list in R.
First, we have to install and load the readxl package:
install.packages("readxl")                             # Install & load readxl package
library("readxl")
Next, we can use the excel_sheets function to create a vector containing all sheet names as character strings:
sheet_names <- excel_sheets("data_all.xlsx")           # Get sheet names
sheet_names                                            # Print sheet names
# [1] "Sheet1" "Sheet2" "Sheet3"
As you can see based on the previous output of the RStudio console, our example file has three worksheets named Sheet1, Sheet2, and Sheet3.
In the next step, we can use the lapply, as.data.frame, and read_excel functions to import our data to R:
list_all <- lapply(sheet_names, function(x) {          # Read all sheets to list
  as.data.frame(read_excel("data_all.xlsx", sheet = x)) } )
The previous R code has created a new list object called list_all, which contains all worksheets of our excel file converted as data frame objects.
It makes sense to rename the list elements of our list by the sheet names of our Excel file:
names(list_all) <- sheet_names # Rename list elements
That’s it! Now, we can have a look at each of the elements of our list.
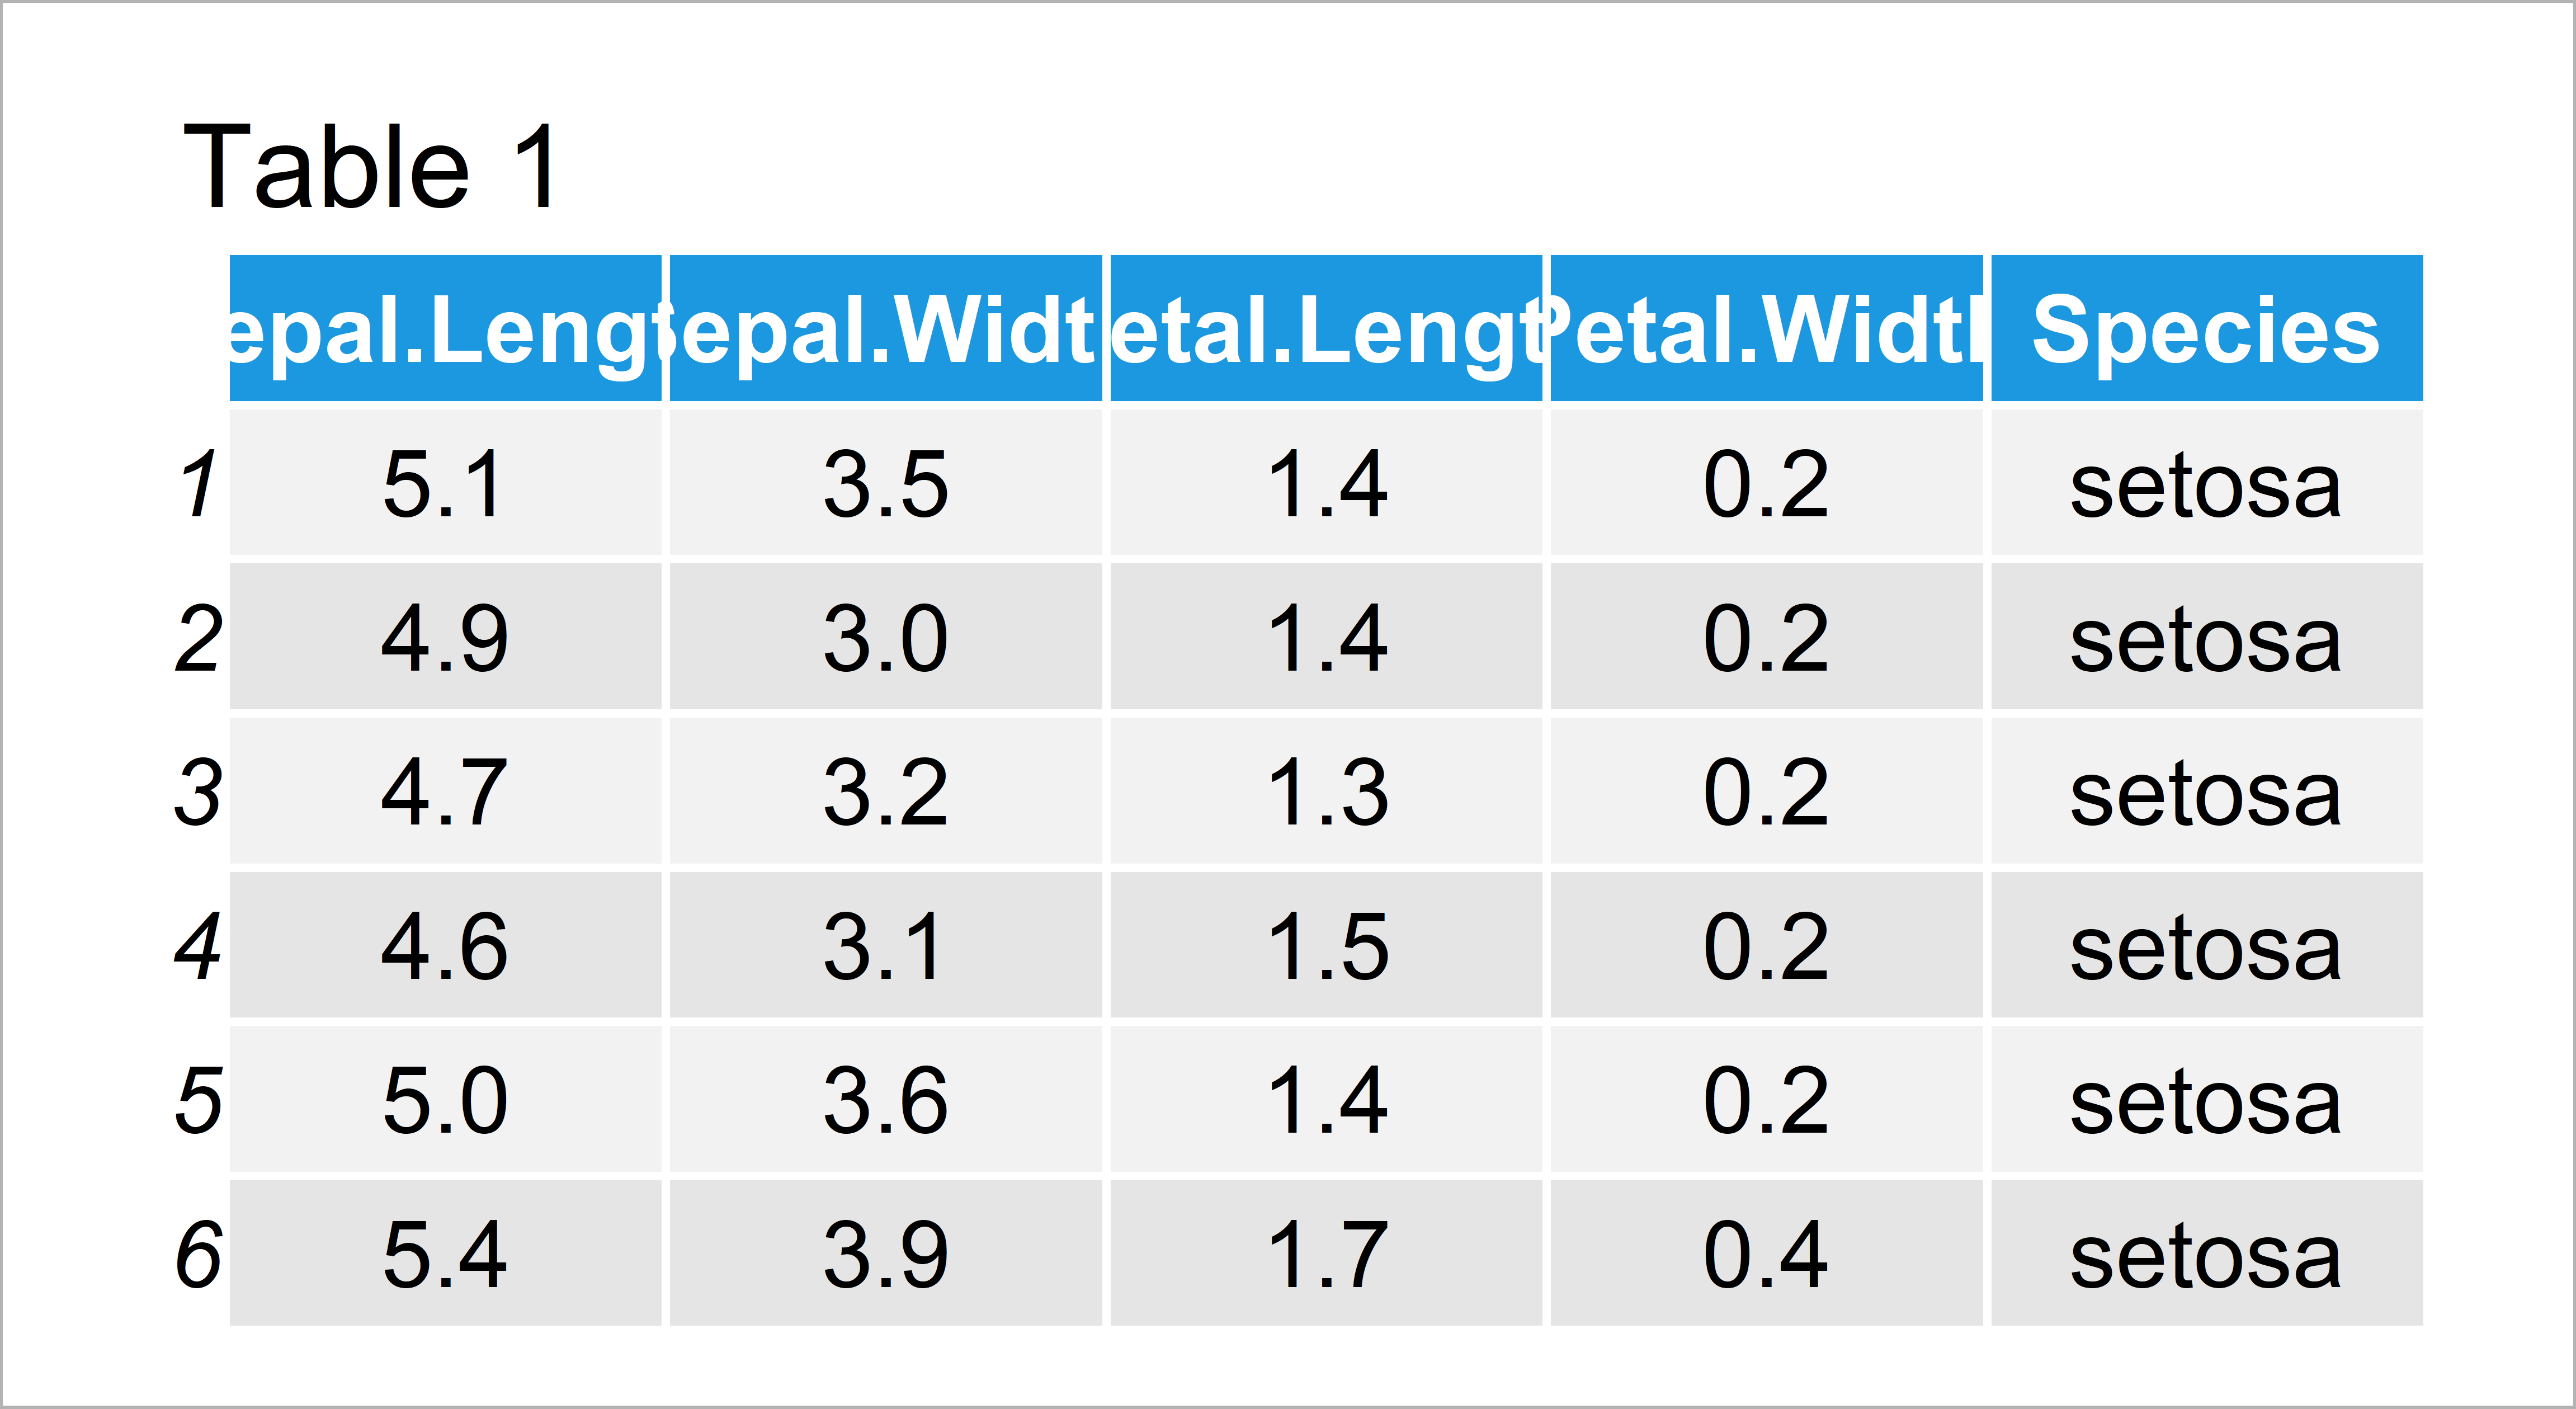
The first six rows of our Sheet1 data look as follows…
head(list_all$Sheet1) # Print head of first sheet

…the head of the second sheet looks as follows…
head(list_all$Sheet2) # Print head of second sheet

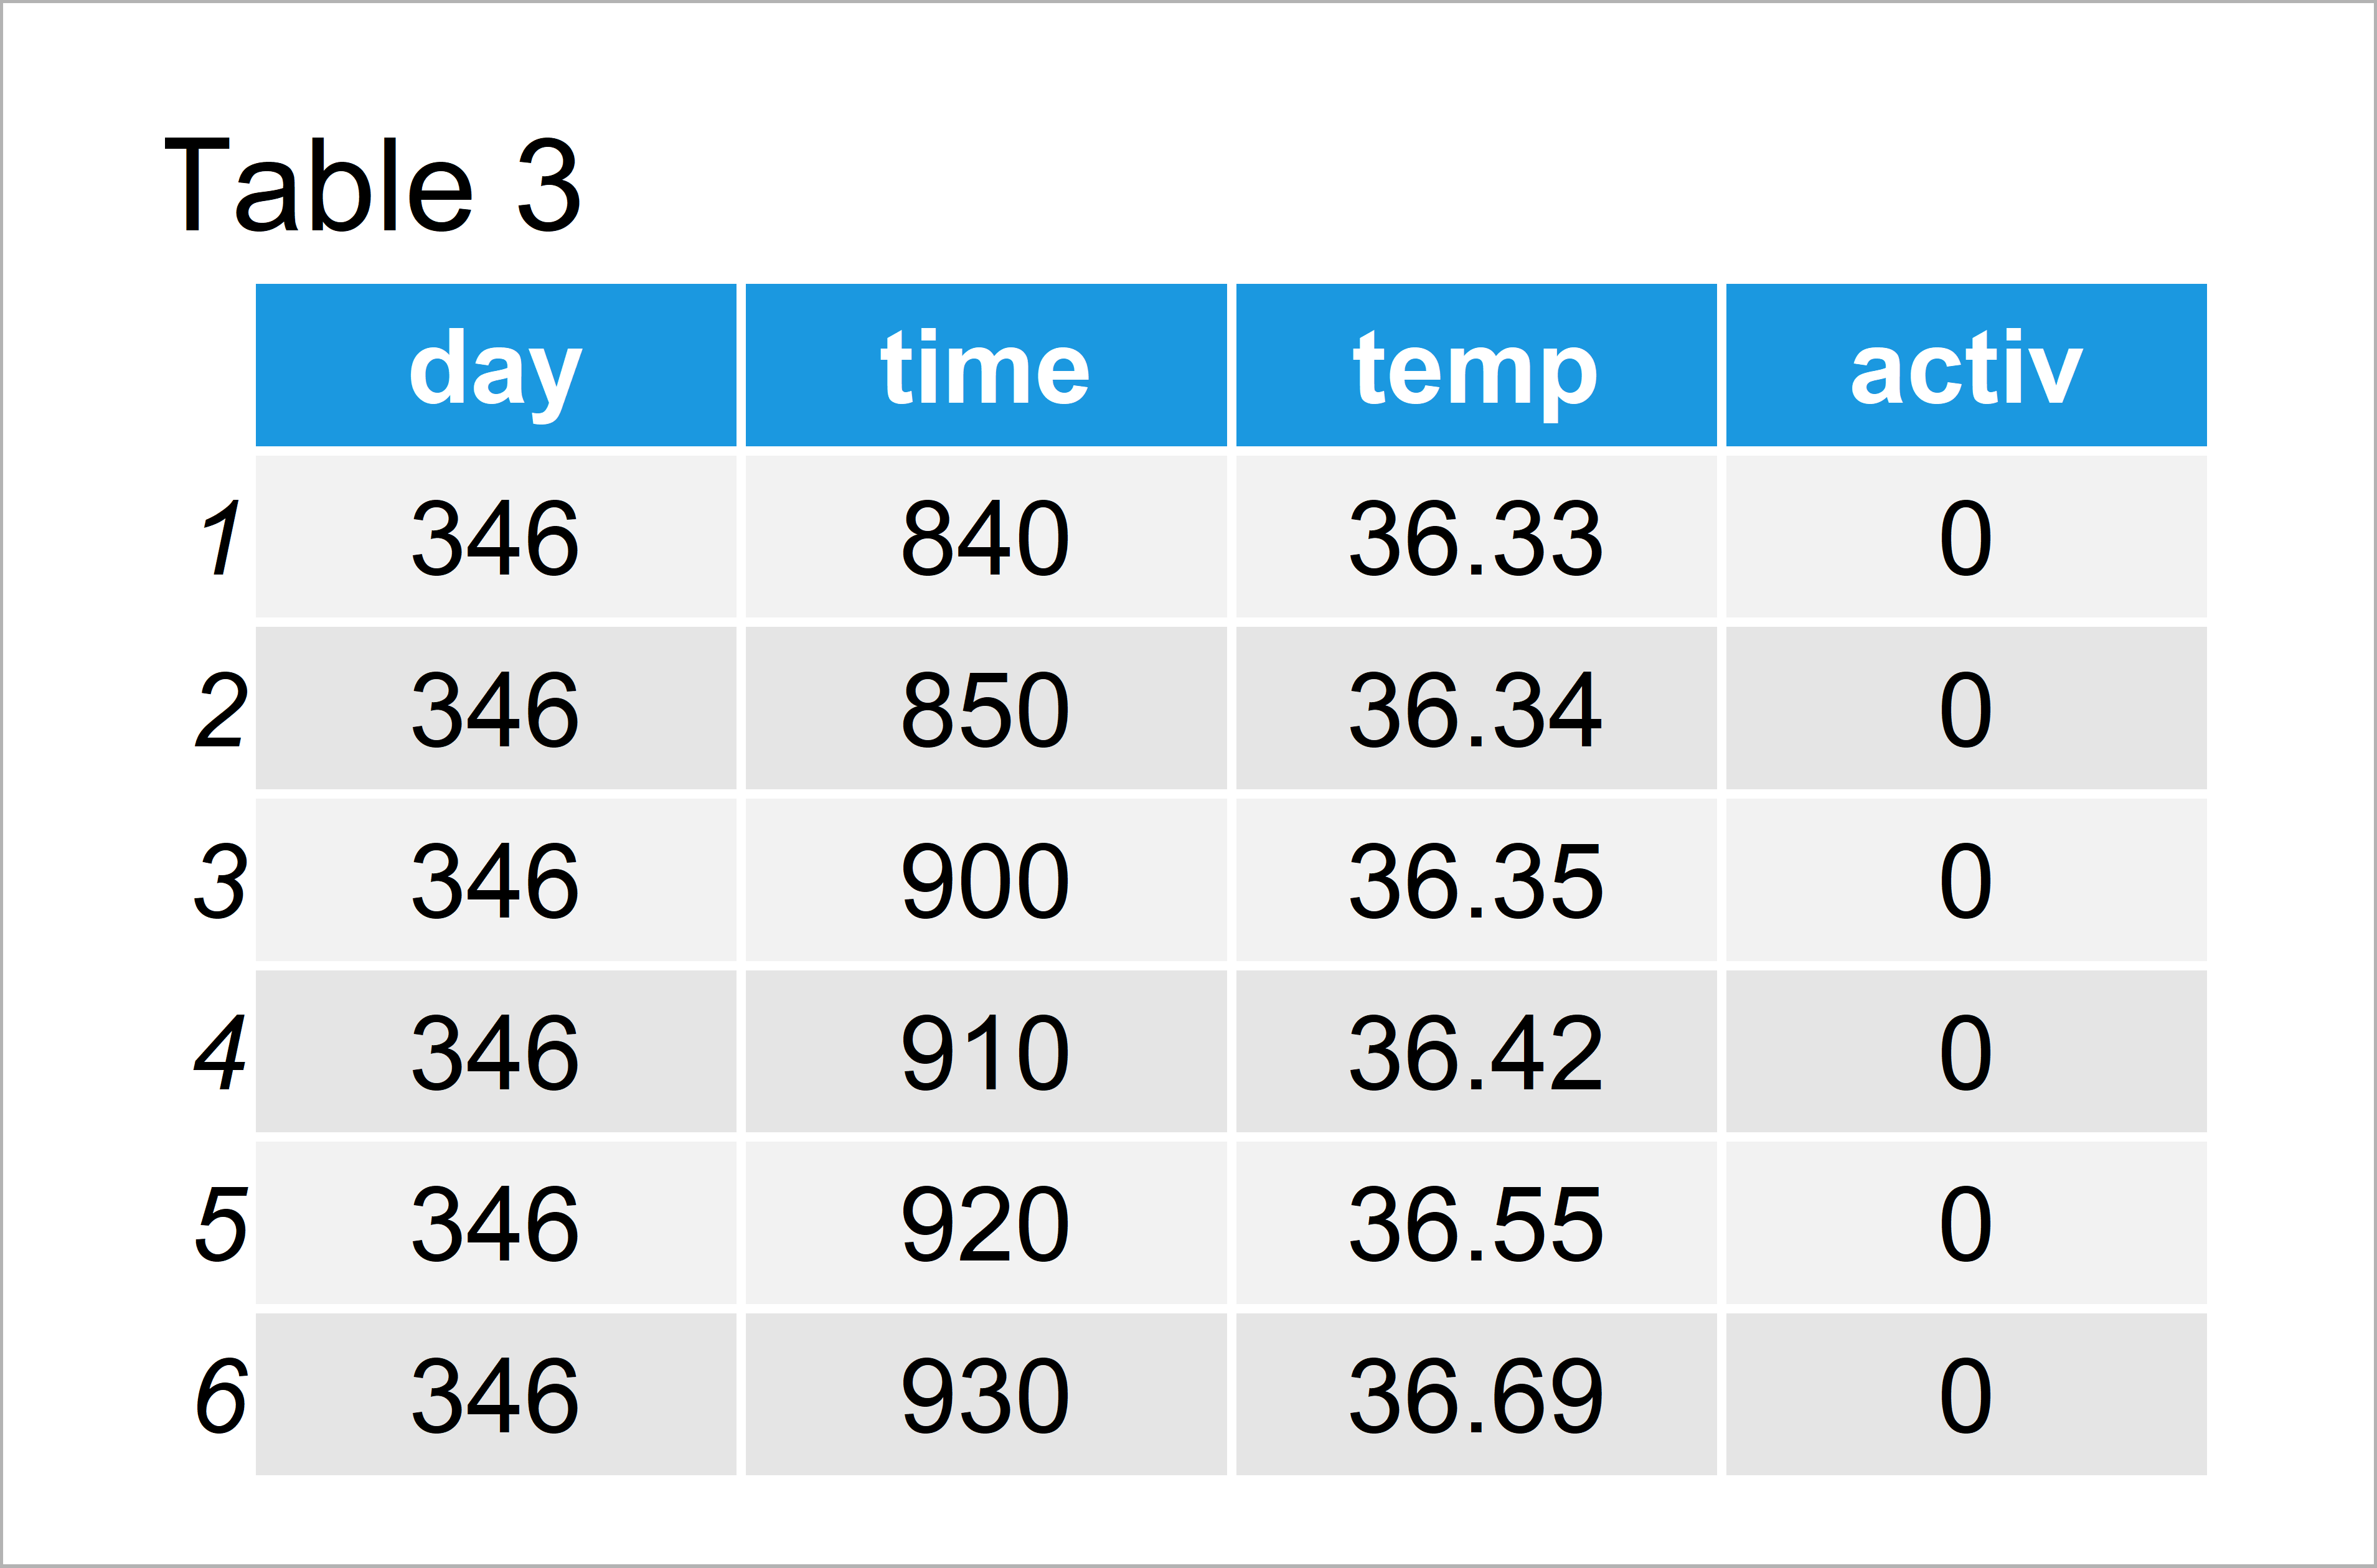
…and the third sheet has the following data structure:
head(list_all$Sheet3) # Print head of third sheet

Looks good!
Video, Further Resources & Summary
Some time ago I have published a video on my YouTube channel, which explains the R code of this tutorial. You can find the video below:
In addition, you may want to read the other tutorials of this website. Some tutorials are listed below.
- Write xlsx & xls in R
- Read Fixed Width Text File in R
- scan Function (5 Example Codes)
- Read xlsx & xls Excel File in R
- R Programming Examples
In this article you have learned how to create a list of data frames based on an Excel file in R programming. Please tell me about it in the comments section, if you have further questions.


17 Comments. Leave new
Thanks for this. If I want all the data from all three sheets in one dataframe with the Sheet names to showing as a new column how do I do that?
Hey Moavu,
You are very welcome!
I just came back from vacation. Do you still need help with your question?
Regards,
Joachim
Hi Joachim, Indeed I do. Here is the Scenario: I have 36 tabs which are named Jan20 – Dec22. I want to extract all the data in the tab into R and use the tab (sheet names) as the date column in the R data frame. There is no date field in the data apart from the tab/ sheet names.
The data columns are the same for all tabs.
I managed to use this code to achieve it:
Baselevel_Expense_Tbl %
mutate(sheet_contents =
map(sheet, function(sheet) {
read_excel(“file.xlsx”.xlsx”,
sheet = sheet)})) %>%
unnest(sheet_contents)
However something strange happened, R shows NAs for one of the columns of for all sheets except Jan20,Jan21 and Jan22 where it pulls all the data as in the excel sheets. For example for February20 the USD column is pulling NAs but the EUR and GBP columns are pulling through the expected values.
My email is kengjisu@duck.com if you want to reachout for a clearer explanation.
Thanks
Hey Moavu,
Thank you for the clarifications. Are there any warnings or error messages when you run your code?
Regards,
Joachim
Hi Joachim, when I upload and unnest the file I get no errors.
One guess would be that the data is formatted differently in Jan20-Jan22 compared to February20.
What happens if you only import February20? Is the data formatted properly in this case?
Regards,
Joachim
So there are 274 columns in each sheet. USD is the 5th column in each of the sheets. The data from all columns in the Jan20, Jan21 and Jan22 sheets come through. In the other sheets, The data in the USD(5th column) is read through as NAs but all the other data on the remaining columns come through.
The formats are all the same.
Could you please try to import the February20 data set as a separate data.frame without combining it with the other data? Is the data imported properly in this case?
Regards,
Joachim
I have deleted the Jan20, Jan21,Jan22 sheets and now Feb20 USD column is pulling through the figures but NAs are being pulled in for the other moths in the USD columns though the other currencies are coming through correctly.
Hi Joachim, I think I figured it out:
read_excel(“Month End TopRevenue PMR.xlsx”,trim_ws = TRUE,col_types = “text”,skip = 3,n_max = 1000,
sheet = sheet)}))
col_types =”text”. For some reason R was not recognizing the format of the USD column so returning NAs
Hey Moavu,
This is great to hear, glad you found a solution! 🙂
Regards,
Joachim
Hi! I just saw your video on YouTube about How to import data from an Excel file with several sheets.
Do you have another video about what would be the next step if you do not have the same columns in the different Excel sheets?
Of course there should be some relation between them.
Have you written o publish a video about that topic?
By they way, I am a big fan! You always have fantastic material!
We are very grateful!
Hey Illya,
Thank you so much for the very kind feedback, glad you find my videos helpful! 🙂
Regarding your question, you may combine data sets with different column names using the bind_rows function of the dplyr package. Have a look here.
I hope that helps!
Joachim
great code as always. What if i only wanted to import 3 out of 4 sheets into a dataframe.
Hello Lorraine,
I think you can specify the sheet to read initially, like:
Then you can use the lapply function like in the tutorial.
Best,
Cansu
Hi
I found the code “Importing All Sheets of Excel File Using readxl Package” really useful and it worked perfect for me. To take it to the next level, I am trying to import 6 workbooks with multiple sheets in each. I have managed to get all the workbooks into a list (XLdf), but am finding it hard to bind them. I was able to bind the first worksheet of each workbook, but got errors trying to bind all worksheets from al workbooks. The format of all the sheets are the same but some may have some extra rows which may be causing an error. I’d appreciate any advice you can offer. Many thanks.
read_excel_allsheets <- function(filename) {
sheets <- readxl::excel_sheets(filename)
x <- lapply(sheets, function(X) readxl::read_excel(filename, sheet = X))
names(x) <- sheets
x
}
files <- list.files(path = "xdrive etc..",
pattern = "*.xlsx",
full.names = TRUE)
XLdf <- lapply(files, read_excel_allsheets)
big_data <- as.data.table(rbindlist(XLdf, fill=TRUE))
Error in setalloccol(ans) :
Internal error: length of names (0) is not length of dt (42)
In addition: Warning message:
In setDT(ans) :
Some columns are a multi-column type (such as a matrix column): [1, 2, 3, 4, 5, 6, 7, 8, 9, 10, …]. setDT will retain these columns as-is but subsequent operations like grouping and joining may fail. Please consider as.data.table() instead which will create a new column for each embedded column.
Hello Lorraine,
Here are a few steps and suggestions to resolve this issue:
Check Column Consistency: Ensure that all sheets across all workbooks have the same column structure. Differences in column names or order can cause issues during binding. You can write a small piece of code to check the names and number of columns in each sheet to ensure they are consistent.
Handle Different Row Counts: If some sheets have extra rows, it shouldn’t be a problem as long as the column structure is the same. The fill = TRUE argument in rbindlist should take care of differing row counts by filling missing values with NA.
Inspect Data Types: Make sure that corresponding columns across different sheets and workbooks have the same data type. A mismatch in data types can also cause issues during the binding process.
Flatten Multi-Column Types: The warning message indicates that some of your columns are of a multi-column type (like a matrix). You should flatten these columns into standard one-dimensional columns. You can achieve this by converting these multi-column types into separate columns.
Modify the Binding Process: Instead of directly using rbindlist, first convert each dataframe in your list (XLdf) into a data.table and then bind them. This might help in handling complex column types more effectively.
I hope one of these soluşons helps. If you have any further questions, please let me know.
Best,
Cansu