Copy & Paste Data from Clipboard into R (2 Examples)
This page shows how to copy and paste data from the clipboard into the R programming language.
The tutorial will contain two examples:
Please note that in most cases it is better to NOT copy and paste data to import it into R. Usually, functions such as read.table and read.csv should be preferred.
However, in case you are interested to learn more about these topics, keep on reading!
Example 1: Copy & Paste Data From Excel File into R
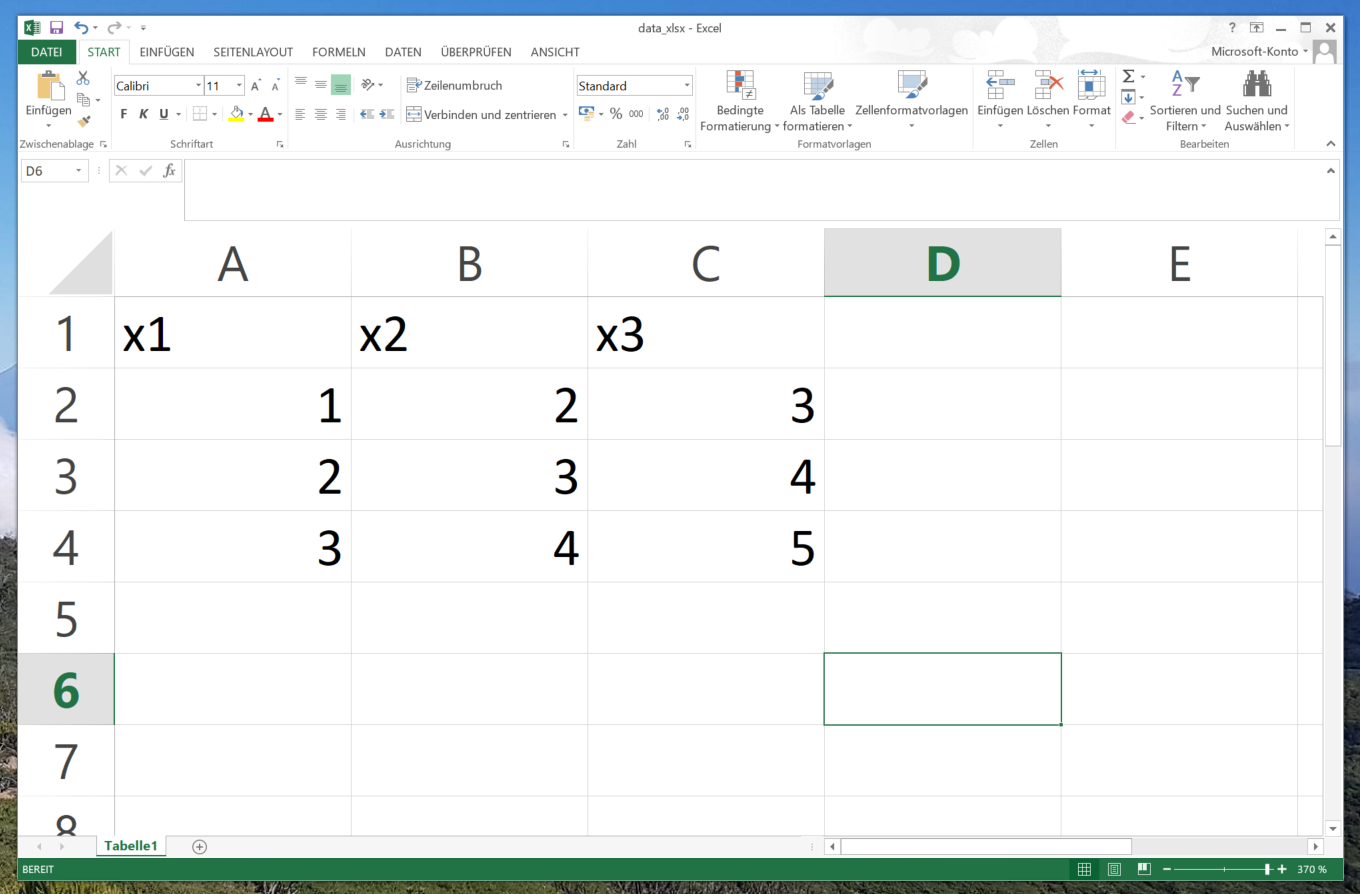
Let’s assume that we have the following XLSX Excel file on our computer:

Now, let’s assume that we want to copy and paste the data in this file to RStudio.
Then, we can use the read.delim function after copying and pasting the data in our file as shown below:
data_excel <- read.delim("clipboard")            # Import data from xlsx file
data_excel                                       # Print data
#   x1 x2 x3
# 1  1  2  3
# 2  2  3  4
# 3  3  4  5
As you can see based on the previous output of the RStudio console, we have created a data frame containing the three rows and columns of our XLSX file.
Example 2: Copy & Paste Data From TXT File into R
It is also possible to copy and paste data stored in a TXT file into R.
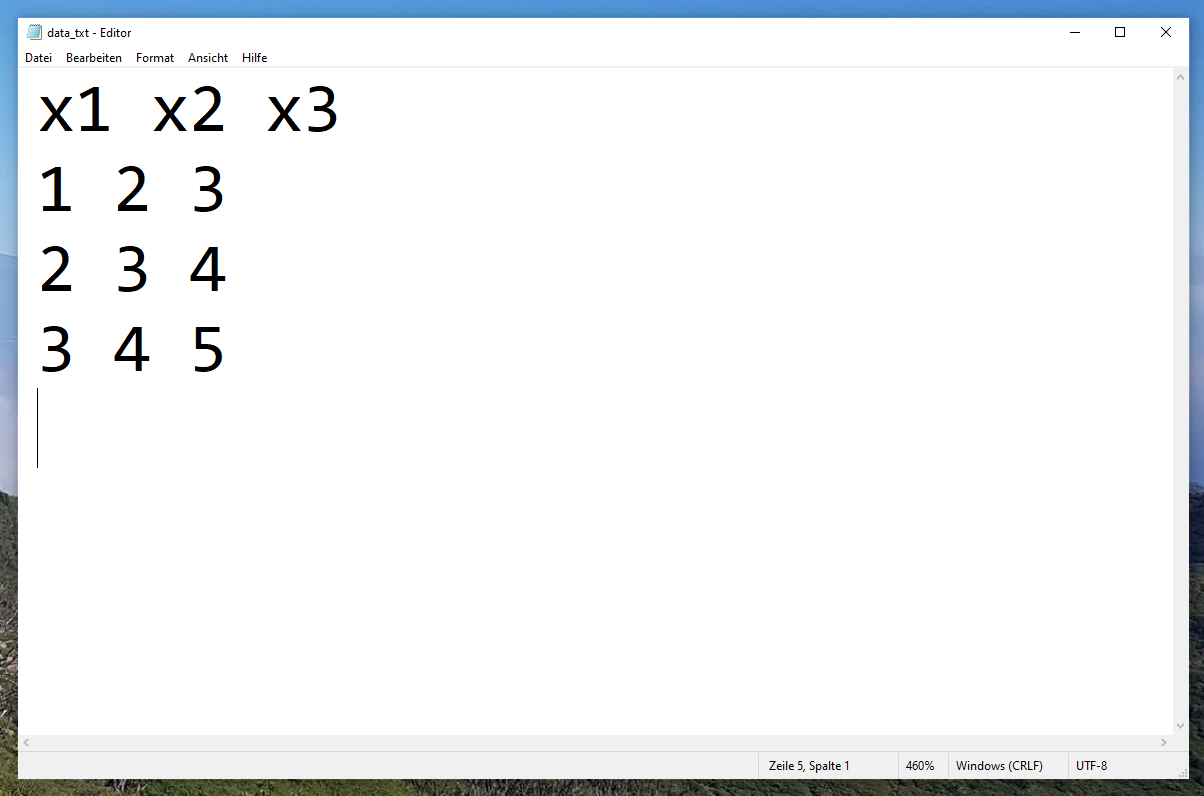
Consider the following text file:

Again, we can use the read.delim function to copy the content of our TXT file into R. Please note that we have to specify the sep argument to be equal to ” “, since our text data is separated by blanks:
data_txt <- read.delim("clipboard", sep = " ")   # Import data from TXT file
data_txt                                         # Print data
#   x1 x2 x3
# 1  1  2  3
# 2  2  3  4
# 3  3  4  5
The previous output is exactly the same as in Example 1. However, this time we have copied the data from a text file instead of an Excel file.
Video, Further Resources & Summary
Check out the following video on my YouTube channel. In the video, I’m explaining the R programming syntax of this tutorial in RStudio:
In addition to that, you may read some of the related tutorials on my website. I have released numerous articles on how to import and export data in R:
- Read All Files in Directory & Apply Function to Each Data Frame
- X. Prefix in Column Names when Reading Data Frame
- readLines, n.readLines & readline in R
- Write Lines of Text to TXT File
- R Programming Overview
In this tutorial you have learned how to draw a grid of Base R, ggplot2, and lattice plots in the R programming language. Let me know in the comments below, in case you have further questions.


