R ggplot2 Warning Message: Removed rows containing non-finite values (2 Examples)
This tutorial illustrates how to deal with the “Warning message: Removed X rows containing non-finite values (stat_bin)” in R.
The article will contain this information:
Let’s dig in:
Example Data & Software Packages
In the first place, we’ll have to create some example data:
set.seed(3956433)             # Create example data
data <- data.frame(x = rnorm(100))
head(data)                    # Head of example data

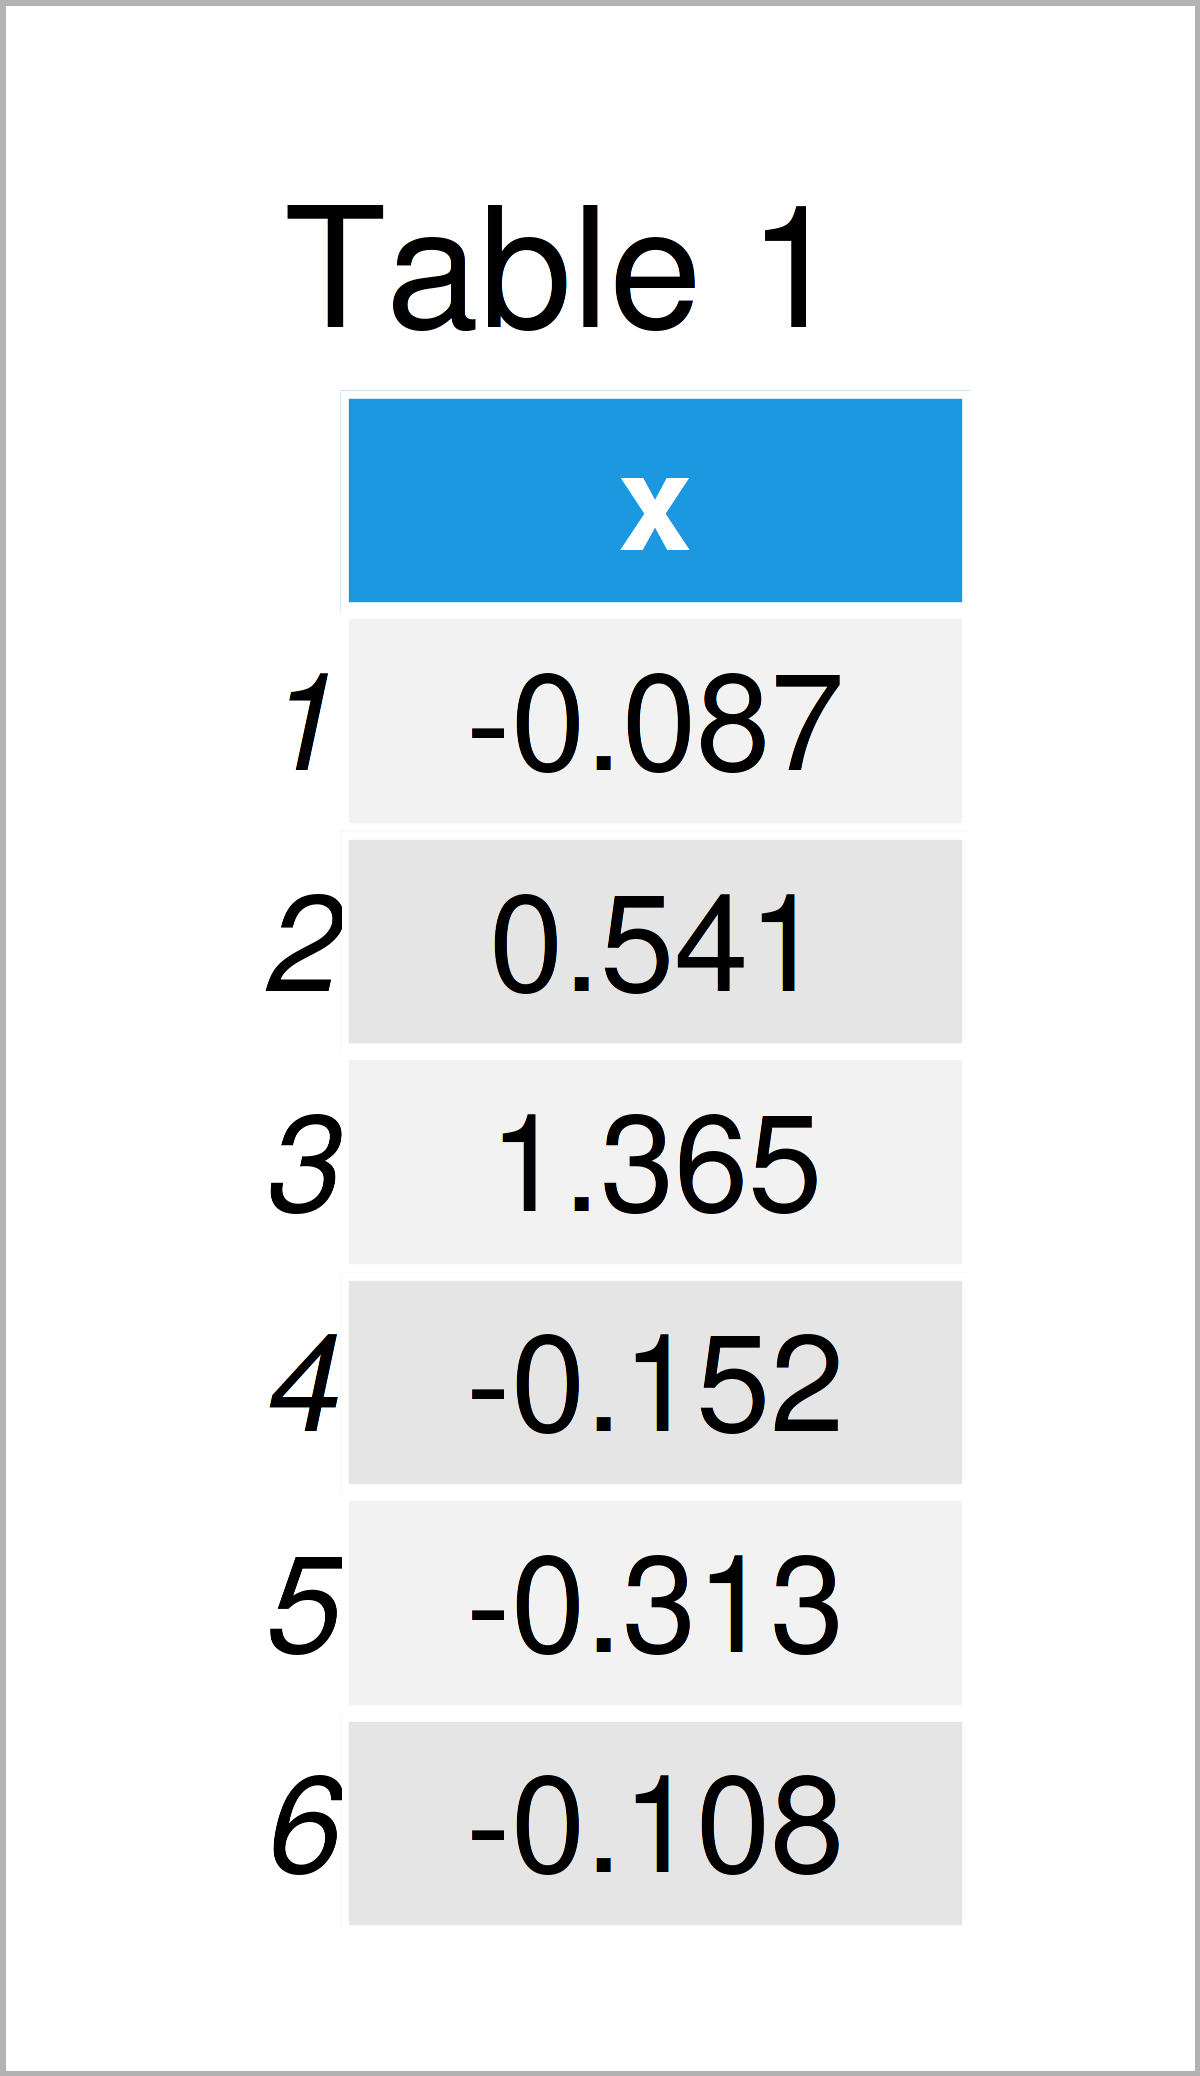
Table 1 shows the first six rows of our example data: it is also visualized that our data is made of one numerical column that is called “x”.
We also have to install and load the ggplot2 package to R, to be able to use the functions that are contained in the package:
install.packages("ggplot2")   # Install & load ggplot2 package
library("ggplot2")
Example 1: Reproduce the ggplot2 Warning Message – Removed X rows containing non-finite values (stat_bin)
Example 1 explains how to replicate the “Warning message: Removed X rows containing non-finite values (stat_bin)”.
Let’s assume that we want to draw a histogram with manually specified limits on the x-axis. Then, we might use the following R code:
ggplot(data, aes(x)) +        # Draw ggplot plot with manual xlim
  geom_histogram() +
  xlim(- 2.5, 1)
# Warning messages:
# 1: Removed 17 rows containing non-finite values (stat_bin).
# 2: Removed 2 rows containing missing values (geom_bar).

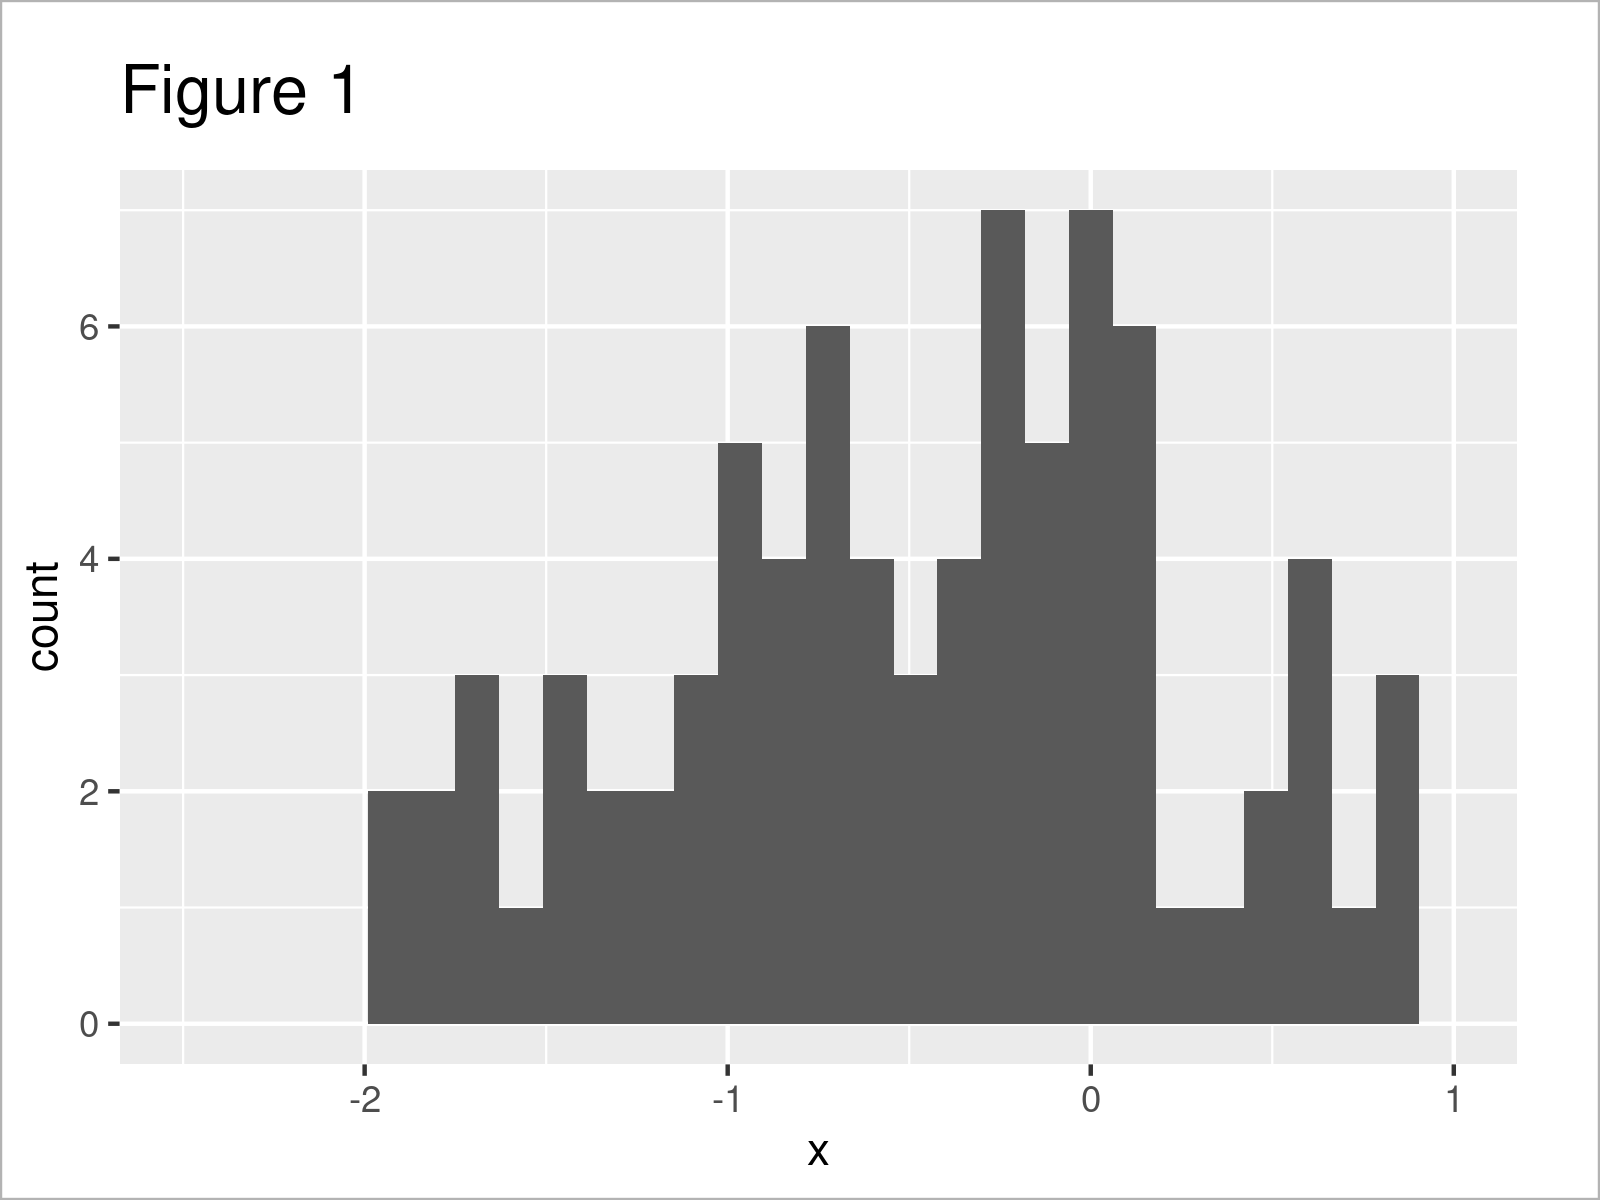
As shown in Figure 1, the previous R code has created a ggplot2 histogram with user-defined x-axis limits.
However, you can also see that the RStudio console has returned the warning message “Removed X rows containing non-finite values (stat_bin)”.
The reason for this is that we have specified axis limits that cut-off some of the values on our data (i.e. some values are larger than 1.0).
Let’s solve this problem…
Example 2: Avoid the ggplot2 Warning Message – Removed X rows containing non-finite values (stat_bin)
The following R programming syntax illustrates how to get rid of the “Warning message: Removed X rows containing non-finite values (stat_bin)”.
For this, we simply have to remove the xlim function from our code:
ggplot(data, aes(x)) +        # Draw ggplot plot with default xlim
  geom_histogram()

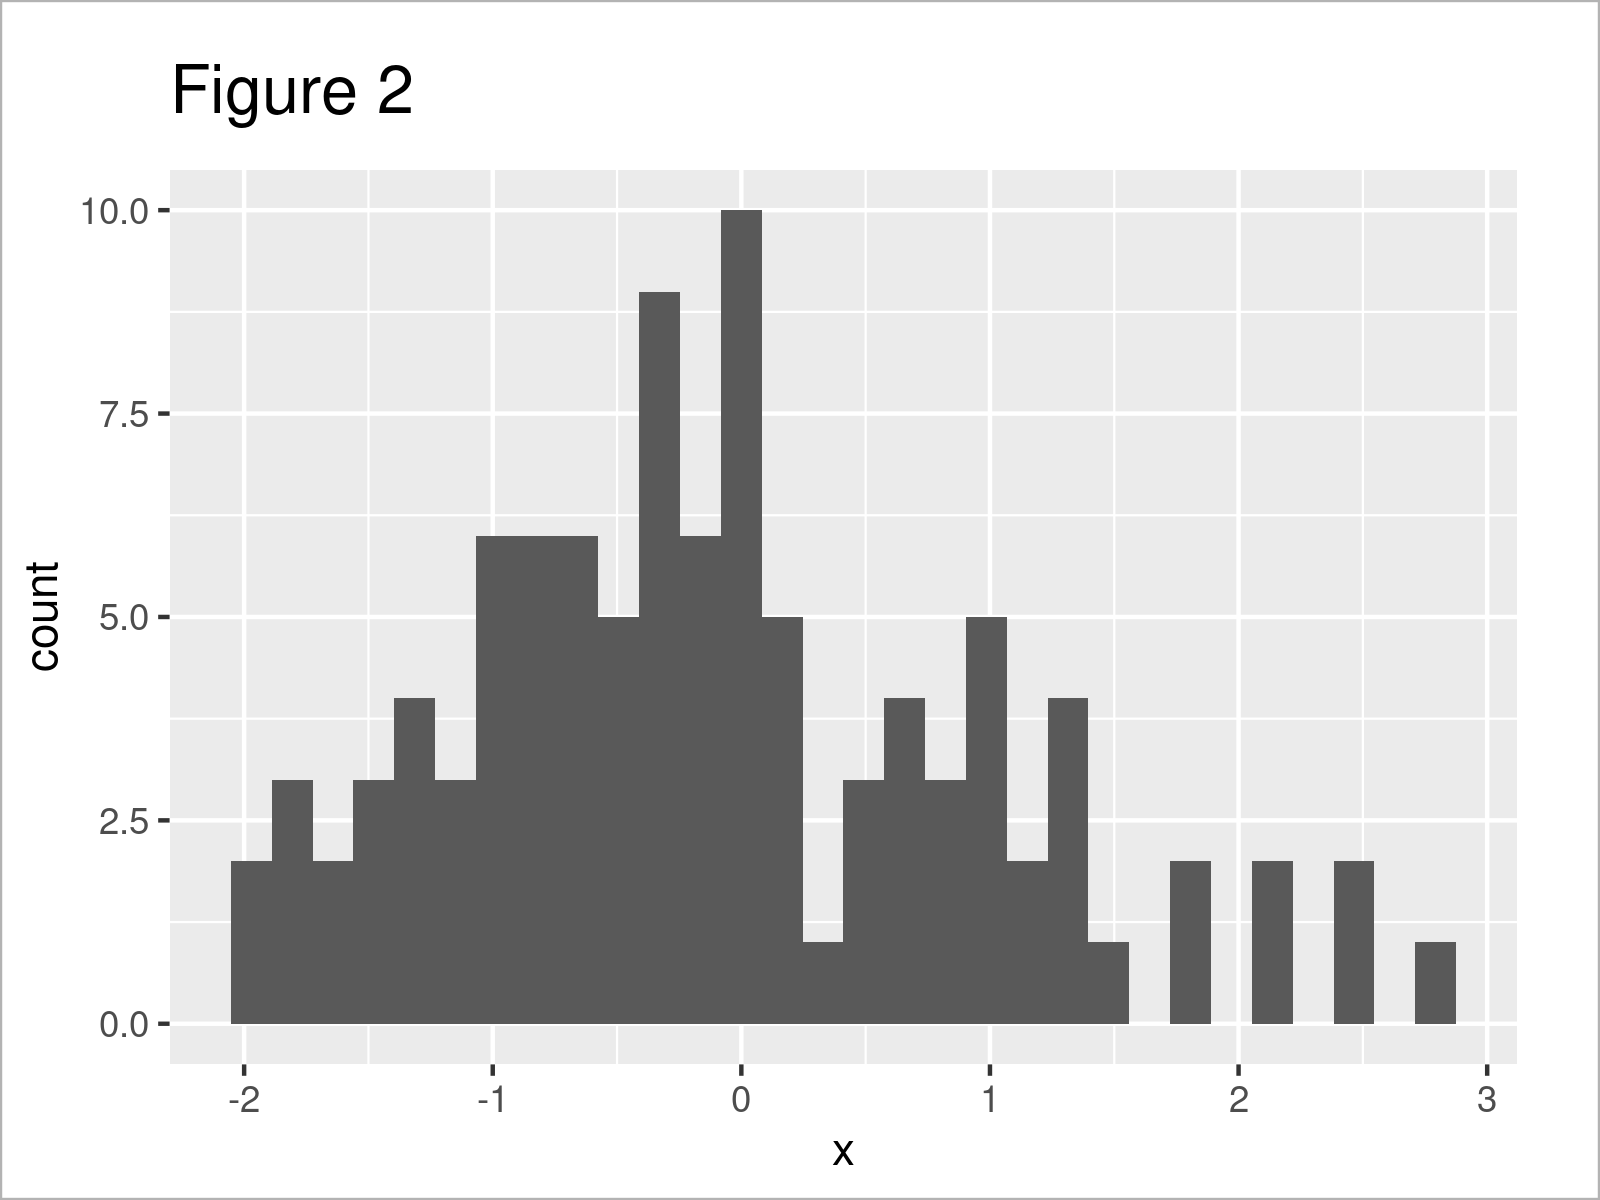
As shown in Figure 2, we have managed to create a ggplot2 histogram without axis limits. No warnings have been returned.
Video, Further Resources & Summary
Do you need further explanations on the examples of this tutorial? Then I can recommend watching the following video on my YouTube channel. I’m showing the topics of this tutorial in the video instruction.
Furthermore, you could read the other tutorials on https://statisticsglobe.com/:
- predict() Warning message: ‘newdata’ had X rows but variables found have Y rows
- Extract Subset of Data Frame Rows Containing NA
- Remove Rows with NaN Values in R
- ggplot2 Warning Message: Removed rows containing missing values in R
- Dealing with Error & Warning Messages in R
- Introduction to R Programming
This tutorial has demonstrated how to handle the “Warning message: Removed X rows containing non-finite values (stat_bin)” in R programming. If you have further questions, please let me know in the comments section below. Furthermore, don’t forget to subscribe to my email newsletter in order to receive regular updates on the newest articles.


2 Comments. Leave new
That’s great but what if I want to set the limits anyways?
Hello Daniela,
If some of your data is left out of the limits, you will get this error, in other words, your data will be removed.
Regards,
Cansu