Move Position of ggplot2 Legend in R (4 Examples)
In this article you’ll learn how to change the position of ggplot2 legends in the R programming language.
Table of contents:
You’re here for the answer, so let’s get straight to the tutorial:
Example Data, Add-On Packages & Basic Graphic
I’ll use the following data as basement for this R programming language tutorial:
data <- data.frame(x = 1:3,                      # Create example data
                   y = 1:3,
                   group = LETTERS[1:3])
data                                             # Print example data
#   x y group
# 1 1 1     A
# 2 2 2     B
# 3 3 3     C
The previous output of the RStudio console shows the structure of our example data: A data frame containing three rows and three columns.
If we want to create a plot of the data with the ggplot2 package, we also have to install and load ggplot2:
install.packages("ggplot2")                      # Install & load ggplot2 package
library("ggplot2")
Now, we can plot our data as shown below:
ggp <- ggplot(data, aes(x, y, col = group)) +    # Default ggplot2 plot
  geom_point()
ggp                                              # Draw plot

As shown in Figure 1, the previous R code created a scatterplot and a legend at the right side of our plot.
It’s the default specification of the ggplot2 package to show legends on the right side outside the plot area. The following example explain how to move such a legend to different positions.
Example 1: ggplot2 Legend at the Bottom of Graph
This Example explains how to show a legend at the bottom of a ggplot2 plot in R.
For this, we have to use the theme function and the legend.position argument. The legend.position argument has to be specified to be equal to “bottom”.
ggp +                                            # Move legend to the bottom
  theme(legend.position = "bottom")

As shown in Figure 2, the previous code plotted a ggplot2 graph with a legend at the bottom and horizontally aligned.
Example 2: ggplot2 Legend at the Top of Graph
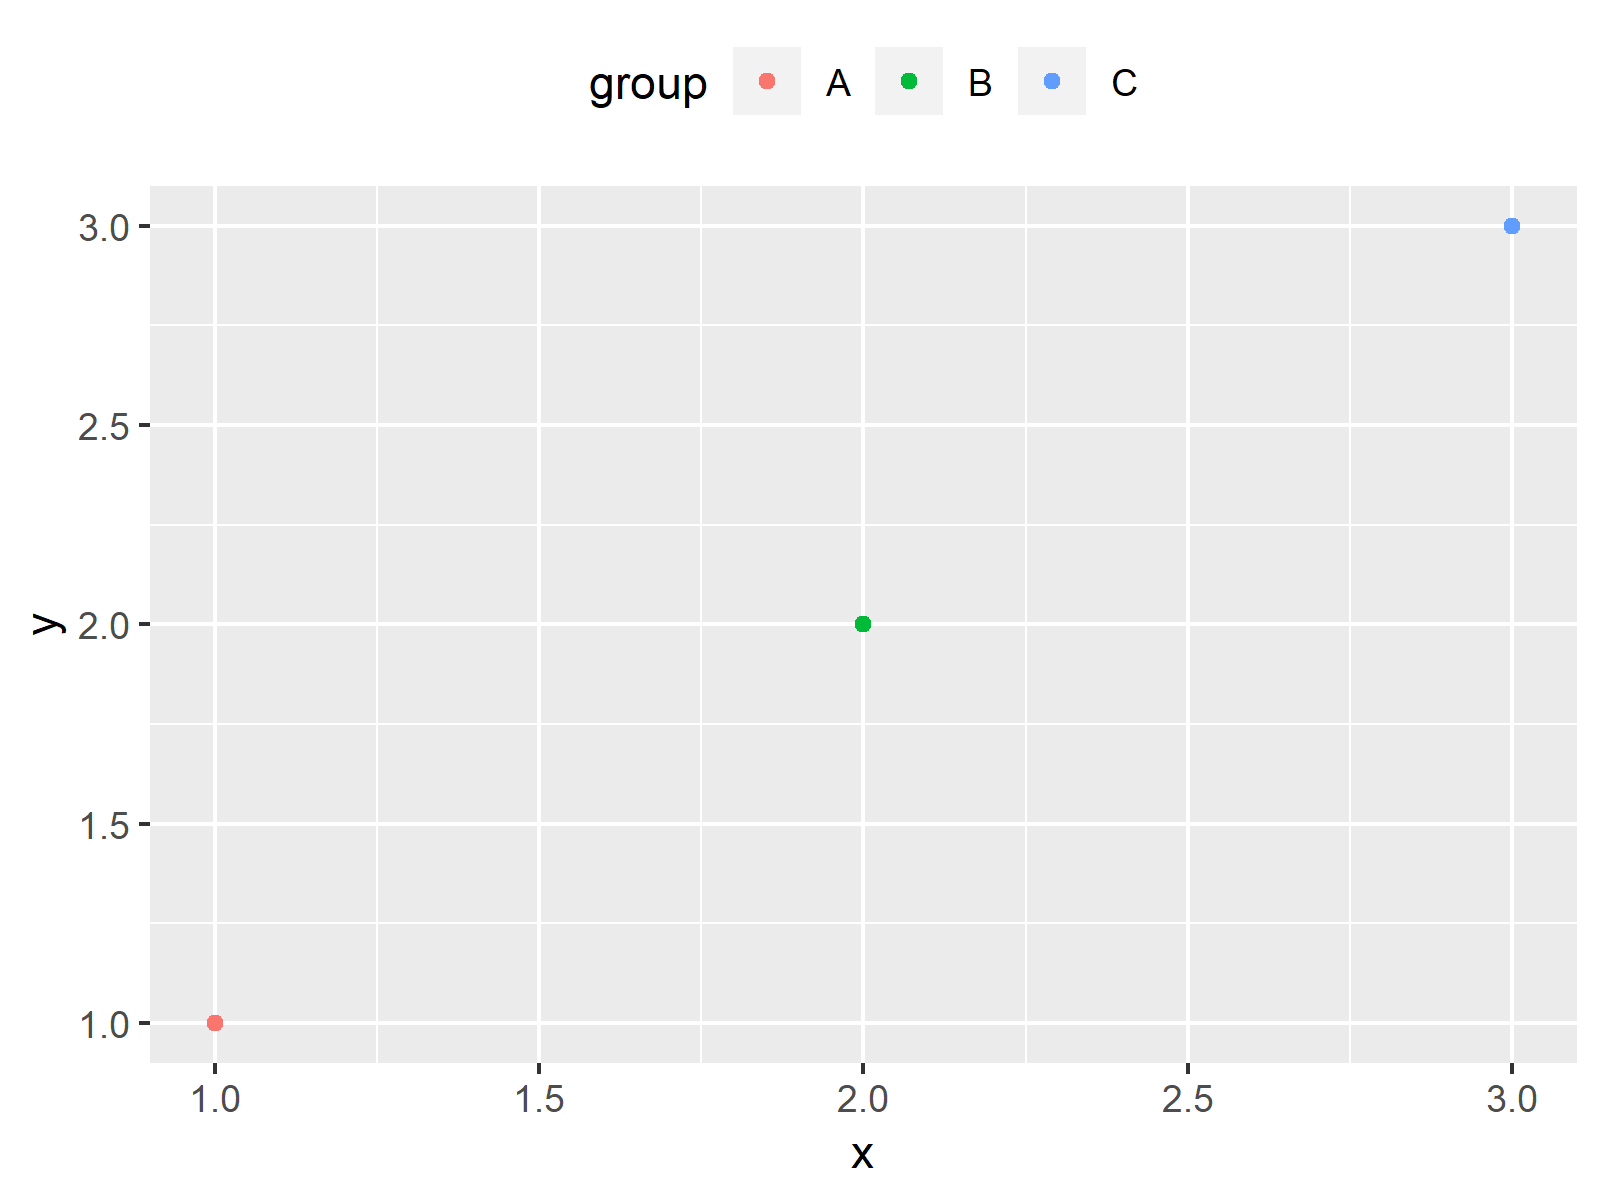
In this Example, I’ll show how to move a ggplot2 legend to the top of a graphic specifying the legend.position to be equal to the character string “top”.
ggp +                                            # Move legend to the top
  theme(legend.position = "top")

As revealed in Figure 3, we plotted a ggplot2 plot with horizontal legend above the plot with the previously shown R programming code.
Example 3: ggplot2 Legend at the Left Side of Graph
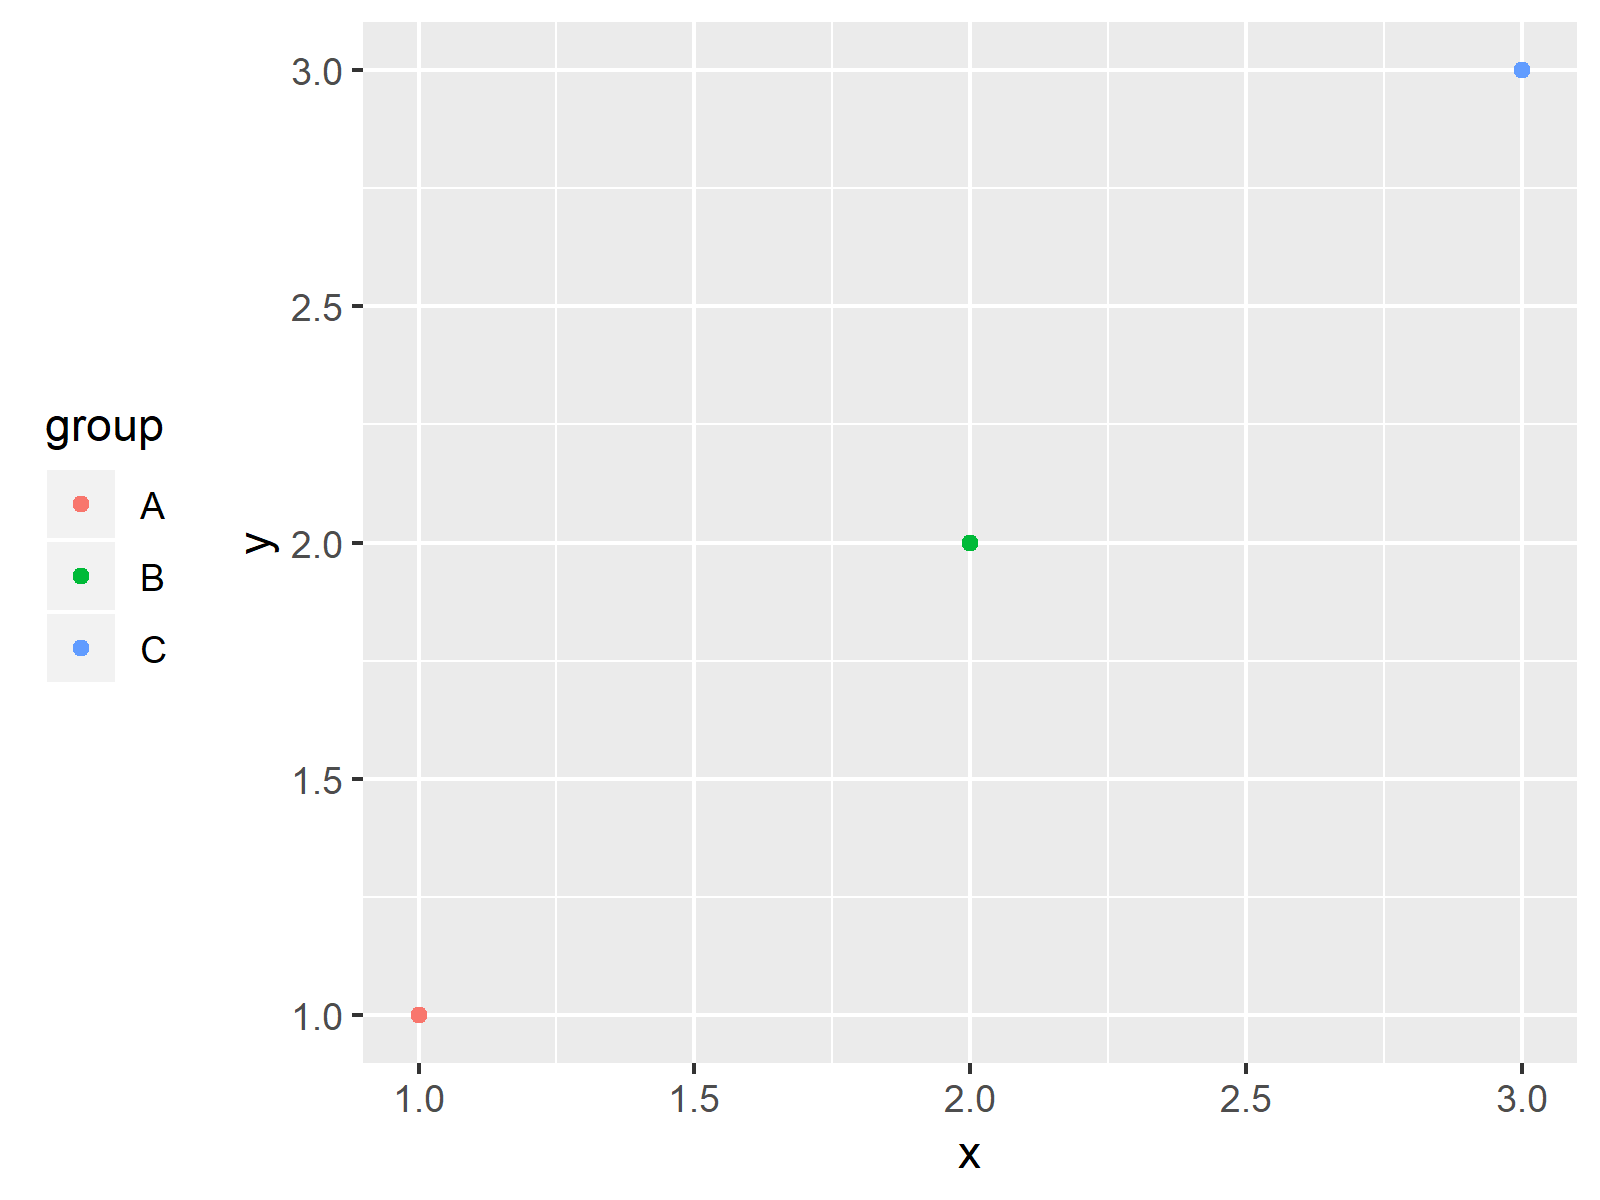
In Example 3, I’ll illustrate how to adjust the legend.position to be equal to “left”.
ggp +                                            # Move legend to the left
  theme(legend.position = "left")

As shown in Figure 4, we created a vertical legend on the left side with the previous syntax.
Example 4: ggplot2 Legend Inside the Graph (Manually Specified)
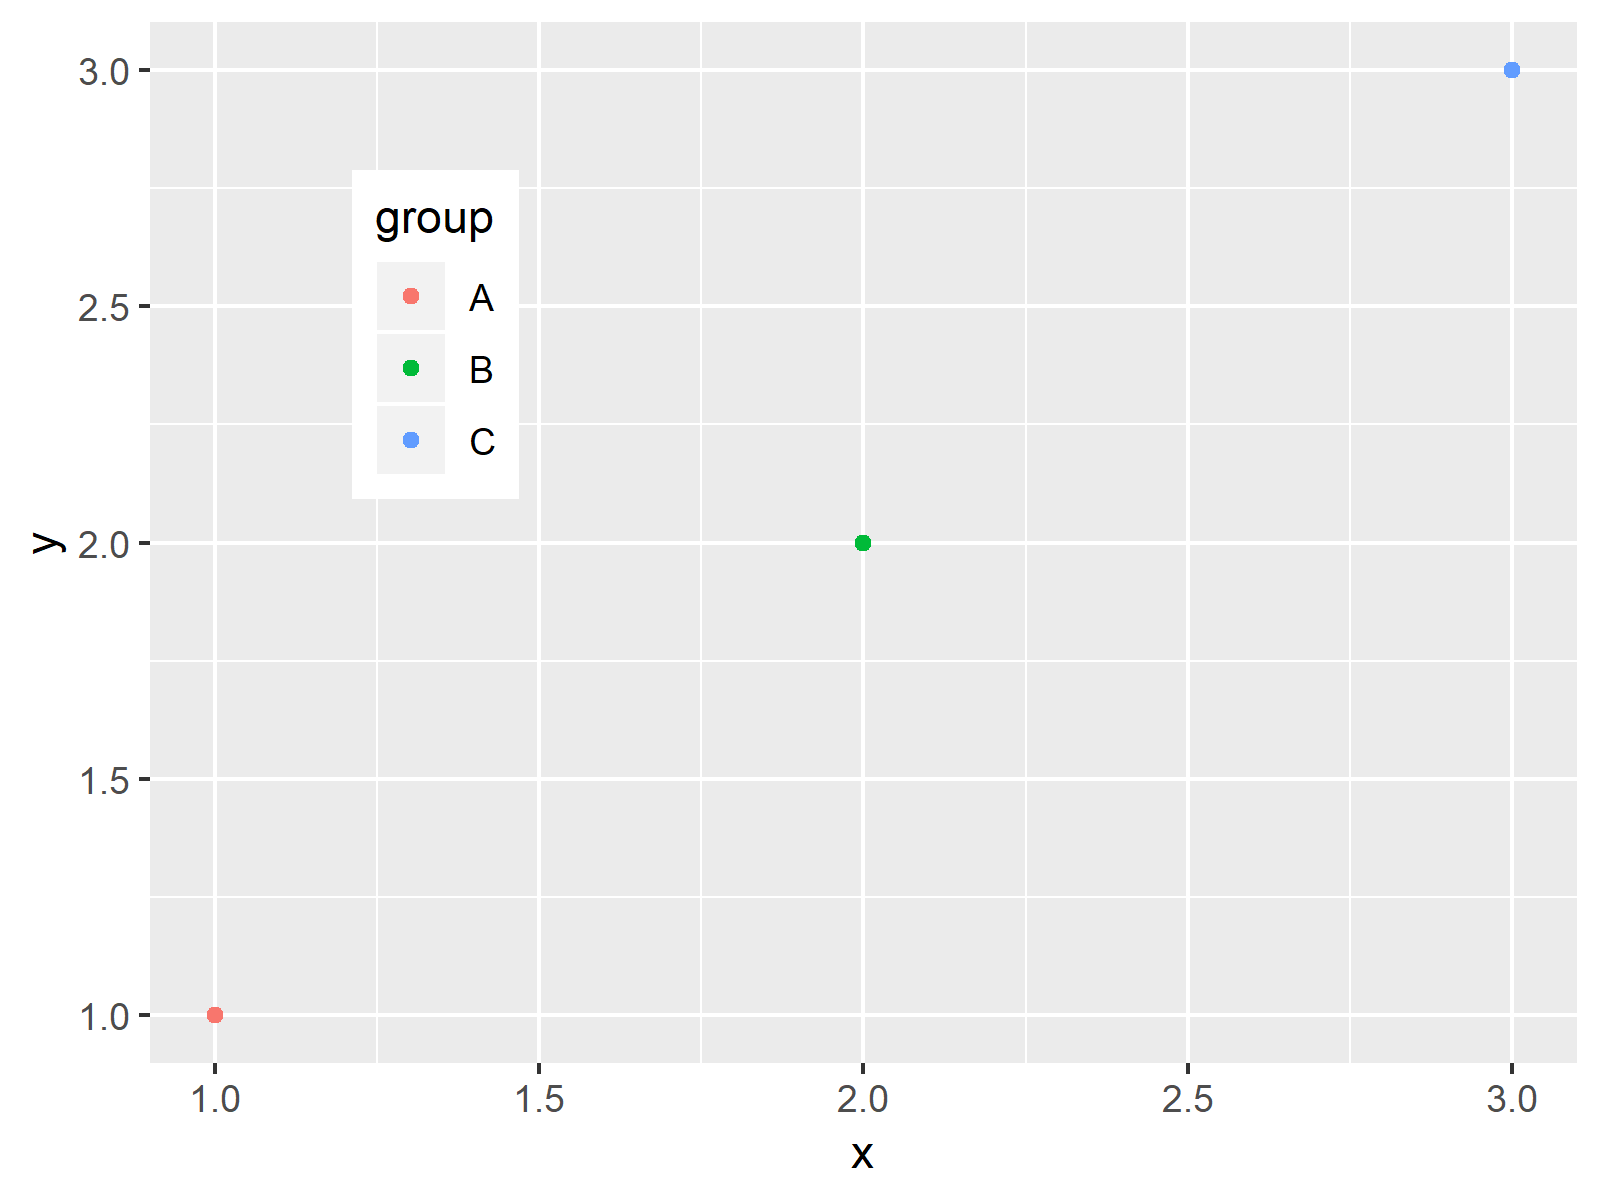
This Example shows how to manually change legend positions using a numeric vector of the length 2. The first value in this vector specifies the positioning on the x-axis of our plot and the second value defines the adjustment on the y-axis.
ggp +                                            # Legend inside the plot
  theme(legend.position = c(0.2, 0.7))

The output of the previous syntax is illustrated in Figure 5: A ggplot2 graphic with a legend inside of the plot area.
Video, Further Resources & Summary
In case you need further info on the examples of the present article, you may want to watch the following video of my YouTube channel.
I’m explaining how to change the legend placement relative to the plotting region based on the R syntax of the present page in the video:
Besides the video, you may want to have a look at the other posts on www.statisticsglobe.com. I have released numerous related tutorials already:
- Change Display Order of ggplot2 Plot Legend
- Create Legend in ggplot2 Plot
- Control Size of ggplot2 Legend Items
- Add Common Legend to Combined ggplot2 Plots
- Graphics Gallery in R
- Introduction to R Programming
You learned in this post how to adjust positions of ggplot2 legends in the R programming language. Tell me about it in the comments section, if you have additional questions.


