Matplotlib vs plotly in Python (Examples)
Data visualization is a crucial aspect of data analysis and presentation in Python. Two popular libraries used for creating visualizations in Python are Matplotlib and plotly.
While both libraries serve the purpose of generating plots and charts, they differ in their approaches, features, and capabilities. In this article, I will explore and compare Matplotlib and plotly, highlighting their strengths, weaknesses, and suitable use cases.
Here is an overview:
Let’s get into the discussion!
A Look at Matplotlib
Matplotlib is one of the most widely used libraries for creating static, publication-quality plots in Python. It provides a comprehensive set of plotting functions and supports a wide variety of plot types, including line plots, scatter plots, bar plots, histograms, and more.
Matplotlib is highly customizable, allowing users to fine-tune every aspect of their plots, from colors and markers to axis labels and annotations.
Let’s see code example.
Plot Example in Matplotlib
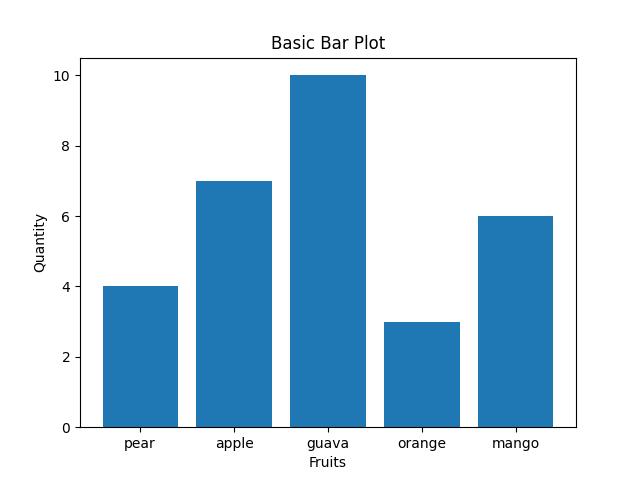
Here, we will build a basic bar plot visualizing a simple DataFrame containing fruits and their quantities. Run the lines of code below to create the bar plot:
import matplotlib.pyplot as plt

import pandas as pd

df = pd.DataFrame(dict(fruits = ["pear", "apple", "guava", "orange", "mango"],
                       quantity = [4,7,10,3,6]))

plt.bar(df['fruits'], df['quantity'])

plt.title("Basic Bar Plot")

plt.xlabel("Fruits")

plt.ylabel("Quantity")

plt.show()

In the above example, we first import both Matplotlib and pandas libraries before we create a simple DataFrame df containing fruit names and their corresponding quantities. The pandas library is useful for constructing and manipulating DataFrames in Python.
Next, we utilize Matplotlib’s pyplot module to generate a basic bar plot, with fruit names on the x-axis and quantities on the y-axis, using the plt.bar() function.
The title, x-axis label, and y-axis label are set using plt.title(), plt.xlabel(), and plt.ylabel() respectively. Finally, the plot is displayed using plt.show().
A Look at plotly
Plotly is a modern and interactive plotting library that offers a rich set of features for creating dynamic and interactive visualizations.
Unlike Matplotlib, which primarily generates static plots, plotly produces interactive plots that can be embedded in web applications or Jupyter notebooks.
Plotly supports a wide range of chart types, including scatter plots, line plots, bar charts, heatmaps, 3D plots, and more. It also provides built-in support for interactivity features such as hover tooltips, zooming, panning, and animation.
Let’s see code example.
Plot Example in plotly
Here, we will build a basic scatter plot visualizing a simple DataFrame containing data points. Run the lines of code below:
import plotly.express as px

import pandas as pd

data = dict(
    x=[1, 2, 3, 4, 5],
    y=[2, 3, 5, 7, 11]
)

df = pd.DataFrame(data)

fig = px.scatter(df, x="x", y="y", title="Simple Scatter Plot",
                 labels={"x": "X-axis Label", "y": "Y-axis Label"})

fig.show()
Here, we first of all import the plotly express module (imported as “px”) and pandas library (imported as “pd”) to create a simple scatter plot.
Next, we define a dictionary data containing two lists: x and y. These lists represent the x and y coordinates of the data points for the scatter plot.
Then, we create a pandas DataFrame df using this dictionary. After that, we employ px.scatter() to generate the scatter plot, specifying df as the data source and defining the x and y columns to be plotted.
We also set the title of the plot and customize the labels for the x and y axes using the labels parameter. Finally, we display the plot using fig.show().
A Comparison of both Matplotlib & plotly
-
Ease of Use: Matplotlib has a slightly steeper learning curve, especially when it comes to customizing plots and fine-tuning details.
Plotly’s syntax is more concise and intuitive, making it easier for beginners to create interactive visualizations quickly.
- Interactivity: Matplotlib primarily generates static plots, although some interactivity can be achieved using plugins or external libraries.
Plotly excels in interactivity, offering built-in support for a wide range of interactive features without requiring additional plugins or libraries
- Output Formats: Matplotlib supports a variety of output formats, including PNG, PDF, SVG, and more, making it suitable for generating static plots for publications or reports.
Plotly’s interactive plots can be exported as HTML files, embedded in web applications, or displayed directly in Jupyter notebooks, allowing for seamless integration with online platforms.
- Community and Documentation: Matplotlib has a large and active community with extensive documentation and resources available online.
Plotly also has a vibrant community and provides comprehensive documentation and tutorials to help users get started with interactive plotting.
Video, Further Resources & Summary
Do you need more explanations on the usefulness and comparison of Matplotlib and plotly in Python? Then you should have a look at the following YouTube video of the Statistics Globe YouTube channel.
In the video, we explain the usefulness and comparison of Matplotlib and plotly in some more detail.
The YouTube video will be added soon.
So, we have examined the usefulness and comparison of both Matplotlib and plotly for creating visualizations in Python. Specific use cases will determine which library to use to create visualizations for analytical projects in Python.
Note that both libraries can be used to create more complex visualizations than the ones demonstrated in this tutorial. For examples, you can take a look at the links below:
- plotly Pareto Chart in Python (Example)
- Animate Interactive plotly Graph in Python (2 Examples)
- plotly Candlestick Chart in Python (3 Examples)
- Add Grid to Plot in Python Matplotlib & seaborn (2 Examples)
- Plot Correlation Matrix in Python Matplotlib & seaborn (2 Examples)
- Introduction to Python Programming
This post has explained the usefulness and comparison of Matplotlib and plotly in Python. I hope you found it helpful! In case you have further questions, you may leave a comment below.
This page was created in collaboration with Ifeanyi Idiaye. You might check out Ifeanyi’s personal author page to read more about his academic background and the other articles he has written for the Statistics Globe website.


