Log Transformation of Data Frame in R (Example)
In this article, I’ll demonstrate how to apply a log transformation to all columns of a data frame in the R programming language.
Table of contents:
You’re here for the answer, so let’s get straight to the example…
Example Data
As a first step, we have to create some data that we can use in the example code later on:
data <- data.frame(x1 = 1:5,    # Create example data frame
                   x2 = 11:15,
                   x3 = 10:6)
data                            # Print example data frame

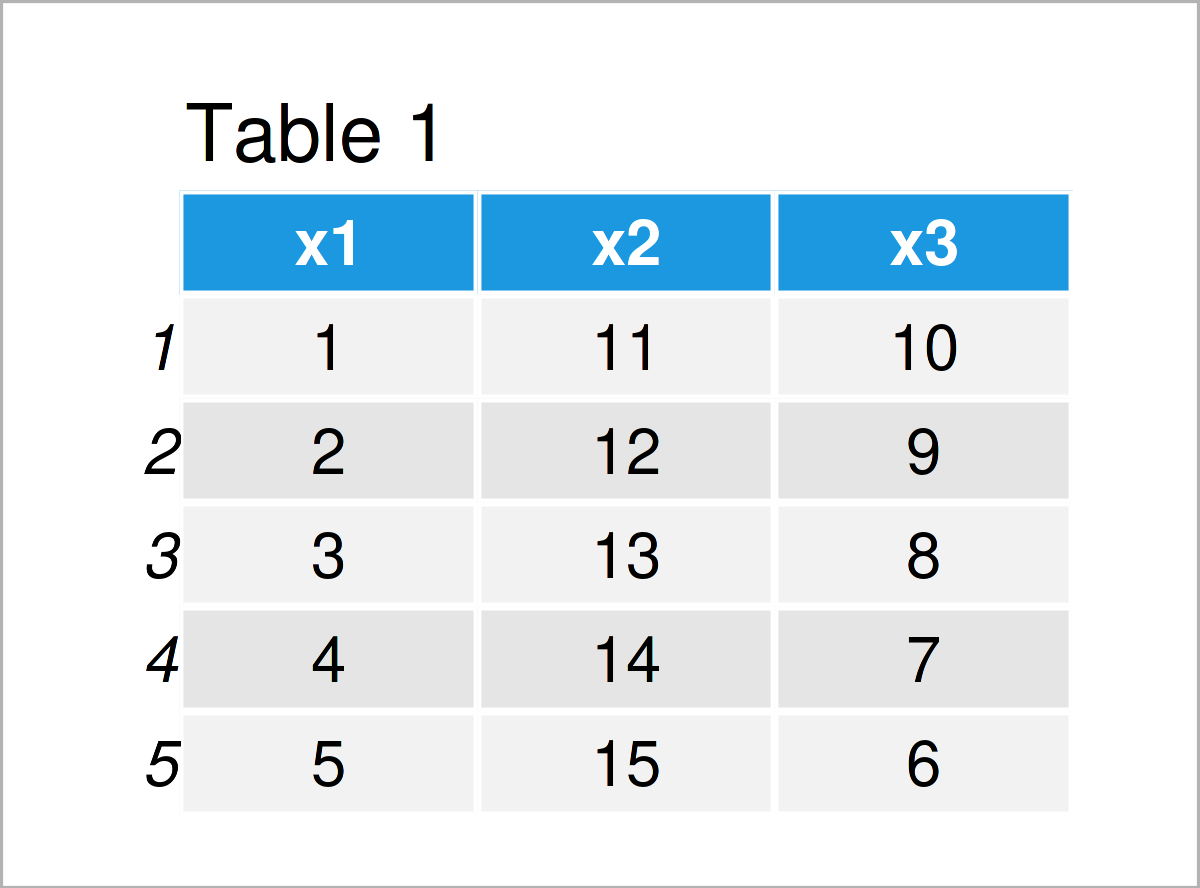
Table 1 shows that our example data consists of five rows and three columns.
Example: Generate Log Transformation of All Data Frame Columns Using log() Function
This example explains how to perform a log transformation for all columns of a data frame.
For this task, we can apply the log function as shown below:
data_log <- log(data)           # Log transformation
data_log                        # Print log transformed data

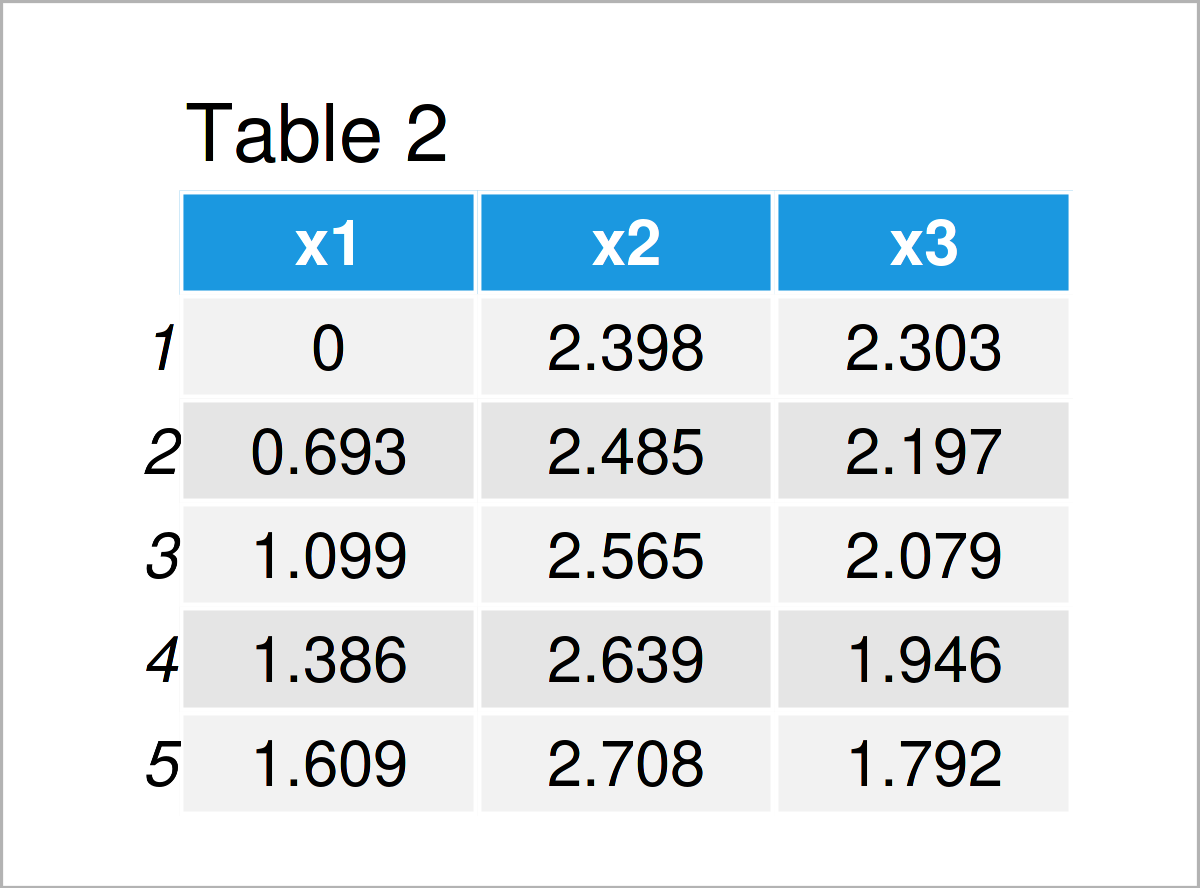
As illustrated in Table 2, we have created a new data frame called data_log, which contains the log transformed values of our input data frame.
Video & Further Resources
Do you want to learn more about the log conversion of all data frame variables? Then you may have a look at the following video tutorial on my YouTube channel. In the video, I’m explaining the examples of this article:
Also, you could have a look at the related RStudio articles on this website. I have published several related articles already.
- Natural, Binary & Common Logarithm
- Transform ggplot2 Plot Axis to log10 Scale
- Draw Histogram with Logarithmic Scale
- All R Programming Examples
Summary: In this article, I have explained how to log transform all columns of a data matrix in the R programming language. If you have further questions, please let me know in the comments section below.


4 Comments. Leave new
Thanks a lot for this educational piece.
My question is how can I back-transform the results when interpreting them? Or there is no need to back-transform them?
Hello Ibrahim,
It can be simply implemented as follows.
Original number = x
Transformed number x’=log10(x)
Back-transformed number = 10^x’
Regarding your second question, there are pros and cons of back transforming. You can check this explanation about presenting results from analyses of transformed data. You can also find some broader explanations in the link.
Regards,
Cansu
Thanks a lot. It’s absolutely helpful.
You are welcome 🙂 Glad to hear that.