Jitter & Position Dodge Simultaneously in ggplot2 Plot in R (Example)
This tutorial explains how to jitter and dodge at the same time in a ggplot2 plot in the R programming language.
The content is structured as follows:
Let’s dive right into the tutorial…
Example Data, Software Packages & Default Plot
To start with, I’ll have to construct some example data:
set.seed(2967835)                     # Create example data frame
data <- data.frame(group = LETTERS[1:4],
                   subgroup = letters[1:3],
                   value = rnorm(600))
head(data)                            # Print head of example data frame
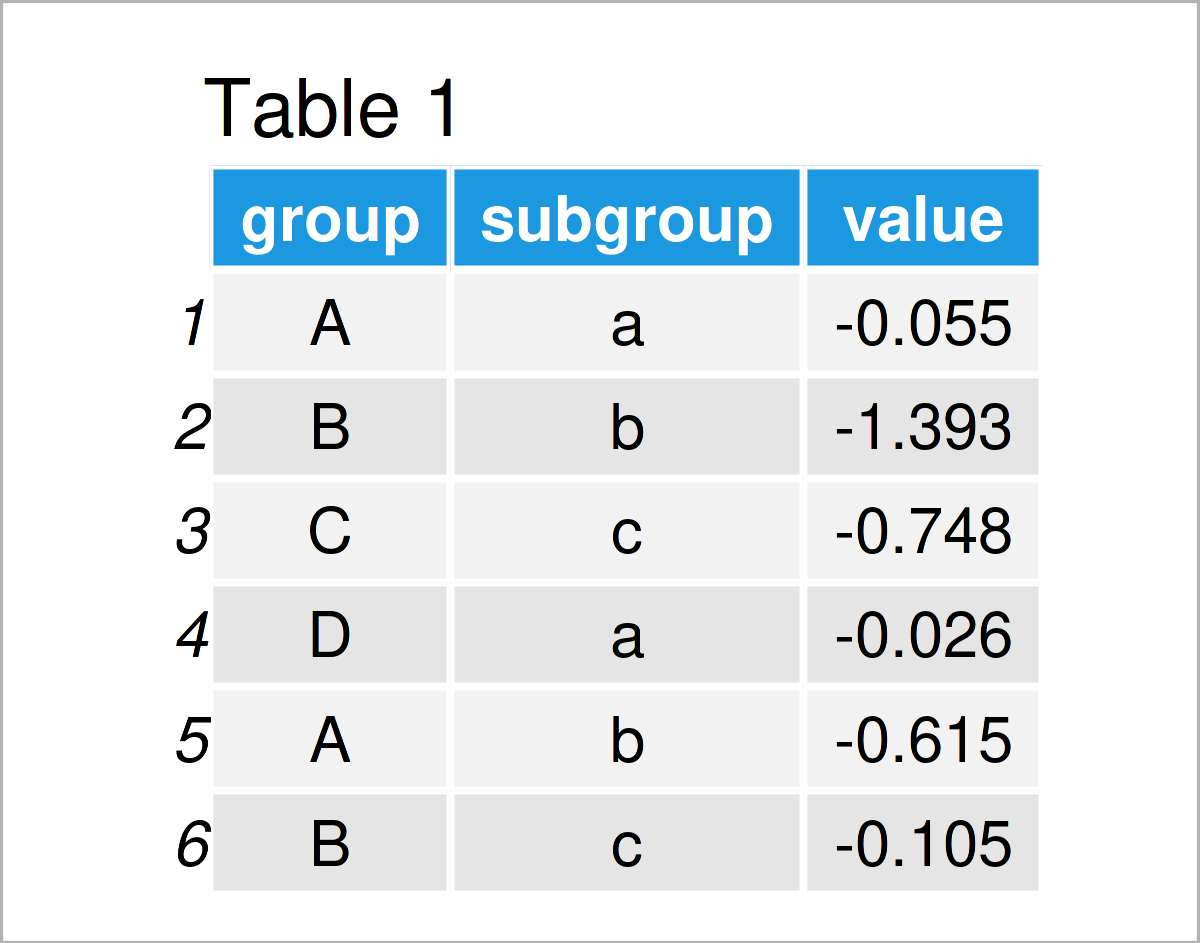
Have a look at the previous table. It shows the first six lines of our example data, and that our data is constituted of three columns.
The columns group and subgroup are group indicators, and the column value contains randomly distributed numeric values.
We also have to install and load the ggplot2 package, in case we want to use the functions that are included in the package:
install.packages("ggplot2")           # Install & load ggplot2 package
library("ggplot2")
As a next step, we can plot our data:
ggplot(data,                          # Draw ggplot2 boxplot with position dodge
       aes(x = group,
           y = value,
           fill = subgroup)) +
  geom_boxplot(position = position_dodge(width = 0.7))
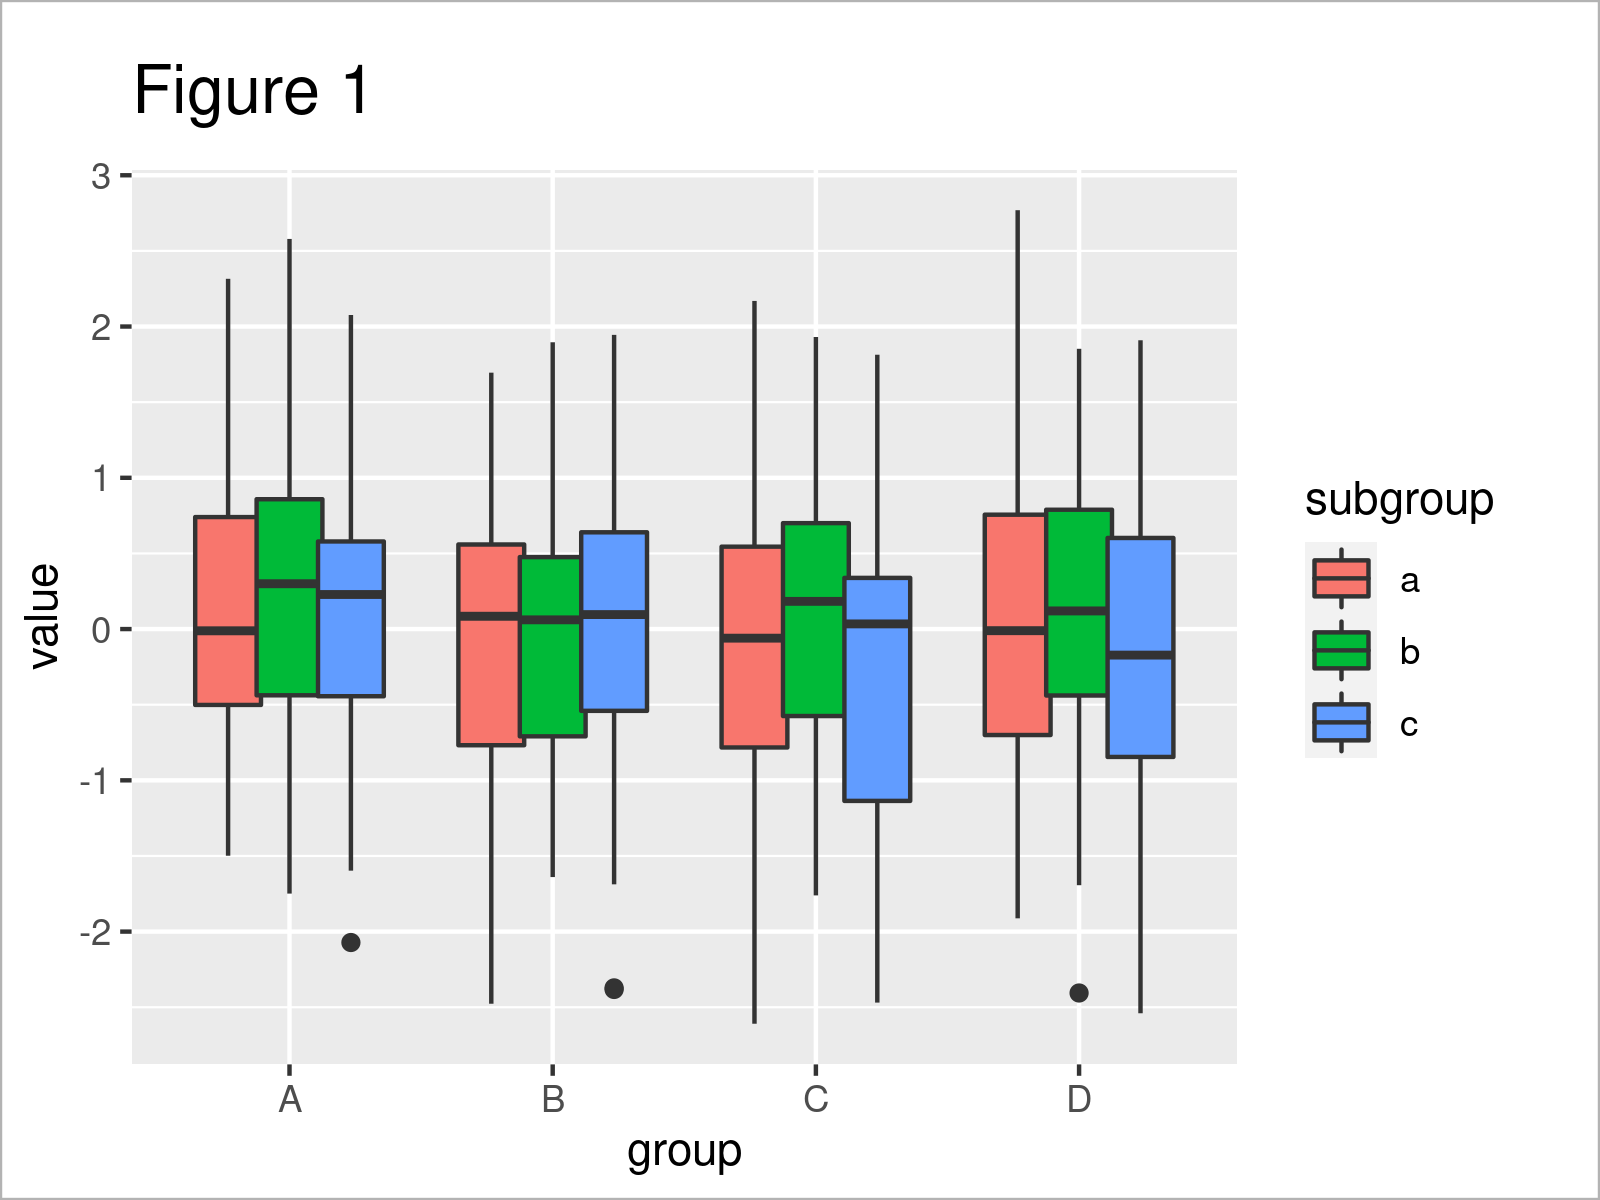
In Figure 1 it is shown that we have managed to create a ggplot2 boxplot with position dodge specifications (i.e. the boxes are slightly overlapping each other).
Let’s assume that we also want to show our boxplot points with a certain level of jitter. Then, we might try to use the geom_point and position_jitter functions as shown below:
ggplot(data,                          # Jitter does not work properly
       aes(x = group,
           y = value,
           fill = subgroup)) +
  geom_boxplot() +
  geom_point(position = position_jitter(width = 0.1))
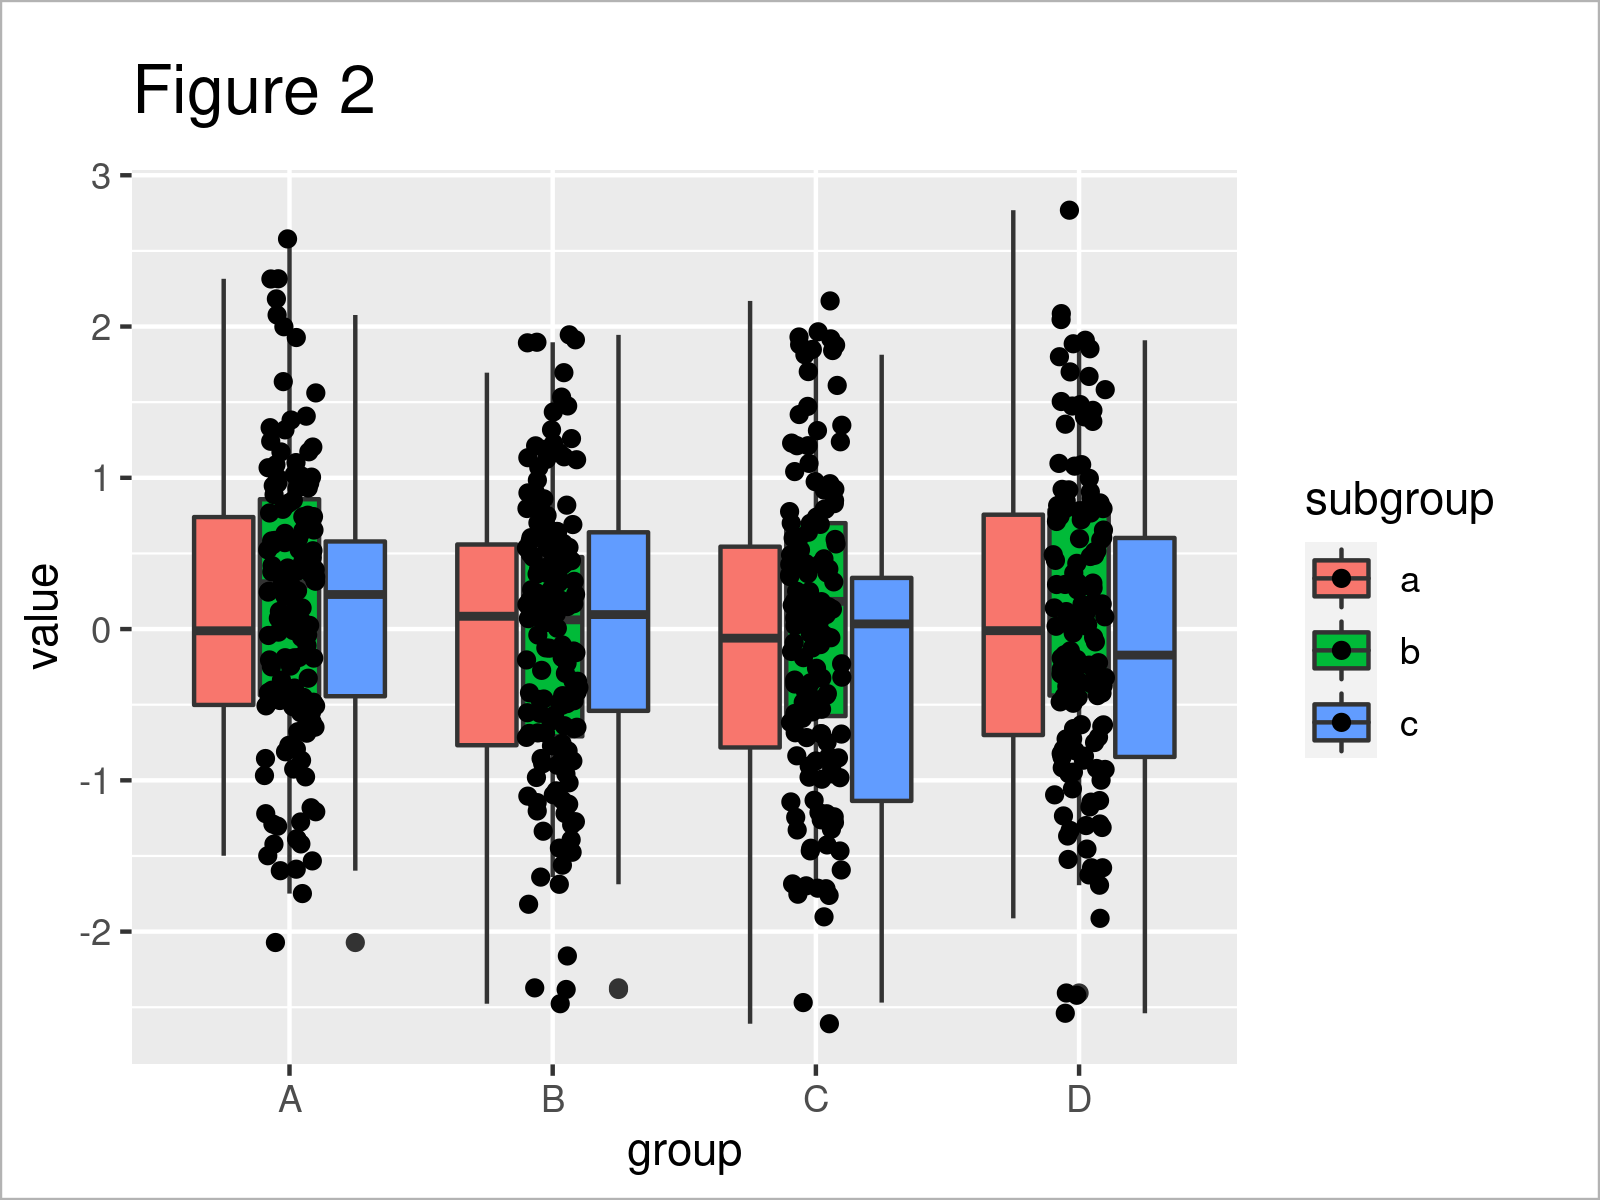
As shown in Figure 2, we have created a new version of our boxplot, where we have added jittered points on top of the boxes.
However, unfortunately, all the jittered points are centered around the middle of each group – the different subgroups are not reflected.
In the following example, I’ll show you how to avoid this problem. So keep on reading!
Example: Draw ggplot2 Boxplot with Jitter & Position Dodge Using position_jitterdodge() Function
In this example, I’ll demonstrate how to use jitter and position dodge simultaneously.
For this task, we can use the position_jitterdodge function within the geom_point function.
Within the position_jitterdodge function, we can specify several arguments such as jitter.width and dodge.width.
Make sure that the dodge.width argument within position_jitterdodge is set to the same value as the position_dodge width within the geom_boxplot function (i.e. 0.7).
The jitter.width argument can be specified according to your personal preferences.
Let’s draw our graph:
ggplot(data,                          # ggplot2 boxplot with jitter & dodge
       aes(x = group,
           y = value,
           fill = subgroup)) +
  geom_boxplot(position = position_dodge(width = 0.7)) +
  geom_point(position = position_jitterdodge(jitter.width = 0.1,
                                             dodge.width = 0.7))
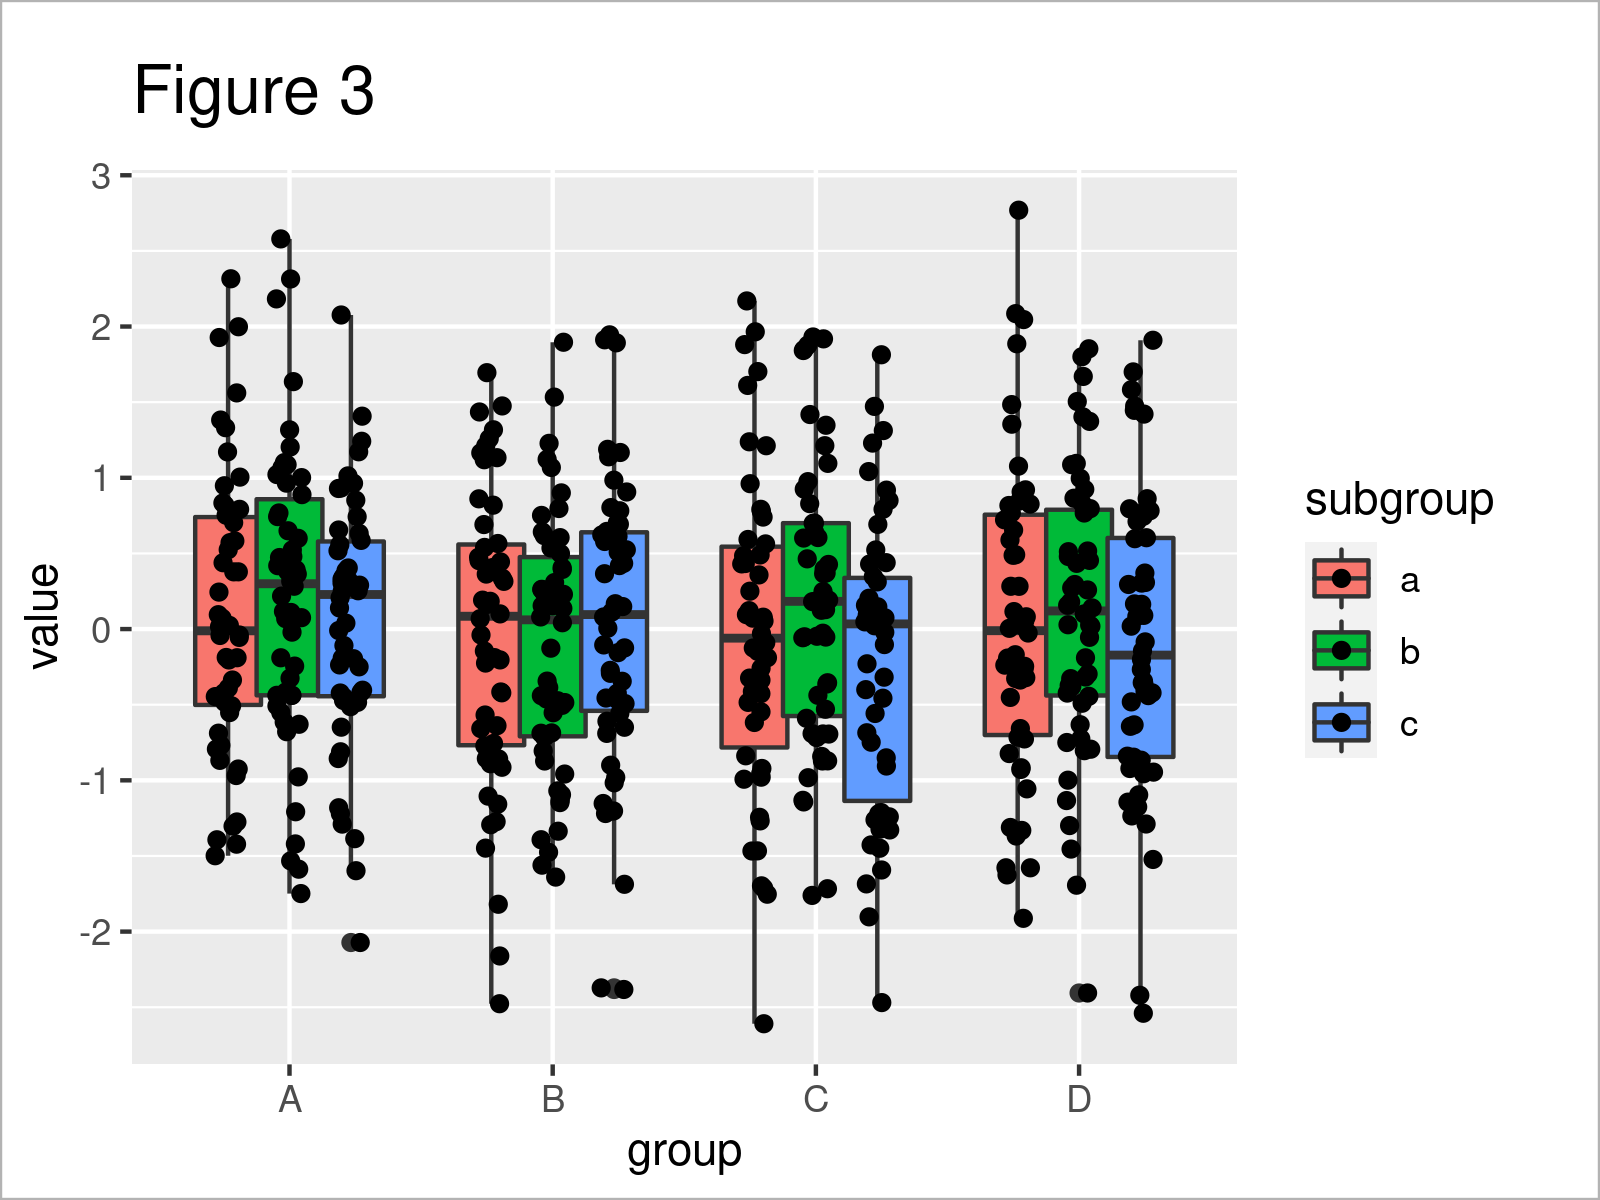
In Figure 3 you can see that we have drawn a ggplot2 boxplot with jitter and position dodge together.
We may also adjust the design of the points to make our graphic even prettier. In the following R syntax, I’m setting the fill color of the jittered points to be equal to the subgroup colors, and I’m changing the pch argument to show a black border around the points:
ggplot(data,                          # Change colors of jitter points
       aes(x = group,
           y = value,
           fill = subgroup)) +
  geom_boxplot(position = position_dodge(width = 0.7)) +
  geom_point(position = position_jitterdodge(jitter.width = 0.1,
                                             dodge.width = 0.7),
             aes(fill = subgroup),
             pch = 21)
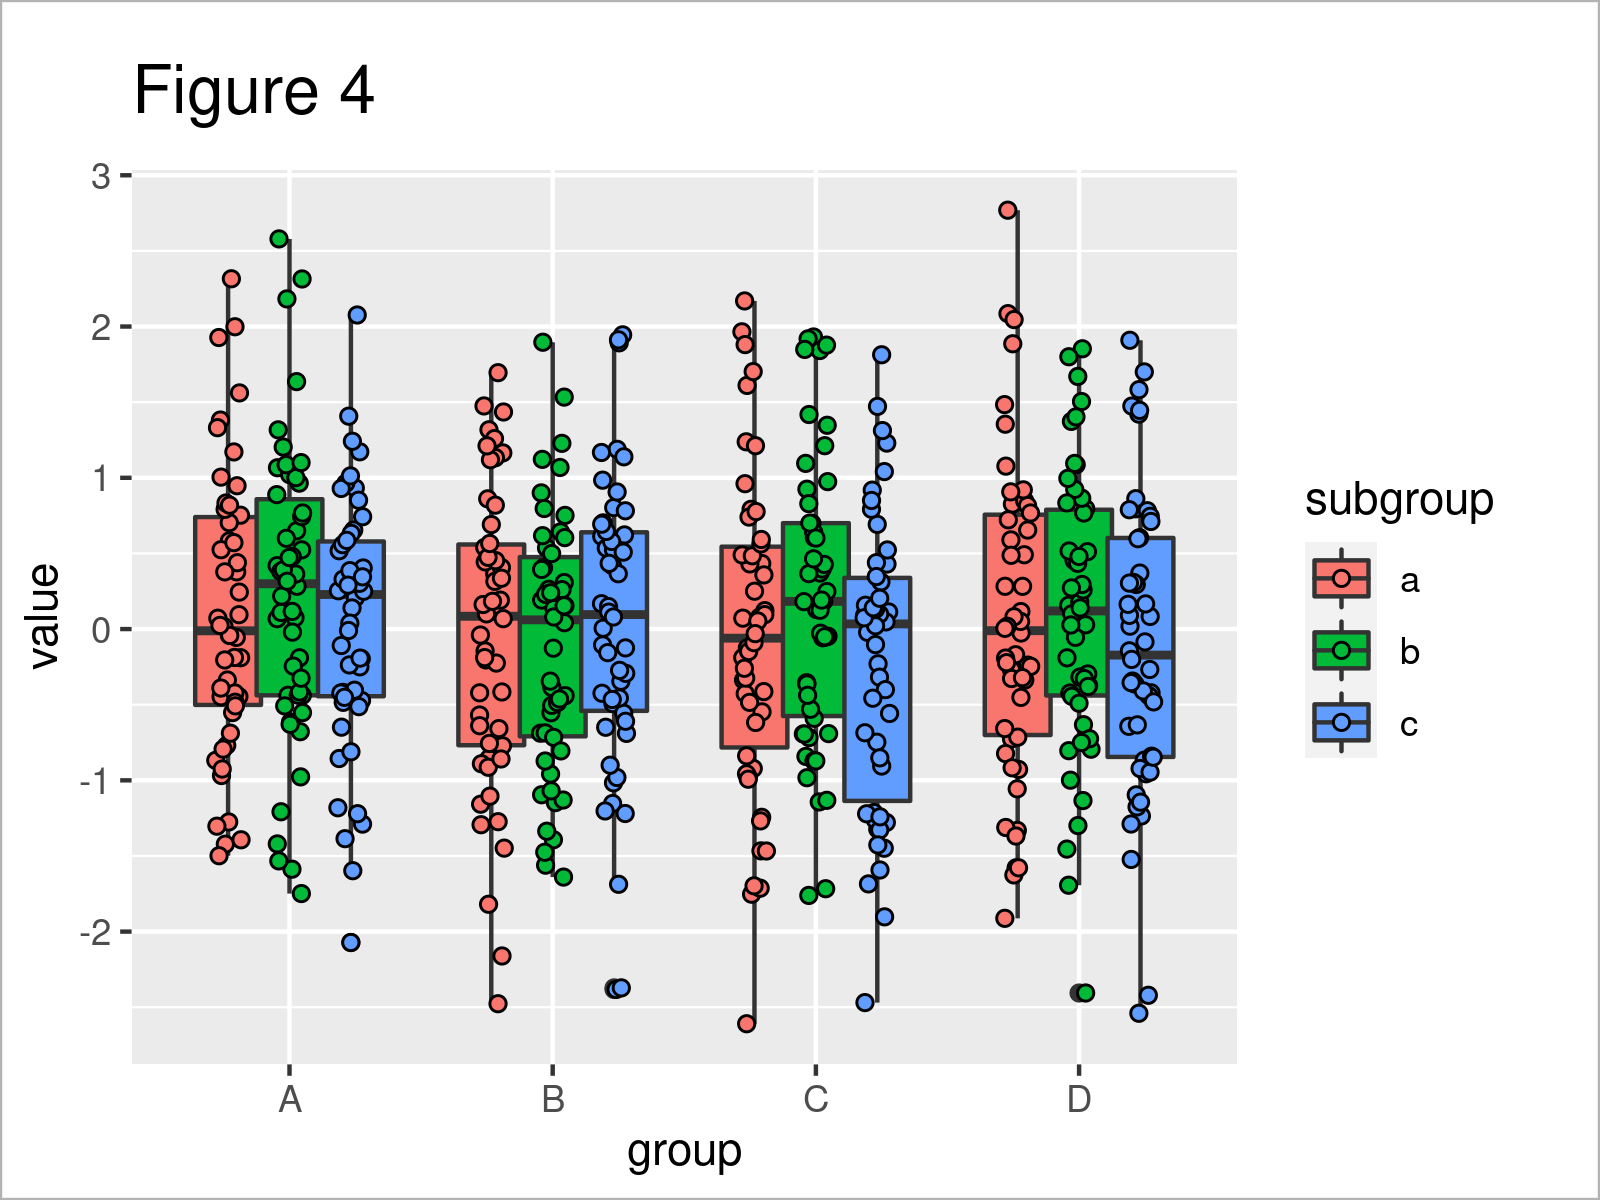
As shown in Figure 4, we have created an updated version of our jitter and position dodge boxplot where the color and style of the points has been changed.
Looks great! 🙂
Video & Further Resources
Do you want to learn more about the simultaneous jittering and dodging in a ggplot2 plot? Then you may want to have a look at the following video tutorial on my YouTube channel. I’m explaining the R code of the present article in the video.
Furthermore, you may want to have a look at the related tutorials on this website:
- Change Legend Labels of ggplot2 Plot in R
- Add Greek Symbols to ggplot2 Plot
- Draw ggplot2 Plot with Different Background Colors by Region
- Remove Labels from ggplot2 Facet Plot in R
- Graphics Overview in R
- The R Programming Language
In this tutorial, I have demonstrated how to simultaneously jitter and dodge in a ggplot2 graphic in R programming. Please let me know in the comments below, in case you have further questions or comments.



2 Comments. Leave new
Hello,
Thank you for providing this great resource! I have a similar case where I made a dodged boxplot but I added a geom_text layer to display the mean percentage on the graph. Is there any way to offset them not randomly (not jittered) with a single parameter/function? Or, do I have to manually set the position of each value?
If you can help, that would be greatly appreciated: https://stackoverflow.com/questions/76239191/automatically-adjust-vertical-position-of-dodged-geom-text-on-box-and-whisker-gg
Hello Daniel,
I am afraid that you have to do it manually. I myself couldn’t find a more practical way to do it. Let s know if you found an alterative! Your contribution would be appreciated!
Regards,
Cansu