grid Function in R (3 Examples)
On this page you’ll learn how to add a grid to a plot using the grid function in the R programming language.
Table of contents:
Let’s start right away.
Example 1: Basic Application of grid() Function
Example 1 explains how to apply the grid function to add a grid layout to a plot created by the basic installation of the R programming language (i.e. Base R).
For this, we first have to create a graphic using the plot function. Then, in the next step, we can apply the grid function to overlay a grid on top of this plot. Within the grid function, we have to specify the number of cells of the grid in the x and y directions.
Consider the following R code:
plot(1:10)                  # Create plot
grid(2, 2)                  # Add grid

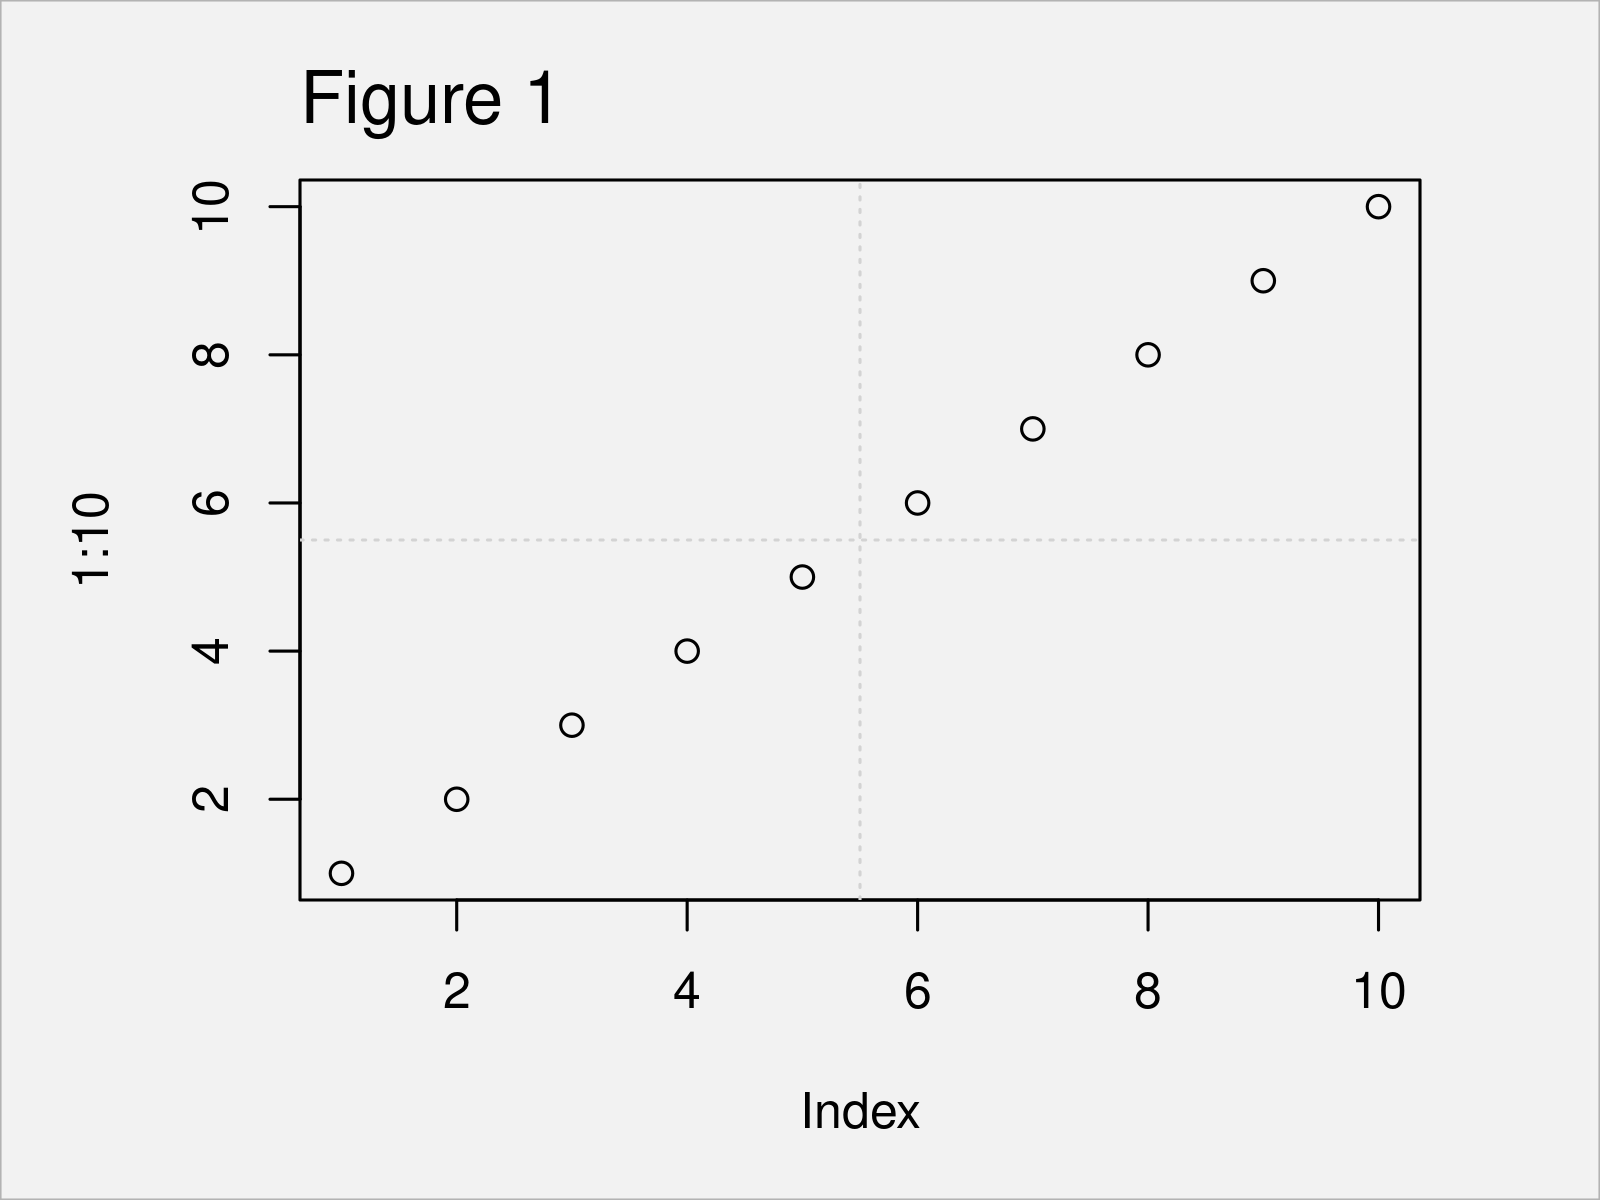
In Figure 1 you can see that we have created a scatterplot with a grid on top. Since we have specified 2,2 within the grid function, we have divided the grid in two cells on both the x- and y-axes.
Example 2: Create Multiple Grid Lines Using grid() Function
In Example 2, I’ll illustrate how to draw a grid with multiple grid lines.
For this, we simply have to increase the number of cells within the grid function:
plot(1:10)                  # Create plot
grid(3, 5)                  # Add grid

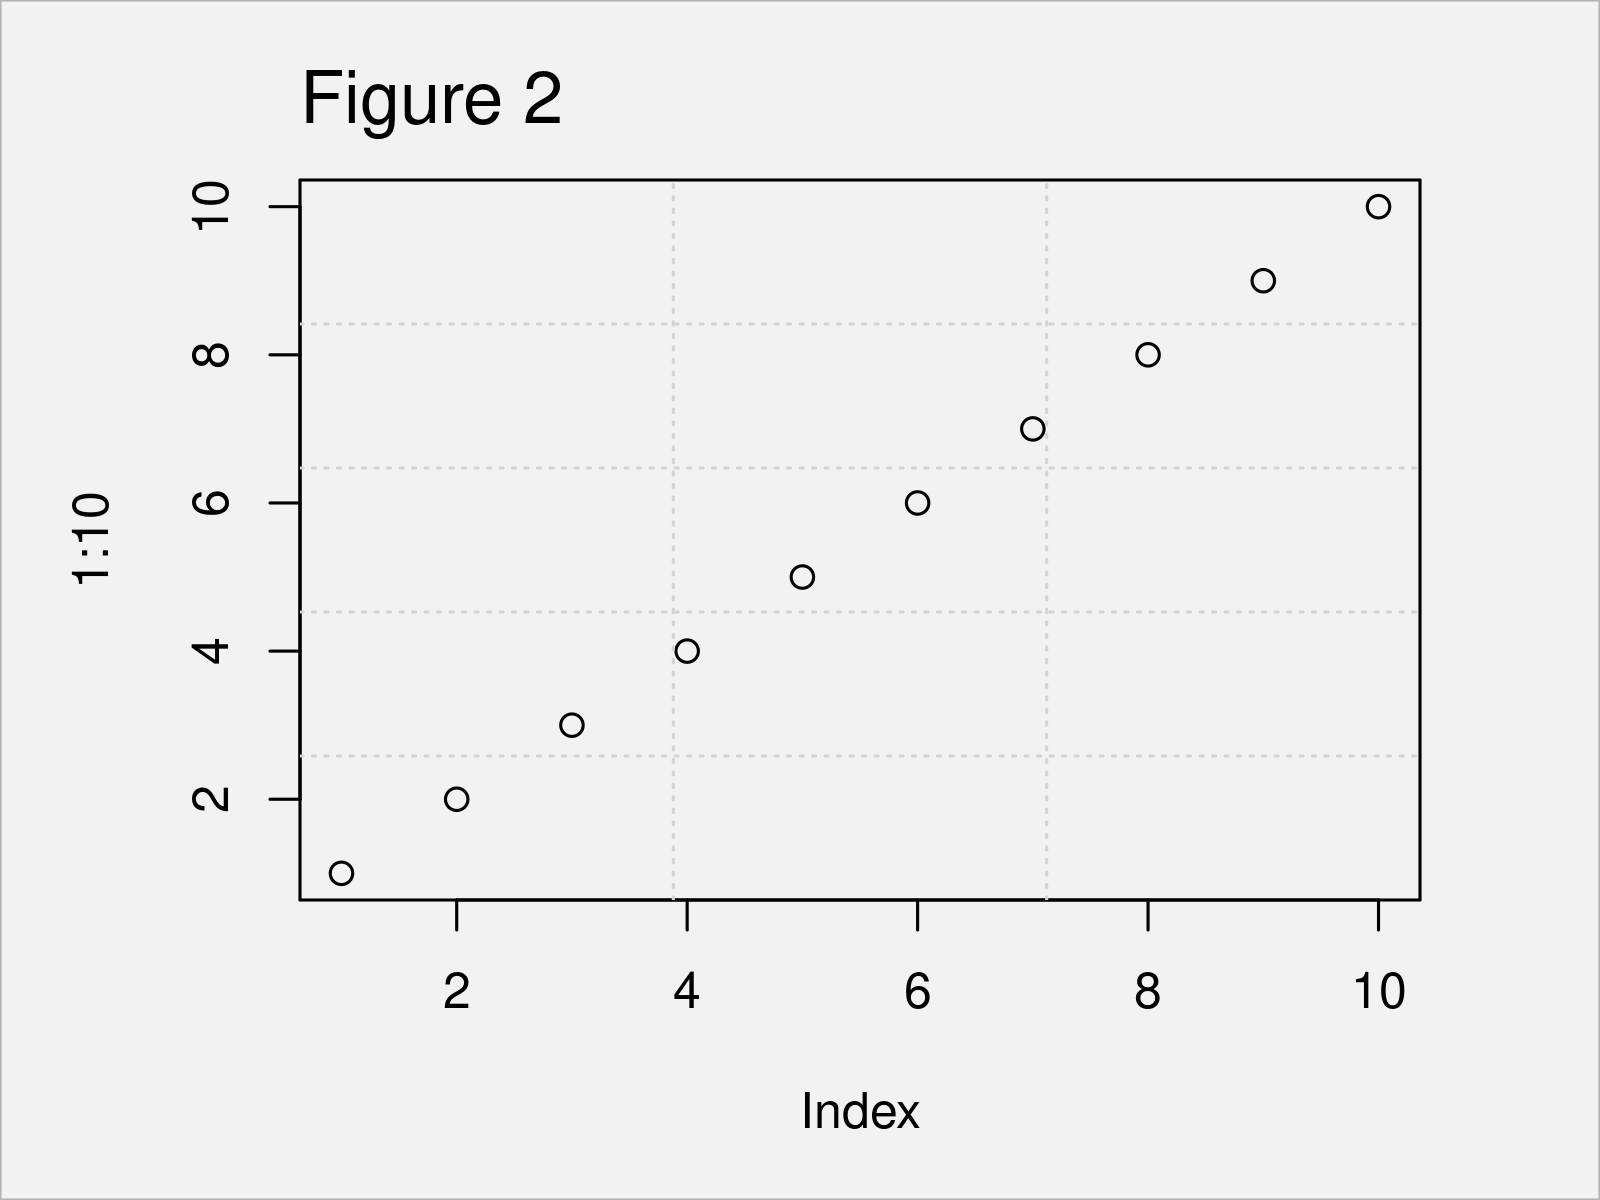
As shown in Figure 2, the previous R syntax has created a Base R graph with multiple grid lines.
Example 3: Modify Color, Line Type & Thickness of Grid
In this example, I’ll show how to modify the look of the grid lines.
The following R code changes the color, the line type, and the line thickness of the grid lines:
plot(1:10)                  # Create plot
grid(3, 5,                  # Add grid
     col = "red",           # Change color
     lty = "dashed",        # Change line type
     lwd = 2)               # Change line thickness

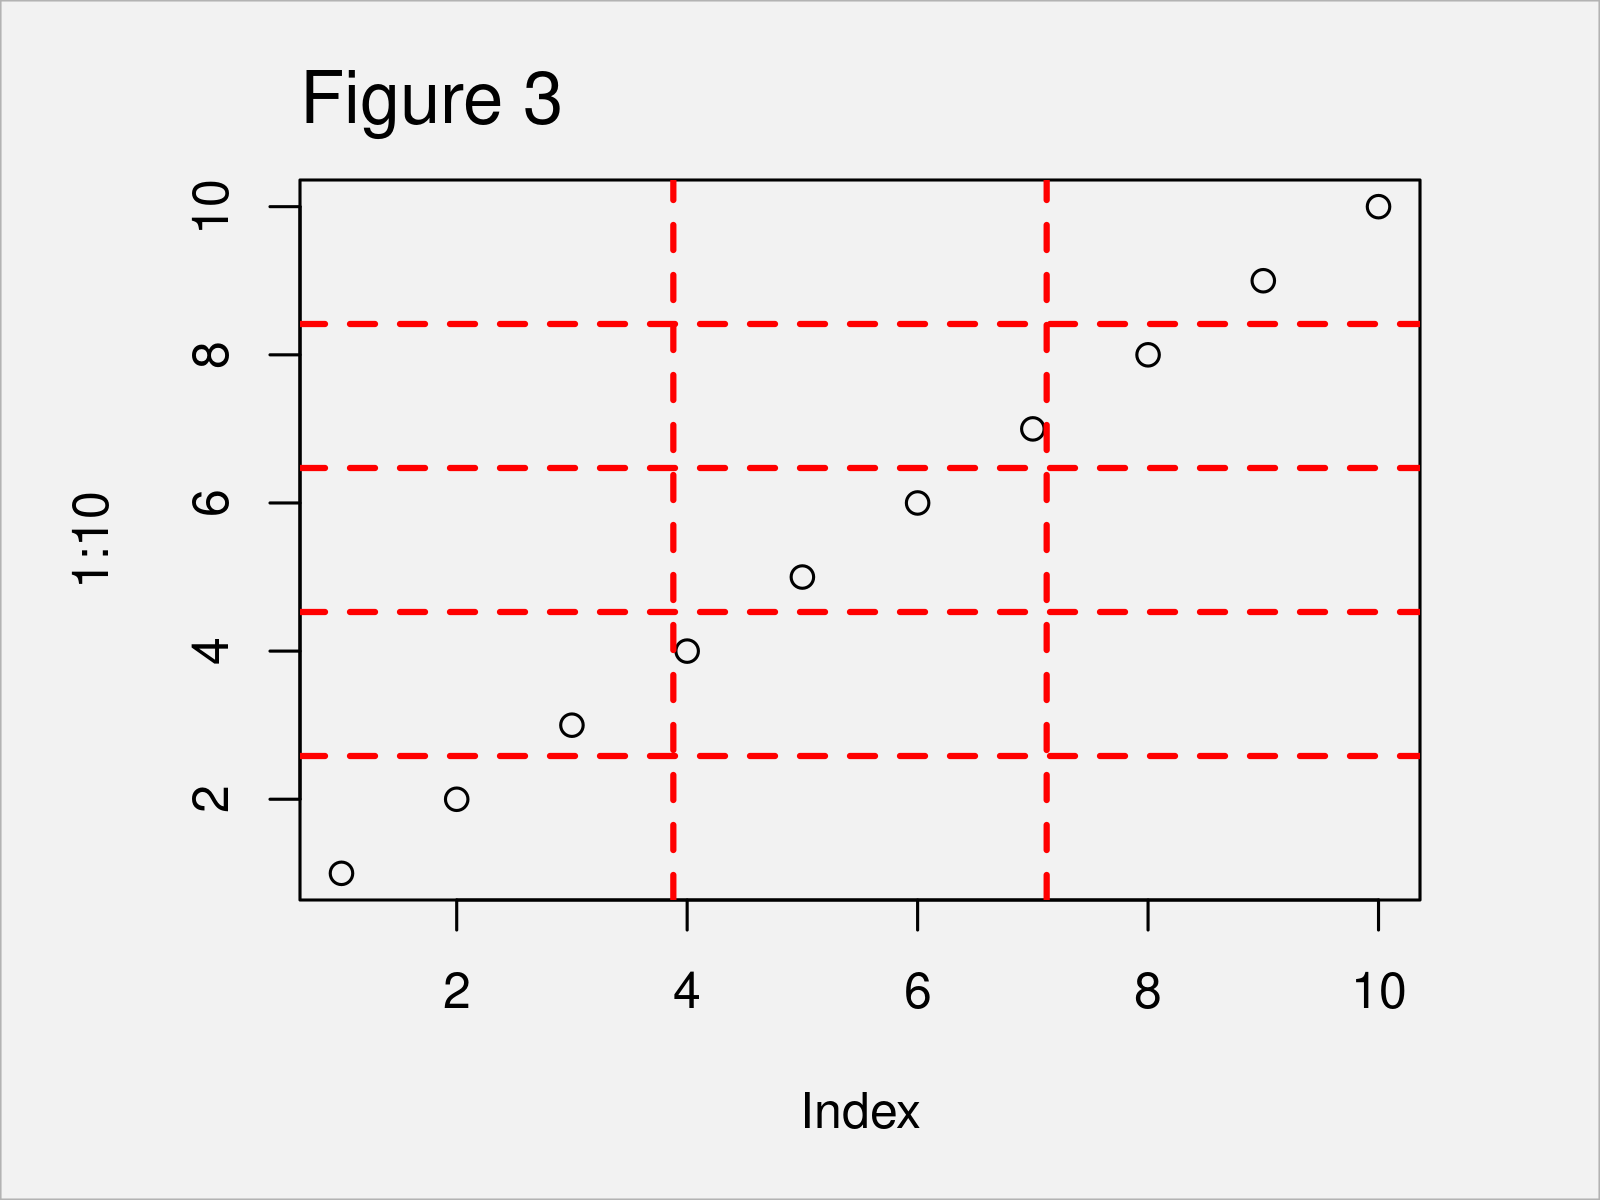
In Figure 3 it is shown that we have created another scatterplot with a manually defined grid design.
Video, Further Resources & Summary
If you need more explanations on the R programming syntax of this article, you could have a look at the following video on my YouTube channel. I’m illustrating the topics of this article in the video tutorial:
In addition, you might want to read the other articles on my website. I have published numerous other articles already:
- Add Grid Line Consistent with Ticks on Axis to Plot
- Modify Major & Minor Grid Lines of ggplot2 Plot
- Remove Vertical or Horizontal Gridlines in ggplot2 Plot
- Arrange Grid of Plots in Base R
- Built-in R Functions (Example Codes)
- Introduction to R Programming
To summarize: In this R programming tutorial you have learned how to overlay a grid on top of a graphic using the grid function. Don’t hesitate to let me know in the comments, in case you have additional questions. Furthermore, don’t forget to subscribe to my email newsletter to receive updates on the newest articles.


2 Comments. Leave new
how to find minima by using grid function
Hey Devika,
Could you specify what you mean with minima? Are you looking for the minimum value in a data set?
Regards,
Joachim